Using GIS for estimating the spatial distribution of land value in metropolitan Beirut
Автор: Kamal T. Azar
Источник: http://libraries.maine.edu/Spatial/gisweb/spatdb/urisa/ur94072.html
Автор: Kamal T. Azar
Источник: http://libraries.maine.edu/Spatial/gisweb/spatdb/urisa/ur94072.html
Abstract: As the city of Beirut rebuilds, housing planners are especially interested in the spatial pattern of market pressure for redevelopment. This special interest in the spatial pattern is triggered by the need to rebuild infrastructure strategically, and the development limitations caused by the mountainous terrain in the Beirut metropolitan area. Although much of the data needed to calibrate traditional land value models are not available, GIS capabilities can be used to juxtapose and interpret off‑the‑shelf data to quantify some of the factors that influence land value in Beirut. These factors are related to (1) location and aesthetics (whether a parcel has panoramic views), (2) topography (slope and aspect of land), and (3) accessibility (how far a piece of land is from major highways). GIS can be used to calculate some of these factors and to represent the spatial distribution of the land value. The 3‑dimensional terrain modeling capability of GIS can be used to estimate the visibility factors of different land parcels and to compute the topographic factors such as aspect and slope. The buffering tools of GIS are also useful in determining accessibility to major highways. Finally, the GIS capability to overlay multiple layers of data and analyze different parameters across these layers is useful in representing land value.
In this paper, we demonstrate how the GIS can provide decision makers with the tools to understand the distribution of land value and how such tools can he used to support different land use policies and targeting specific areas for development and urban growth. This paper is part of a research project between the American University of Beirut and the Computer Resource Laboratory at MIT.
Land value research can be conducted at several levels of analysis. It can range from aggregate or regional analysis to the study of price determination for a particular parcel of land. Planners are generally interested in determining land prices in order to better formulate taxation policies, regulate urban land markets and growth pressure, enable integrated development, and allow communities to share in the appreciation of land values that usually accompanies urbanization.
In fact, urban planning and the urban land market are two mechanisms that interact in
determining the use and the value of urban land. In general, urban planning has the objectives of regulating land use and targeting infrastructure development in order to steer land markets toward desirable spatial patterns of land use. Urban land markets typically adjust land prices in response to the supply and demand for convenient land for various land use and, on occasion, can limit or reduce the capacity of planning to steer land use patterns.
In Beirut, planners are concerned with providing adequate affordable housing in an orderly temporal and spatial pattern. Land value has sky‑rocketed and, in real terms, has increased while wages have decreased in the city. The gap between the prices of housing and the financial capabilities of the average lebanese has widened as a result of the war in Lebanon. Understanding the geographical distribution of land value is important for the housing planners in Beirut. It permits the targeting of specific areas for the implementation of specific land use, zoning regulations, or infrastructure investment that might then induce the urban market to provide the required housing.
In this paper we first discuss the objectives of this research and the purpose of using GIS to estimate the spatial distribution of land value. We then discuss the factors and parameters that influence land price and the different methods, models, or approaches that are usually used to estimate land value. A description of the factors that are identified in Lebanon to influence the value of land then follows. We then discuss the use of GIS in calculating these parameters and in displaying the geographical distribution of land value. The paper concludes with a discussion of the advantages and limitations of using GIS in calculating these factors and in identifying specific land use, land policies, and zoning regulations that can help meet specific housing and planning objectives.
This paper reports parts of the results of a research project between the Computer Resources Laboratory (CRL) of the School of Architecture and Planning at MIT and the Faculty of Engineering and Architecture at the American University of Beirut (AUB). The research is aimed at investigating the use of GIS in rebuilding the urban structure of Metropolitan Beirut. The objective of this research is to design a geographic database model that can serve the different research projects dealing with issues of reconstruction of Lebanon such as housing, transportation, electric power supply, water, sewerage, etc.
The purpose of using GIS in this research is twofold. The benefits of the research are perceived to be operational on both academic and practical levels. Building up a GIS platform would enable both faculty and students body at AUB to be exposed to and train on GIS technology and its use. On the practical level, this research is of interest to the public sector and hence support architecture and planning activities of reconstruction in Lebanon.
The purpose of this paper is to describe the value of using GIS in representing the spatial distribution of land value in the Beirut Metropolitan Area (BMA) and in targeting specific areas for development. Identifying specific areas where certain land value criteria are met for housing development can be accomplished through the use of GIS technology. Estimating land value is one of the most important procedures that housing planners need to conduct in order to set housing policy and land use regulations. GIS technology can also play a major role in estimating land value parameters or in identifying factors that influence land value in the BMA.
In 1977 it was estimated that Lebanon needed as many as 400,000 new dwelling between 1978 and 1999 to avoid a serious housing crisis. This crisis was further exacerbated by the escalation of the warring activities that resulted in the destruction of many of the existing housing stock and the reduction in the housing starts in the years after.
With the cessation of the warring activities, planners are currently active at finding ways for mitigating the housing crisis. During the war, Lebanon experienced a high rate of monetary inflation which resulted in many serious social ramifications. The most important of these implications is probably the abolition of the middle class in Lebanon. Very few lebanese can now afford to buy new houses.
Most of the new houses built after the war were mainly luxurious ones. The major concern of housing planners nowadays is the provision of affordable housing. The capability to represent the geographical distribution of land value characteristics is very essential for supporting or testing zoning regulations that are aimed at providing affordable housing. GIS tools can play a major role in providing such capabilities.
Multivariate analysis techniques are often used to estimate land value as a function certain physical, economic, social, and political factors. The variables are quantified and a regression model is used to specify how these factors might influence land price and to test and calibrate such models using sales data. In general, such models serve as exploratory tools rather than accurate predictors of land value.
Different models employ different variables for estimating land value. These differences result from different theories and the variety of economical, social, and physical aspects of cities. Most such models relate the value of land to its accessibility to the economic activities in the city, to its amenities, to its zoning or use, to its topography, and to certain other factors that affect its use.
Land accessibility is usually related to its proximity to employment, businesses, schools, entertainment, and other urban functions. It is measured in terms of travel time or travel distance between those functions and a specific piece of land. The longer the travel time, the lower the land value.[1]
"Amenities" refer to the physical, social, and the cultural quality of the neighborhood where the land lies. Crime rates, level of crowding, type of people living in the area, and level of education and income in the neighborhood are some of the factors that are commonly used. Aesthetic amenities that include panoramic views, bad odors, and noise level may also have some
influence on land value.[2]
Land use and its regulations, in general, play a major role in determining land value. Factors that are set by zoning regulations such as, density, floor area ratio, size of parcel, and level of government services are major determinants in land value.
Topography means the physical characteristics of a land itself that affect its desirability for residential use. Land slope, geology of the soil, and the nature of the terrain are the major topographic factors that might affect land value. Steep slopes and poor underground support usually drive down the value of land.
The predictive power of multivariate models is usually limited by the lack of capability to quantify many of the variables thought to influence land value and the lack of desired data. Nevertheless such techniques usually provide useful starting point for land value assessment and provide some explanations for the dynamics of land pricing in an area.[3]
The lack of data that usually hinders the use of multivariate models is more pronounced in developing countries such as Lebanon. The more than 15 years of war in Lebanon brought to a halt most of the governmental functions. Data needed for building multivariate land value models in the BMA have become very scarce as a result. Nevertheless, it has been possible to develop a 'suitability analysis' tool that can integrate several different factors that influence land value in Beirut and enable testing 'what if' scenarios.
The GIS team at the American University of Beirut conducted a set of interviews to develop a theory about the factors that affect land value in Lebanon. The team interviewed real estate agents and experts to understand which elements clients usually look for when buying a piece of land. The team also conducted site visits to certify the validity of the factors that the real estate agents described and to investigate other factors that might help in better shaping their land value theory. The quantifiable factors that the team identified were the following:
The provision of access to economic activities makes unproductive land valuable. In the BMA, accessibility was identified as the major factor affecting land value. Land located on the sides of major roads was found to be the most expensive. Because of the mixed‑use zoning regulations in the BMA, the road level floors of residential buildings are usually converted into commercial use (shops, restaurants, etc.) while the upper floors are used as residences. Since the development of such parcels has the highest return on investment, the value of land adjacent to major roads is higher than non‑adjacent ones.
Adjacency to major roads is also desirable because of the amenities that come with it. Water, sewer, and power are usually provided by the government along major roads. The reduced cost of connecting to those networks is hence reflected on the land value.
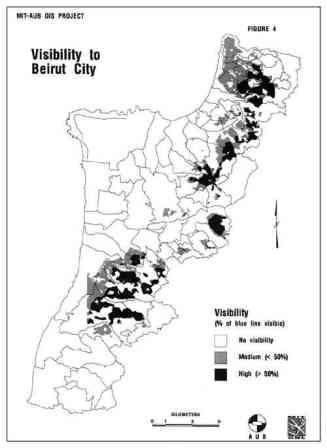
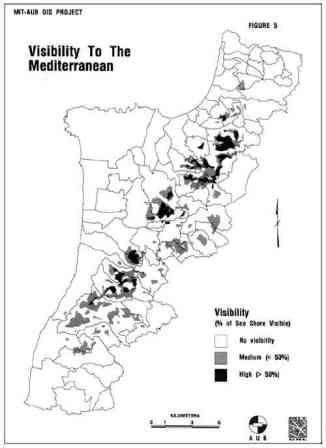
In areas that fall outside the city of Beirut, two factors, related to visibility, were identified to affect land value: (1) the view to the Mediterranean sea and (2) the view to the city of Beirut. These views can materially increase the aesthetic attributes of a residential land. In the BMA, variations in land value were observed between parcels enjoying such aesthetics and parcels that are not.[4]
Topography plays a major role in affecting the land value in the BMA. This is due to the mountainous peculiarity of the terrain in the areas outside Beirut city that limits the amount of developable land proximate to the city core. A gently rolling site may provide a more interesting and less expensive setting for a building. Very steep terrains may also cause construction problems. In the BMA, sites with slopes steeper than 15 degrees were considered less valuable than flatter ones. Sites with slope higher than 30 degrees were deemed unsuitable for construction and hence least valuable. According to the Lebanese building code, the slope limit for land that can be used for development is 50 degrees but we have used 30 degrees as the limit in our model since steeper lands are generally very expensive to use for building houses.
GIS technologies have the analytical capabilities needed for calculating the spatial distribution of many of the factors that affect land value in Lebanon. The digital elevation and 3‑dimensional terrain modeling capabilities of GIS are useful to calculate the different slopes of land and to identify areas with good panoramic views. The buffering tools of GIS are also capable of identifying sites adjacent to major roads. The use of GIS in calculating the land value indices is detailed as follows:
As mentioned earlier, due to the disruption of the government activities during the years of war in Lebanon, few data are available. The GIS team in Beirut, however, was able to procure enough data needed to calculate the above housing indices. These data consisted of road network maps as well as contour maps.
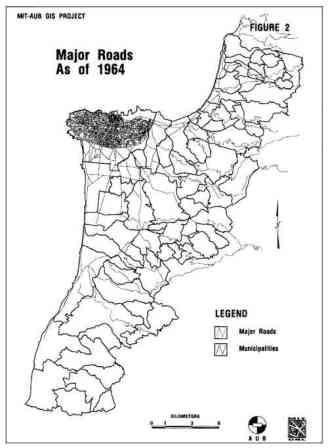
The road network maps were created in 1964. Their major defect is that they are not up‑to‑date. In spite of the fact that little construction occurred during the 15 years of war, some major roads are not included in those maps. The contour maps were also created in 1964. Contour maps do not usually change over time which makes them accurate enough for our purposes.
The following steps were adopted for calculating the factors that are thought to affect land value in BMA:
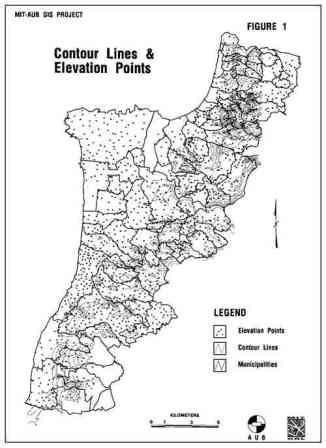
Contour maps were first scanned into graphic (TIFF) files. These images were then used to conduct the heads‑up digitization within ARC/INFO software (see Figure 1).
Major roads in the study area were also digitized into the GIS. The digitization was conducted using AutoCAD software and then converted into ARC/INFO GIS files (see Figure 2).
GIS software have the capability of creating a DEM from the contour lines and elevation points. ARC/INFO's TIN module was used to generate the DEM that will be used to calculate most of the land value indices.
The slope is automatically calculated by the GIS software when the DEM is developed. We grouped the slopes into 3 classes: less than 15, between 15 and 30, and larger than 30. A polygon file representing these groups is then generated (see Figure 3).
The use of 3-D terrain models is not limited to visualization and graphical representations only. The GIS was used to perform visibility analyses on a lattice by determining which regions can see certain observation points. The TIN model is converted into a GRID model in order to compute the visibility to the sea and to the city factors. Cells that can be seen by more than 50% of the observation points were labeled with high visibility. Medium visibility was used to designate cells that can be seen by 25 to 50% of the observation points (see Figures 4 and 5).
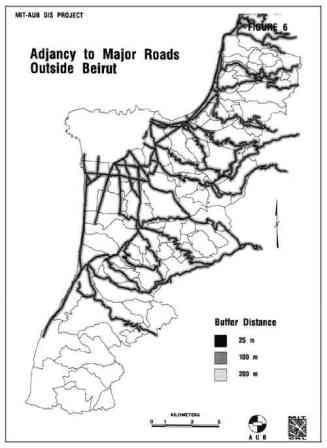
The buffering capabilities of GIS was used to determine sites that are within a certain distance from a major road. Three sets of buffers were used to identify land abutting the roads (25 meters), within 100 meters, and within 200 meters from major roads (see Figure 6).
By intersecting the slope polygons, with the visibility polygons (to sea and to Beirut), and with the 3 sets of buffers a new set of polygons is created. These new polygons have the attributes of all the above layers attached to them. This allows the querying of these

polygons to check which ones meet which set of criteria and to create a land value indexing scheme.
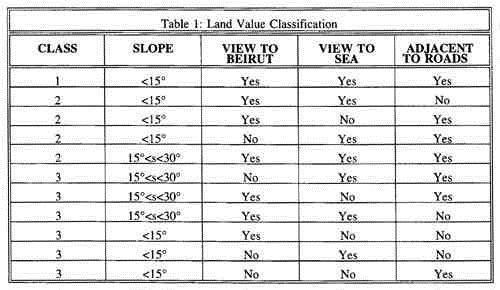
There are four factors that need to be considered while evaluating land value: (1) slope, (2) view to sea, (3) view to Beirut, and (4) distance from major roads. The AUB team could not identify which of these factors affects the most land value and which affects it the least. We have assumed that all factors are equally important. We are aware that such an assumption might not always be true, especially since different land uses value each of these factors in different ways.[5] Furthermore some of these factors might conflict with each other. For instance, the visibility and the slope steepness are in general highly inter‑related. Lands with good visibility, in general, are those that have steep slopes (except for plateaux that are elevated and comparatively level). Nevertheless, for the purpose of building a tool that is capable of representing differences in land value the following three classes of land are created:
Class 1: It includes all sites that meet all 4 criteria, i.e., those sites that have a slope less than 15, high visibility to Beirut, high visibility to the sea, and are within 200 meters from major roads simultaneously.
Class 2: It is comprised of all sites that meet any 3 of the 4 slope, visibility and adjacency requirements.
Class 3: It includes all sites that meet any 2 of the 4 requirements.
These classes are summarized in Table 1
Based on this classification, out of the 144 km' of land in our study area, only 0.6% are classified as prime land, 5.6% as class 2, and 8.4% as class 3 land. The 0.87 km^2 of prime land are divided into 98 polygons with polygon size averaging around 9,000 m^2. Obviously, these lands are not sufficient to meet the demand for prime land in the BMA. Providing infrastructure (roads) to class 2 lands that are only lacking roads would ensure an increase of more than 1.5 km^2 of prime land.
On the other hand, more than 122 km^2 of land (85%) did not meet any of the criteria of the model. Building major roads in these areas would make available lands for building affordable housing in the BMA.
In this project, we have also procured a set of SPOT satellite images for conducting a time‑series analysis of the urban growth in the BMA. These images were also imported into the GIS and used as the background for displaying the results of the land value model. Figure 7 shows the three classes of land overlayed on top of the satellite image. This serves as a tool for comparing the results to the judgments of the Beirut planners about current market conditions.
The intersection of the many layers of data creates a set of polygons that are not related to any physical boundary. In other words, the geometric units that are created are independent from parcel boundaries or from any other legislative boundary. The results of this model can be more useful if data at the parcel level was available. Once the parcel boundaries become available these results can be overlayed on top of them to obtain which parcel belongs to which class.
The size of TIN polygons is also critical in accurately representing the shape of the terrain and computing the slope of each polygon. Figure 1 shows the density of the elevation points and contour lines that were used to generate the TIN model. This density has a great influence on the TIN polygons size which certainly affects the accuracy of the results. If the spacing between elevation points is too big, the size of the TIN polygons would also be big and the slopes assigned to these polygons might not be very accurate or do not properly represent the terrain. For example, in our model, the average size for TIN polygons of slope between 0 degrees and 15 degrees is around 22,800 m^2, between 15 degrees and 30 degrees is 6,000 m^2, and greater than 30 degrees is 3,700 m^2. This is due to the fact that in flat areas elevation points are more far apart than in steep areas. On the average, the sizes of the TIN polygons in our model are small enough to make the accuracy of the model quite acceptable.
Suitability analysis tools are usually utilized for sitting facilities or locating lands that meet specific characteristics. The distinguishing characteristic of the tool we are building lies in its capability to calculate the spatial distribution of land value and to visualize the different factors that influence the variations in land value. It also allows the exploration and assessment of the impact of different actions, such as changing zoning regulations and land use or building new development infrastructure, on land value.
The only "changeable" factor that affects land value in this model is accessibility. Since practically nothing can be done to alter visibility or land slope, this tool allows planners to test 'what if scenarios related to accessibility only. Building new roads in areas that enjoy good visibility and mild slopes is one such scenario. This model can be used to identify those areas and assess the value and impact of providing adequate accessibility (by building new roads) to those lands.
Different land uses value different factors of the model in different ways. In this model all factors are assumed to have equal importance or weight. Accessibility, slope, and visibility are all assumed to influence land value equally. In reality, factors are valued differently for different land uses. For residential land use, the aesthetic (visibility in this model) and accessibility factors are probably more valued than the slope factor. Architects often take advantage of steep terrains to create original designs, especially when designing luxurious houses. On the other hand, when affordable housing are more of concern, probably the visibility factors become of less importance.
The value of this tool lies in its capability to show the spatial distribution of land with different characteristics. It can be used by planners to evaluate existing zoning and land use restrictions. For example, in the BMA land use varies from residential, mixed, to industrial use. By overlaying the current land use on top of the land value index map, a planner can visually assess the adequacy of existing land use. Industrial zoning in areas characterized by high land value index or low accessibility would be, for instance, very inappropriate. By combining the zoning map that contains attributes such as floor to area ratio (FAR) with the slope distribution map, the analyst can check the consistency or irregularity between the zoning regulations and nature of the terrain.
Another use of the model that can be of value to planners is its capability to calculate factors such as slope of roads. The current accessibility measure used in this model is a very simple one. Adjacency to roads is a measure of accessibility to existing infrastructure facilities, such as power line, water pipes, and sewer lines, rather than proximity to urban activities. Travel cost between different areas and the city centers is a measure that takes more into account proximity to employment, businesses, and entertainment. In the BMA, because of the mountainous nature of the terrain, slope of roads may also play a role in affecting accessibility. Travel distance in flat areas may not be valued equally as the distance in hilly areas. Slope of roads used for travel may well influence travel cost.
The 3‑D terrain model that is used by this model can also be used to calculate the slope of roads. The TIN model calculates for each polygon it creates its slope and its aspect. The slope of a surface refers to the maximum rate of change in the elevation across that surface, whereas the aspect refers to the direction of maximum rate of change in elevation along that surface. By intersecting the road file with the TIN polygons, slopes of roads can be calculated as follows:
(Slope of Road) = (Slope of TIN) * Cos [theta]
where [theta] is the angle between the TIN aspect and the road.
The accuracy of the road slope depends to great extent on the size of the TIN polygon and on the shape of the road. It is assumed that the road segments that fall within any TIN polygon are almost straight.
Finally, the real value of this model lies in its capability to give some real quantifications to the effect of some of the what if policies. It allows, for example, the measurement of the effect of constructing new roads on the availability of prime lands and gives an idea about the maximum prime land availability. Planners in the BMA can make use of this tool to prioritize the construction of new roads in order to meet the different demands for lands of different land values and different use.
Grateful acknowledgements are extended to George Yared, and Yousef Nizam from AUB, and to Carlos Quintero from MIT for their work and valuable contributions to this project.