Abstract
Contents
- Introduction
- 1. Theme urgency
- 2. The purpose and objectives of the study, expected results
- 3. Review of Research and Development
- 4. Methods of technical analysis
- 4.1 Graphical method
- 4.2 Moving Averages
- 4.3 Oscillator
- Conclusion
- References
Introduction
Financial market - the structure, allowing market participants to carry out the purchase and sale of various financial assets such as exchange rates, securities, commodities, derivatives (derivatives), etc. This is a market where product is a financial asset. The unpredictability of the financial market, unexpected price hikes and unclear trends and sudden fall, as the economy experienced severe crises. Accordingly, the one who has the best methods of extracting regularities from noisy, financial market data - the least affected by such crises in the economy and, consequently, can hope for a big profit.
The financial market is a time series of data and that should be investigated and defined therein laws. Powerful and effective tool for research and study of the financial markets are mathematical methods and models. Because in today's world financial data can have large volumes, that person would have a long time to process the data by these methods. According to this data, and the methods used to create the model systems to analyze the financial market, to automate the process and on the basis of the analysis of the resulting person will make financial decisions.
1. Theme urgency
We know two basic methods of analysis of financial markets: fundamental and technical analysis. Fundamental analysis is assessing the situation in terms of political, economic, financial and credit policy. Information about the discount rates of the central banks, the economic policy of the Government, possible changes in the political life of the country, as well as all kinds of rumors and expectations are the most important in fundamental analysis. Thus, the success of the trader in conducting fundamental analysis depends on the understanding of the laws of financial markets, the ability to compare each other completely unrelated at first sight events. Technical analysis - a method of predicting price by considering the timing of operation of the market for the preceding periods.
Master's thesis is devoted to the actual development of systems analysis and forecasting indicators of the financial market: prices, trading volume, open interest. For the development of such systems is most appropriate to use technical analysis because it has a mathematical model, which in turn can be put on a programming language and to automate the analysis of the financial market.
2. The purpose and objectives of the study, expected results
The aim of this study is to develop an algorithm for the analysis of the financial market forecasting financial performance
The main objectives of the study:
- Analysis of the methods of investigation financial performance on the market
- The study of financial indicators and classification
- Research-parallel computing capabilities in financial calculations
The object of study : the method of analysis and forecast of the financial market
Subject of research : the study of technical analysis methods for the implementation of financial market analysis algorithm
As part of the master's work is to get the actual scientific results in the following areas:
- An analysis of the dynamics of changes in exchange rates
- Classification currency based on their correlation
- Optimization of the distribution of foreign currency resources to work on the currency market
For experimental evaluation of the theoretical results and the formation of the foundation of further research, as the practical results of plans to develop cross-platform, customizable and functional system with the following properties:
- Tracking the Forex currency exchange market
- Predicting the behavior of exchange rates
- Creating an expert system for forex traders
- Solution of the optimization of the distribution of currency resources
3. Review of Research and Development
In today's financial markets play a key role in the development of states, companies, enterprises and individuals. The circle of people who are dealing with financial analysts, different from ordinary traders, analysts to global corporations and government agencies. Mankind has long been interested in the laws of the behavior of such objects virtually unpredictable as stocks, exchange rates, prices of futures and other financial instruments. There are many ways to analyze financial market indicators. This technical analysis [ 1 , 5 ], and the fundamental [ 4 ], and the theory of Elliott wave [ 5 ], as well as many lesser-known various methods.
Technical Analysis in recent years has shown that this theory with its own philosophical system and a set of axioms. In technical analysis are the following axioms [ 1 ]:
- Movement of the market considers everything. The essence of the axiom is that any factor influencing the price, economic, political, psychological, pre-considered and reflected in its schedule. Therefore, the study schedule of prices - a prerequisite for the prediction. The types of trends are presented in Figure 1.
- Prices move directionally. Axiom is characterized by the notion of the trend means determining the direction of the price movement.
- History repeats itself. This happens because of the centuries of human psychology is basically unchangeable.
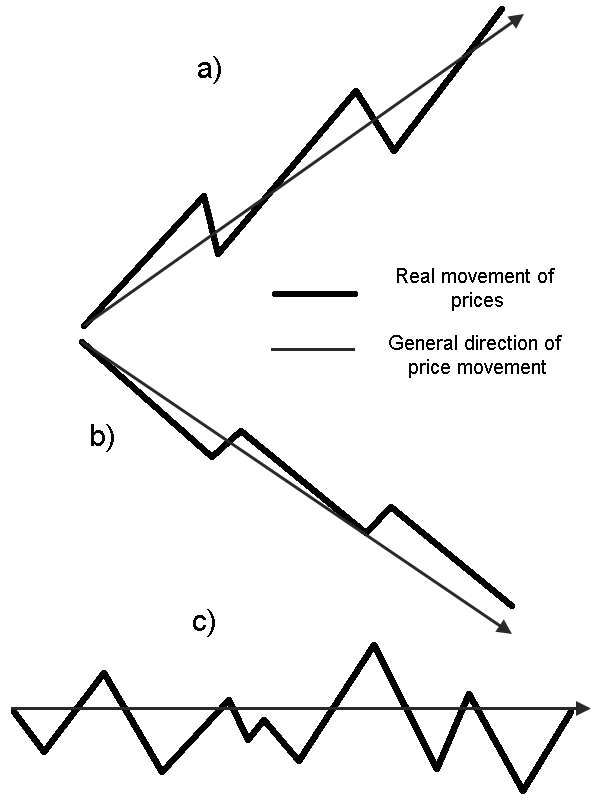
Figure 1 - types of trends: a) Bovine (Bullish) - price rise; b) Bear (Bearish) - decline in prices; c) Side (Sideways) - price is almost not moving;
Technical analysis is used in more Western specialists. This method includes a large number of forecasting methods, on the western experts define the following classification [ 1 , 5 ]:
- Graphical methods. Methods that are used to predict the visual image of the market.
- Methods using filtration or mathematical approximation.
- Methods of the theory of cycles. Engaged in the analysis of cyclical fluctuations not only prices, but also of natural phenomena in general.
There are also mixed techniques that carry the traits of several groups. For example, the Elliott wave theory - basically a graphical method, but has the features of filtration and cycling. Thus, most of the methods of technical analysis outlined above fit into the classification
On the basis of the technical analysis conducted research and development, using various data mining algorithms.
The processing [ 2 , 6 ] proposed the use of the method of R / S analysis described by Harold Hurst, for analysis of financial series. This method is time-series analysis to determine whether a time series of random or persistent, i.e. having a long-term memory. This algorithm works well for input data cleared from disturbances. However, when added to the system disturbances and abnormalities that may occur, for example, as a result of the impact of the major market players in speculative trading, the algorithm produces a large error.
In [ 8 ] on the basis of neural networks is carried out to study the problem of forecasting the dynamics of prices in the stock market, implemented an automated system that allows you to simulate network settings. Also, in [ 9 ] describes the use of neural networks for the prediction of financial time series.
Also, for the prediction and research of time series considered the idea of using Markov chains [ 10 ], which offers a probabilistic model due Hidden Markov process with explicit values ??of variables observed above Markov processes. We propose algorithms for estimating the parameters of Markov process (transition probabilities, the probability of an initial state of the system) and communication parameters of explicit and hidden states.
4. Methods of technical analysis
The analysis and forecasting of trends in the movement of financial market instruments of uncertainties and challenges. Fundamental analysis makes it possible to overcome them systemic way. The basis of the fundamental approach is to consider the substance of the processes occurring in the market, identify their causes and relationships.
This approach opposed to those who did not consider it necessary to take into account economic development. They see only consider the situation at the aggregate market shares of melon, and with the practical side. Therefore, such an analytical method is called technical analysis. Technical analysis is based on the assumption that the market has a memory, and the future dvidzhenie rate is greatly influenced by his past behavior patterns; thereby wounds has a certain degree of predictability.
The main objective of traders on any exchange is to identify trends in price movement (trend) and predict the time of its reversal. Buying financial instrument height and selling when prices fall, profits trades.
In recent years, due to the rapid development of electronic analysis tools offered by Reuters, Bridge (Dow Jonse), CQG et al., A growing number of traders base warriors decision on the use of technical analysis, which increases the effect of his laws of motion on the real course.
4.1 Graphical method
The initial information for the technical analysis are the price of each transaction, and the time it was committed. Because of the large number of transactions their analysis difficult. Therefore, the data grupiruyutsya, processed and presented in the form of graphs for further analysis. Data are grouped for certain periods of time: weeks, days, hours. Grouped information comprising for each interval: price of the first transaction (the opening price - open); the price of the last transaction (closing price - close); maximum (high) and the minimum (low) price and number of transactions (volume - volume). For daily charts starting price - the price of the first trade at the opening of the Tokyo Stock Exchange (3 hrs., Moscow time). Closing price - the price of the last trade on the New York Stock Exchange (23 hr., Moscow time).
In the graphical display of prices used different types of graphs:
- Tic-Tac-Toe (point and figure charts);
- line graphs (line chart);
- Histogram (bar charts are also used or bar chart, or simply
chart
- bar charts); - Candlestick (japanese candlesticks).
View candlestick and their schedule is presented figures 2 and 3.
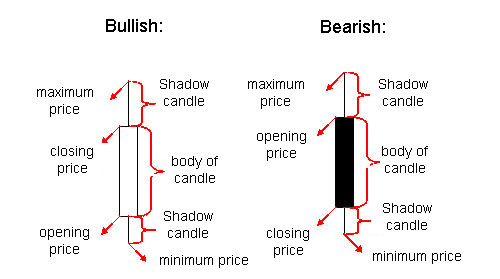
Figure 2 - Candlesticks;
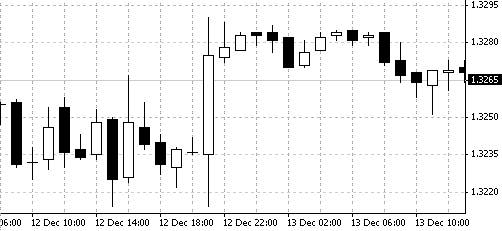
Figure 3 - candlestick charts;
By charting the trader determines the price trend. Price trend - this trend, the trend of price movements. Predict the direction of price movement and the moment of their reversal is a major task that will ensure a profitable trade. To solve this problem it is necessary to determine the levels of the chart, and support and resistance lines, as well as various figures, indicating a possible reversal or a continuation of the trend.
The trend may be rising ( bullish
, bullish
), downward ( bearish
, bearish
) and the side
as shown in Figure 1. Along the trend is always possible to draw two lines, limiting price fluctuations within the trend of the top and bottom. The lines are called the top level and resistance lines, and they are not allowed prices to rise. The lines below are the levels and lines of support they would like to support prices and prevent price will fall down. In the case of a pronounced upward or downward trend of the line, usually arranged almost in parallel. The line on the right, called a trend line and to the left - channel line. Lateral trend lines can be parallel and disposed at an angle to each other.
In the graphical method of approximate prices to levels (lines) support (resistance) prevents the trader the possibility of a reversal of price movements.
To predict the reversal or continuation of the trend trader carries on the graph line passing through the maximum and minimum prices. In combination, these lines resemble certain figure. Some of the figures are presented in Figure 4.
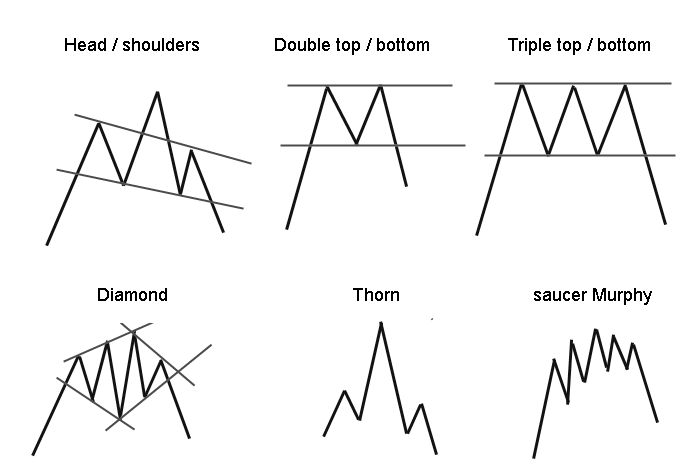
Figure 4 - The figures of a trend reversal;
The most significant reversal pattern in technical analysis is the double top or a figure head and shoulders
. Similar meaning are mirror images of these figures - double bottoms and inverted head and shoulders
.
The meaning of the double top is that after the trend prices fluctuate in a corridor, limited support and resistance levels. After breaking through the support at the previous downtrend (or resistance at the previous downtrend) is likely reversal.
Head and shoulders of
a bull trend and inverted head and shoulders
on the bearish trend are the most significant figures, signals a possible trend reversal. The signal for the transaction is to break through the neckline, which is a line of support for the
head and shoulders
.
4.2 Moving Averages
In view of the fact that the movement of prices is subject to fluctuations, to obtain clearer information on the availability of trend data smoothing is performed. After smoothing, the trend can be traced more clearly. Therefore, a simple moving average MA is like a trend indicator. The simplest method is a method of smoothing the simple moving average. The movement of the moving average is shown in Figure 5.
The main parameter of this method is the dimension of the window - N previous data including the current specified in days, hours, minutes, depending on what data are analyzed, with the day, hour or minute. To calculate the AI ??used the closing prices because they are more informative. The value of MA is calculated as the arithmetic average price for the previous N data, including current:
where Ci - the closing price of the i-th day (hour, minute).
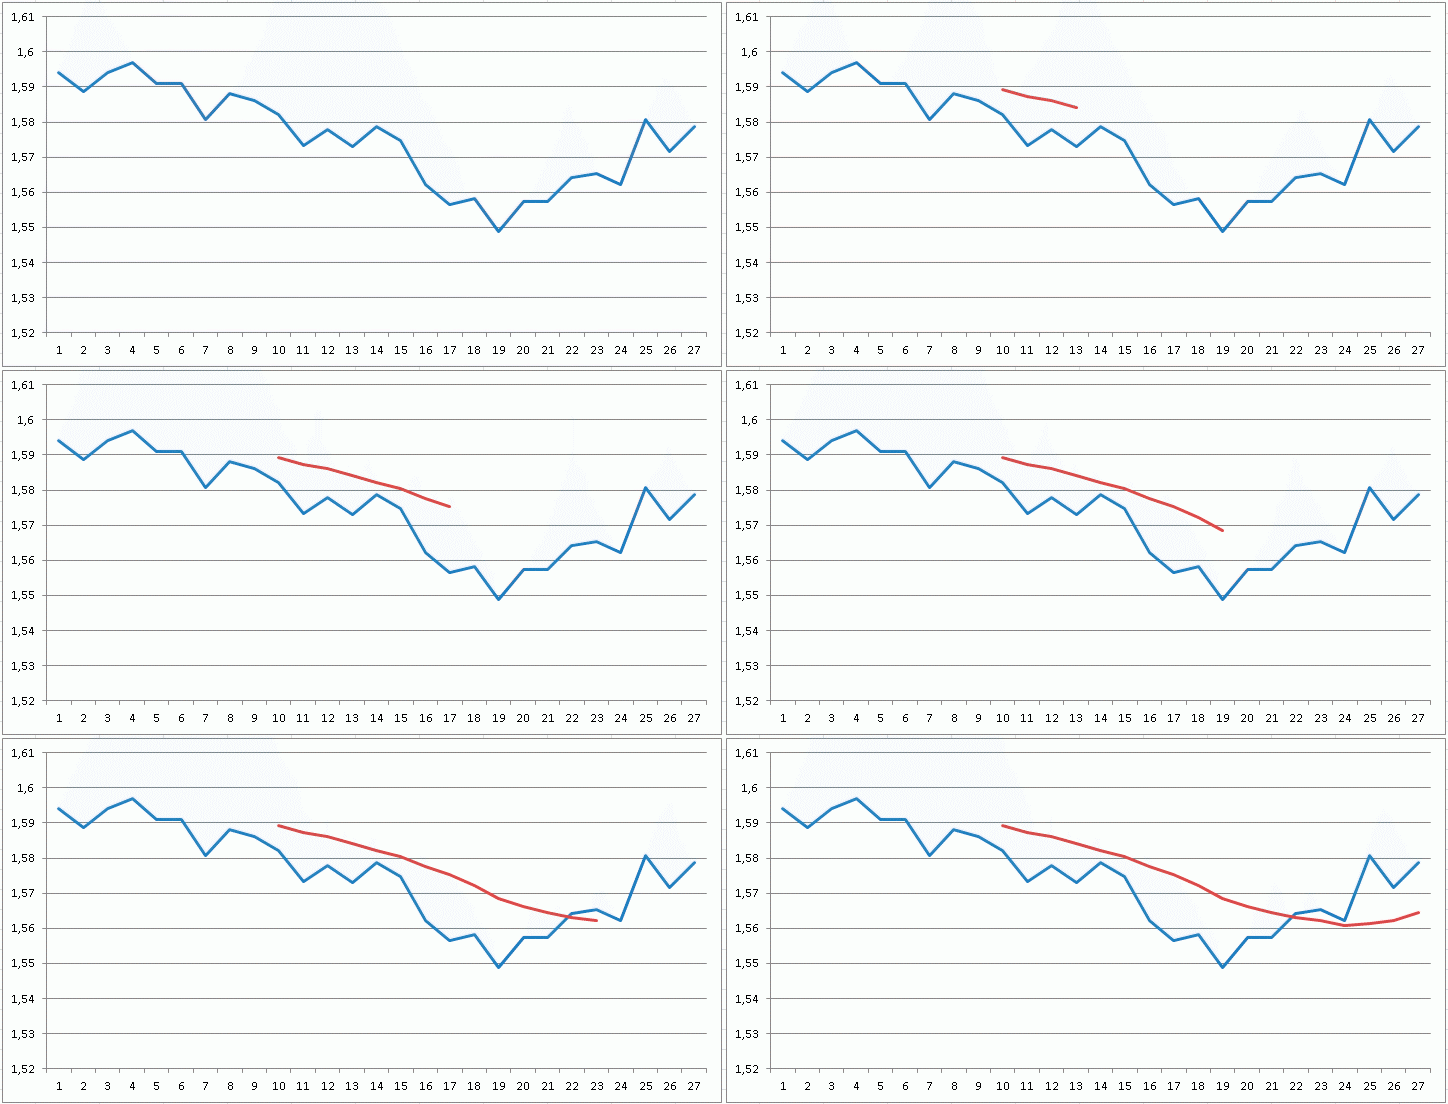
Figure 5 - A moving average with a window of 10 days;
(animation: 10 frames, 10 of repeat cycles, size - 724x368, 84 KB)
When using a combination of several different intervals MA smoothing MA with great intkrvalom serves to identify trends and MA at shorter intervals - to identify the date of the transaction. The signal arises in the case where the short-period MA MA intersects with a longer period. By using three different MA periods the strongest signal occurs after crossing all three AI.
The method is based on moving averages work well only under explicit trend. If sideways false signals too high, which inevitably leads to losses.
4.3 Oscillators
A good indicator of predicting price movements, along with moving averages are oscillators. They are most effective in a sideways trend. The feed of signals to buy and sell less lag behind price changes, and sometimes ahead of them. In addition, too, in the period of developed trend oscillators able to predict its reversal. Oscillators indicate a deviation from the equilibrium level. Being close to the extreme values ??of the oscillator (overbought or oversold) indicate that the market potential for moving up or down is already exhausted.
Here are the main oscillators:
- Torque (momentum - MOM). The moment is calculated as the difference of the final price of the day and the price n days ago.
This is similar to the prices of the consumer basket compared sogodnya with the one that was, for example, a month ago. Positive values ??indicate that the IOM relative rise in prices, negative - a decrease.MOMt = Ct - Ct-n(4.2)
- The rate of price changes (Rate of Change - ROC). This is similar to the IOM indicator, which is calculated as the ratio of the final price of the day to the price n days ago, expressed as a percentage.
Thus, ROC is a reflection of the rate of change of the price, and also indicates the direction of the change.ROCt = Ct / Ct-n * 100%(4.3)
- RSI (Relative Strength Index - RSI). It is the most significant oscillator with technical analysis. RSI value will vary from 0 to 100. This indicator may ring or simultaneously with a turn in prices, or ahead of, which is its major advantage. For its calculation formula is used:
where the AU - the amount of growth in the final price of n days; AD - the amount of the decrease in prices for the end-n days.RSI = 100 - 100 / (1 + AU / AD)(4.4)
oversold indicator located at values ??below 25-20, and overbought - above 75-80. RSI reversal signal is in these areas and out of her. - Stochastic line (Stochastics). If MOM, ROC, RSI only used the closing price, the stochastic lines are constructed using more information. When they are used as calculating the maximum and minimum prices.
Conclusion
Experiments show that 90% of new traders lose their capital. In order to reduce the risks in the financial market, it is necessary to constantly evaluate the financial performance of the market. When analyzing the data should not be used by only one method of analysis of the financial market. Therefore, the relevance of the development of systems analysis and forecasting, is still relevant.
Master's thesis is devoted to the actual development of systems analysis and forecasting of financial market indicators. As part of the research carried out:
- Analysis of articles and literature on the methods of analysis of the financial market.
- Based on the analysis of literature sources identified the main techniques for analyzing and forecasting financial market indicators.
- In the analysis methods identified their main characteristics, strengths and weaknesses.
Further research will be devoted to the subject area selection, development and adaptation of the considered mathematical models of their software implementation and testing.
Note
In writing this essay master's work is not yet complete. Final completion: December 2015. The full text of work and materials on the topic can be obtained from the author or his manager after that date.
References
- Эрлих А. А. Технический анализ товарных и финансовых рынков. / А. А. Эрлих // Прикладное пособие. - М.: ИНФРА-М, 1996. 176 с.
- Гачков А. А. Рандомизированный алгоритм R/S-анализа финансовых рядов / А. А. Гачков // Стохастическая оптимизация в информатике. Вып. 5 / Под ред. О. Н. Граничина - СПб.: Издательство С.-Петербургского университета,
- Малыхин В. И. Финансовоая математика: Учебное пособие для вузов. / В. И. Малыхин. - 2-е издание. - М.: ЮНИТИ-ДАНА, 2003. - 237 с.
- Кияница А. С. Функдаментальный анализ винансовых рынков. - СПб.: Питер, 2005. - 288 с.
- Финансовая математика: Математическое моделирование финансовых операций: Учеб. пособие/под редакцией В.А. Половникова и А.И. Пилипенко. - М.:Вузовский учебник, 2007. - 360 с.
- Зиненко А. В. R/S анаилз на фондовом рынке / к.т.н. А. В. Зиненко // Математические модели социальных и экономических сиестем. - Бизнес-информатика №3(21), 2012. - С.24-30.
- Прудский М.В. Фрактальный анализ финансовых рынков // Информационные системы и математические методы в экономике. – 2012. – № 5;
- Мицель А.А., Ефремова Е.А. Прогнозирование динамики цен на фондовом рынке // Известия ТПУ . 2006. №8. Режим доступа: http://cyberleninka.ru/article/n/prognozirovanie-dinamiki-tsen-na-fondovom-rynke (дата обращения: 16.05.2015).
- Азат Арсланов. Прогнозирование финансовых временных рядов // [Электронный реcурс]. Режим доступа: http://geektimes.ru/post/144405/
- Rabiner L.R. A tutorial on hidden markov models and selected applications in speech recognition / L.R. Rabiner // In Proceedings of IEEE. – 1989. – Vol. 77. – P. 257–286.
