Surface Construction Analysis using Marching Cubes

Burak Erem

Nicolas Dedual

Northeastern University

Northeastern University

erem.b@neu.edu

ndedual@ece.neu.edu

Abstract

This paper presents an analysis of the algorithms used for generating 3D structures from 2D CT-Scan Datasets. This is achieved by developing an implementation of Marching Cubes, a surface construction algorithm that’s currently the standard used for 3D surface construction in the medical visualization industry.

1. Introduction

X-ray Computed Tomography (CT) is a medical imaging technology used by doctors to diagnose areas of interest within the body non-invasively. CT-Scans of patients are generated by having an X-ray source that rotates around a patient; X-ray sensors are positioned on the opposite side of the circle from the X-ray source. Many data scans are progressively taken as the object is gradually passed through the gantry. They are combined together by the mathematical procedure known as tomographic reconstruction [9, 10, 11], which generates two-dimensional (2D) images that doctors use when diagnosing patients.

Yet 2D images cannot accurately convey the complexities of human anatomy. Interpretation of 2D complex anatomy requires special training and though radiologists are trained to interpret these images, they often find themselves having to communicate their interpretations to a physician, who may have difficulty imagining the three-dimensional (3D) anatomy [3]. However, this same anatomy can be visualized as a 3D image, allowing doctors to properly see the volume and shape of features that they may be interested in analyzing, such as the brachial tree, a particular tumor or other features of interest [3].

2. CT-Scan acquisition considerations for

3D visualization

In order for any 3D surface construction algorithm to properly work, it is important to address the special considerations required of the set of slices for the algorithm to work. Of the different concerns that are normally under consideration for X-Ray CT – fan- beam reconstruction, spiral/helical CT, multi-slice spiral CT – very few directly affect the nature of the 3D structures that are produced. As long as the 2D slices have the same resolution, spatial orientation, and are stored sequentially, then the 3D visualization should generate an accurate representation.

It is important for each image to have the same resolution because the algorithm assumes that corresponding pixels in each slice will correspond to the next pixel value in that same physical direction. Similarly, if the spatial orientation of the images is different (rotated, flipped, etc.) then corresponding pixels in different slices will not generate an accurate visualization. If the order of the slices does not accurately represent the continuous space in which the dataset was captured, the visualized structure will be inaccurate. For example, if the first half of a set of slices taken of the head and torso was mistakenly placed behind the second half, the structure would appear to have the head attached to the bottom of the torso. However, as long as these conditions are met, any algorithm used will produce structures that accurately represent the imaged space.

3. Rendering 3D Surfaces

Currently, there are two general models used for rendering 3D images. These are: cross-section rendering and threshold rendering. Each of these techniques model the interaction of x-rays within the volumetric rendering [8]. In cross-section rendering, the volumetric reconstruction is considered opaque. The user then chooses which areas to render by adding new light sources within the 3D environment and illuminating the cross-sectional slices [8]. In threshold rendering, the user determines what to render by selecting a range of density value, and discarding all values that fall outside the desired range. Because it is able to generate a 3D view of the desired density’s surface, threshold rendering is the standard rendering model used in the medical industry.

There are also different methods of obtaining 3D visualization from a set of 2D slices. One of the earliest techniques extracted the contours of each surface, and from these contours generated several triangles that connect each slice together. While effective, this technique fails when certain ambiguities, like multiple contours in each slice, are present. Other 3D generation techniques include: ray casting through a surface and rendering the hue lightness to display the volume [6], rendering the density volume rather than the surface [7], and others. However, these techniques discard useful information that is crucial to render a 3D surface well.

4. Marching Cubes Algorithm

The current standard algorithm for 3D surface construction is the Marching Cubes algorithm, developed by General Electric in 1986 as an alternative to contemporary methods of 3D surface construction. The algorithm implements threshold rendering in order to generate “triangle models of constant density surfaces from 3D medical data” [4]. In our research, we were unable to determine whether CT-Scanners such as the GE LightSpeed Plus implement this algorithm, due to the lack of disclosure on behalf of GE. However, we can infer that GE implements the Marching Cubes algorithm, as they are the recipient of the software patent of the same algorithm [2].

A similar technique known as “Marching Tetrahedrons” was develop to circumvent the patent, and has been implemented throughout the medical visualization industry. Because the patent over

Marching Cubes has expired, one can expect the technique to be used more prominently in industry.

4.1. One Cube

At the basic level, the Marching Cubes algorithm takes eight scalar values from two adjacent slices of our dataset to form the vertices of an imaginary cube. After establishing our imaginary cube, we compare the value of a single vertex of our imaginary cube against some desired value, also known as an isovalue. If the value of the vertex is less than or equal to our isovalue, we can then say it falls within (or on) the surface. Otherwise, it falls outside the surface. We repeat this operation with the other 7 vertices to determine which points are inside or outside the surface we want to render. Once we determine which parts of the cube fall within the desired surface, we then create a topology of the surface within the cube [4].

Because there are eight vertices per cube and only two logical states (inside or outside) per vertex, there are 256 ways a surface can intersect a single cube. While triangulating the 256 possibilities for each imaginary cube is feasible, this is not recommended because triangulating the 256 possibilities tends to be tedious and error-prone [4]. For example, the topology of a triangulated surface remains the same when the relationships of the surface values are inverted [4]. This reduces the number of possible cases from 256 to 128. Also, because there’s rotational symmetry within some of the 128 cases, we can reduce the number of analyzed cases from 128 to 14, and rotate the appropriate case when necessary. Figure 1 illustrates the 14 possible configurations in which a surface can intersect a cube. Each black dot at a cube’s vertex represents the position in which a surface intersects with the cube, and within the cube the corresponding surface is generated. Figure 1 also highlights the simplicity of the Marching Cubes algorithm. By just analyzing 8 vertex values, we can generate a precise surface that can be expressed as a combination of 5 or less triangles.

Figure 1: Triangulated Cubes

4.2. Multiple Cubes

When applying the algorithm to multiple cubes, the same approach is taken for each individual cube as described in the previous section. Looping through the cube space, one cube at a time, triangles are calculated for each. However, it is important to note that the relationship between cubes is that every cube shares 4 vertices with each cube adjacent to it [4]. This can be seen in Figure 2 where the vertices 0, 1, 2, and 3 touch both cubes.

Figure 2: Adjacent marching cubes with connected isosurface

In this way, cubes are connected to each other because their vertices are overlapped. This ensures that calculating one cube at a time will result in the creation of the same surface regardless of the order in which cubes are traversed. In Figure 2, this concept can be seen taking shape as the two surfaces in each cube are connected at their shared face.

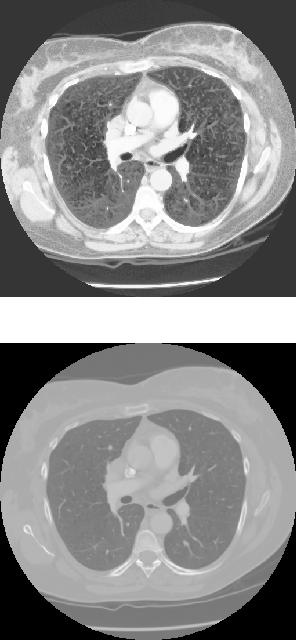
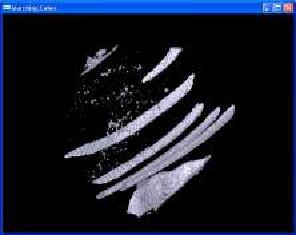
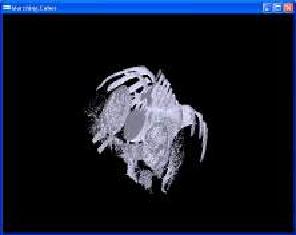
In order to view different structures within slices, one changes the isovalue parameter of the algorithm. This effectively tells the algorithm to create polygons out of a different range of pixel values. For example, if a tumor clearly appears in slices with sharp contrast between itself and normal tissue, one can visualize the tumor by changing the range of isovalues to match the gray levels of the tumor. Or if it is important to view a broken rib, one can set the isovalues to that specific range. Therefore changing the isovalue allows whoever is analyzing the data to choose which structure they want to see.

5. Implementation

Our implementation of Marching Cubes takes in slices as uncompressed 8-bit Windows bitmap files and produces a 3D visualization of a cropped region in space. The fact that it is cropped needs to be emphasized because of restrictions on memory usage. If the space that the program is attempting to visualize is too large, the program does not run successfully. Furthermore, the purpose of this project was not to learn to process DICOM files and therefore we deferred that conversion task to Matlab. The rest of the implementation is written in C++ using OpenGL for graphics and GLUT (OpenGL Utility Toolkit) for window management and user interface.

5.1. DICOM to Bitmap Converter

Matlab has functions to read DICOM files included in the Image Processing Toolbox. We created a script that reads in a folder full of DICOM files, converts them to intensity images, performs histogram equalization, and outputs 8-bit bitmap BMP files. Figures 3 and 4 show some of the 2D CT-Scan slices that we used in our program. Figure 3 represents an image that has been processed with histogram equalization, while Figure 4 shows the same slice without histogram equalization. We can see that Figure 3 shows the bone structure of the patient with greater contrast than Figure 4.

Figure 3: Bitmap generated of DICOM Slice after Histogram Equalization

Figure 4: Bitmap generated of DICOM Slice before Histogram Equalization

5.2 Lookup Table

To speed up the Marching Cubes algorithm, we created an index to an array that has pre-calculated each of the 256 possible surface intersection configurations. We then assign the scalar value of each vertex a bit in an 8-bit integer. If the vertex’s value falls within the range of our isovalue, we then set the corresponding bit to 1. Otherwise the same bit is set to

0. The final value of this 8-bit integer is the corresponding surface intersection configuration.

5.3. Loading the Raster Image

We created a function called “populateRaster” to convert any image we import into a raster image. The raster image gets stored into an input variable called “data,” which is a 3-dimensional array with dimensions previously defined which match with the area of the original image that we want to import. We acquire the file name through two different variables: the first called “filename,” which is a character array that holds the name of the file, and the second called “extension,” which is a character array that holds the extension of the file. We also are able to crop from the larger dataset by determining the position along the x, y and z axes from where we begin importing. These are controlled through the startX, startY and startZ variables.

To read images, we use the CImg libraries developed by David Tschumperlé. [cimg.sourceforge.net]. CImg is an open source library that can be used for image processing and is specifically designed to import numerous file formats, including the BMP files used by our program.

5.4 Loading the Grid Space

We created a function called “populateGridSpace” that defines a 3-dimensional array of our defined type GRIDCELL. GRIDCELL is an implementation of the imaginary cube used to describe the Marching Cubes algorithm. Each GRIDCELL is made up of 8 vertices, which are shared with other GRIDCELLs in our 3- dimensional array. We then copy the values from our raster image to each corresponding vertex.

5.5 Drawing Sequence

We created a rendering function called “drawMe” that is used by OpenGL to render the 3D surface. We start by traversing our 3-dimensional array of GRIDCELLs and evaluating the 8 vertices of each GRIDCELL. We then call upon our Marching Cubes function to generate each triangle of the surface calculated and then render it appropriately through OpenGL. We also calculate the normal of each surface in order to enable Phong shading, allowing us to better discern the shape of the 3D image.

6. Results

The capabilities of our implementation were tested in a number of ways. Initially, raster data was forged to construct a cube which was then visualized by our program. After seeing this work successfully, we attempted visualization of a similar cube read from 10 100x100 bitmap files. This was also a successful experiment.

This lead to visualizing small regions from bitmaps of converted DICOM datasets. One such visualization is Figure 5, where a column crossing multiple ribs can be seen. This specific section was extracted starting from slice number 3 at pixel point (50, 300), covering a 100x80x80 volume, using an isovalue of 250 with a threshold of +/- 5.

After some memory optimization, we attempted the larger region that is seen in Figure 6. Figure 5 and Figure 6 are both of the same dataset. Figure 6 starts from slice number 3 at pixel point (57, 252), covering a 399x167x80 volume, using the same isovalue and threshold.

7. Restrictions and possible improvements

This implementation of Marching Cubes has inherent deficiencies due to the circumstances under which it was developed. However, future development can be done on this project to improve its performance and usability.

A big problem with the most basic implementation is that it is terribly inefficient with memory use. In fact, if compiled in versions of Visual Studio earlier than

.NET, the build process warns that the executable may not execute properly because of it. Because this was written as a proof of concept, algorithm efficiency and memory management were not high priorities. Despite this, attempts were made to optimize performance. These attempts consisted of eliminating rendering of triangles consisting of only zero-valued vertices, storing only triangles and normals in memory, and dynamically allocating temporary data arrays during initialization so that memory can be freed before any rendering begins. It would be best to modify this implementation further to improve memory usage, especially eliminating storage of triangles with only zero-valued vertices.

Another area for improvement is the usability of this visualization tool. Currently, a user can only view one

object at a time. Ideally, users would be able to select multiple objects to view concurrently. This improvement would be implemented by storing multiple structures obtained from multiple isovalues. Different objects would have different colors and would be easily identifiable in the visualization.

8. Conclusion

Visualization of medical data in 3D is a valuable tool that will assist physicians in diagnosing and treating patients with greater confidence. By using algorithms such as Marching Cubes, such visualizations can be generated with relative ease. Improvements in the graphical capabilities of computers and the optimizations of existing implementations of this algorithm will increase the visibility of such visualizations in regular medical practice.

9. Figures

Figure 5: Cropped section of ribs

Figure 6: Large section of ribs and spine

10. References

[1]Bourke, P. “Polygonizing a Scalar Field”, May 1994, http:// astronomy.swin.edu.au/~pbourke/modelling/polygonise/

[2]Cline, H., Lorensen, W., System and Method for the Display of Surface Structures Contained Within the Interior

Region of a Solid Body, US Patent 4,710,876, to General Electric Corp., Patent and Trademark Office, 1985

[3]Dedual, N., Kaeli, D., Johnson, B., Chen, G., Wolfgang, J., “Visualization of 4D Computed Tomography Datasets”,

Proc. 2006 IEEE Southwest Symposium of Image Analysis and Interpretation, March 2006

[4]Lorensen, W., Cline, H. “Marching Cubes: A High Resolution 3D Surface Construction Algorithm”, ACM

Computer Graphics Volume 21, Number 4, July 1987

[5]Johnson, C., Parker, S., Hansen, C., Kindlmann, G., and Livnat, Y. “Interactive Simulation and Visualization” Center for Scientific Computing and Imaging, University of Utah. http://www.cs.utah.edu/sci

[6]Keppel, E. “Approximating Complex Surfaces by Triangulation of Contour Lines” IBM J. Res. Develop 19, 1 (January 1975), p. 2-1

[7]Robb, R. A., Hoffman, E. A., Sinak, L. J., Harris, L. D., and Ritman, E. L. “High Speed Three-Dimensional X-Ray Computed Tomography: The Dynamic Spiral Reconstructor”, Proc. Of IEEE 71, 3 (March 1983), 308-319.

[8]Sabella, P. “ A Rendering Algorithm for Visualizing 3D Scalar Fields” ACM Computer Graphics Volume 22, Number 4, August 1988

[9]Webb, A. Introduction to Biomedical Imaging, Wiley- Interscience, 2003, p. 34 - 47

[10]“Computed Tomography”, Wikipedia, 17 April 2006, http://en.wikipedia.org/wiki/Computed_Tomography

[11]“Tomographic Reconstruction”, Wikipedia, 24 March 2006, http://en.wikipedia.org/wiki/Tomographic_reconstruction