
Abstract
Contents
- Introduction
- 1. Theme urgency
- 2. Goal and tasks of the research
- 3. Methods of forecasting
- 4. Analysis of statistical data for the forecasting system
- Conclusion
- References
Introduction
Any trading enterprise in modern conditions is a rather complex complex of various kinds of links, from the coordinated work of which depends the success of the enterprise as a whole. One of the important components of the company's success is effective sales forecasting. Properly designed forecast allows you to more effectively keep the accounting process, first of all, monitor and optimize costs. In addition, when it comes to the goods, this primarily allows you to make up the optimal stocks of the goods in the warehouse.
1. Theme urgency
To manage the enterprise it is necessary to be able to foresee the future state of the enterprise and the environment in which it exists, in time to prevent failures and disruptions in work, so the question of applying forecasting in the activity of this enterprise became relevant.
According to expert assessments, the high–quality management of goods flows and the company's pricing policy when using automation systems make it possible to increase profit by 50–70% [1].
The increase in profit is due to:
- reduce the need for stock, which eliminates overstocking and frees up working capital;
- increases the efficiency of procurement;
- increases the speed of the goods through the chain
Supplier–Warehouse–Buyer
.
Thus, the topicality of this topic is that, under the current unstable state of the economy, many businesses engaged in trading activities suffer losses due to a lack or excessive quantity of goods in the warehouse. Proceeding from this, it can be concluded that the management of turnover is not possible without modern automated means of accounting and planning.
The subsystem, which is being developed, will provide management with ample opportunities for operative control and management of outlets. For example, it will allow you to quickly determine the range of goods that have the greatest demand, find out how much they are left in stock and which vendor is most profitable to buy the next batch of this product. The head will be able to obtain information about the state of warehouse stocks and sales, both in the analytical section and in the dynamics.
2. Goal and tasks of the research
The aim of the work is the development of a computerized subsystem of managing the turnover of a private enterprise, taking into account the forecast of demand, which allows reducing costs for the purchase of materials.
The subsystem will allow:
- ensure the availability of goods in the right amount;
- reduce the level of missed sales;
- increase the effectiveness of control over the management of trade.
The main objectives of the study:
- perform an analysis of the functioning of the enterprise for the management of commodity turnover;
- analyze existing methods of preparing a procurement plan;
- perform an analysis, justify and choose a method for forecasting the demand for goods.
Object of research: a private enterprise with large volumes of the sale of goods.
The subject of the study: the organization of management of commodity turnover in a private enterprise, taking into account the forecast of demand.
As a result of the development of a computerized subsystem for managing the turnover of a private enterprise, taking into account the forecast of demand, it is planned to achieve the following scientific results:
- development of an algorithm for forecasting sales demand based on neural networks;
- the developed model of forecasting will allow to predict purchases with accuracy not less than 85%.
The theoretical basis of the work was the work of scientists in the fields of management accounting and computer modeling, demand forecasting, such as Bushueva L.I., Tikhonov E.E., Kostina L.N., Gareeva G.A.
3. Methods of forecasting
To manage the enterprise it is necessary to be able to foresee the future state of the enterprise and the environment in which it exists, in time to prevent failures and disruptions in work, so the question of applying forecasting became topical.
Forecasting is one of the main components of the management process. Ignoring the forecasting and planning of their work, the enterprise manager can face such situations:
- the goods are in the warehouse, not bringing profit, since there is no demand for it;
- lack of goods due to high demand.
Any of these situations will negatively affect the work of the enterprise as a whole.
The paper considers such methods of forecasting as:
- regression analysis;
- method of exponential smoothing;
- forecasting using neural networks.
Regression analysis is a statistical method for studying the effect of one or more independent variables on the dependent variable [2].
The main goal of regression analysis is the definition of an analytical form of communication, in which the change in the resultant attribute is caused by the influence of one or more factor attributes, and the set of all other factors that also affect the outcome is taken as constant and average values.
Problems of regression analysis [3]:
- Establishment of the form of dependence. Regarding the nature and form of the relationship between the phenomena, distinguish between positive linear and nonlinear and negative linear and nonlinear regression.
- Determination of the regression function in the form of a mathematical equation of one type or another and determining the influence of explanatory variables on the dependent variable.
- Estimation of the unknown values of the dependent variable. Using the regression function, it is possible to reproduce the values of the dependent variable within the interval of the set values of the explanatory variables or estimate the flow of the process outside the given interval. The result is an estimate of the value of the dependent variable.
The method of exponential smoothing The method of exponential smoothing was discovered in the middle of the 20th century by Broun and Holt separately from each other. It is often used to develop medium–term forecasts. This method is suitable for predicting no more than one period in advance. The main advantages of the method are the simplicity of calculations and the possibility of taking into account the weights of the initial information. The working formula of the method of exponential smoothing (fig. 1)[4]:
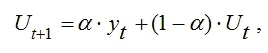
Figure 1 – The formula of the method of exponential smoothing
where
t is the period preceding the forecast;
t+1 is the forecast period;
Ut+1 – predicted indicator;
а is the smoothing parameter;
Уt – the actual value of the indicator under study for the period preceding the forecast;
Ut – exponentially weighted average for the period preceding the forecast.
When predicting using the method of exponential smoothing, the main problem is choosing the value of the smoothing parameter a (for different values of a the results will be different), as well as determining the initial value of Uo.
Advantages of the method in question:
- simplicity in implementation;
- the ability to predict non–stationary processes;
- small amount of required information.
Disadvantages:
- the new forecast depends on the accuracy of the previous one;
- the forecast depends on the smoothing factor;
- calculated only for short–term forecasting;
- low accuracy of the forecast.
One of the known prediction methods is prediction using artificial neural networks.
Artificial neural networks are mathematical models, their software implementations, built on the principle of the organization and functioning of biological neural networks – nerve cell networks of a living organism.
The neural network's ability to predict directly follows from its ability to generalize and isolate the hidden dependencies between input and output data. After training, the network is able to predict the future value of a certain sequence based on several previous values and (or) some existing factors at the moment. It should be noted that forecasting is possible only when the previous changes do in fact to some extent predetermine the future [5].
4. Analysis of statistical data for the forecasting system
The data reflecting the sales of building materials for 2015 – 2016 were considered. Based on these data, time series were constructed (fig. 2) [6]. The time series is a sequence of numerical values that are ordered in time, characterizing the level of states and changes in the phenomenon being studied[7].
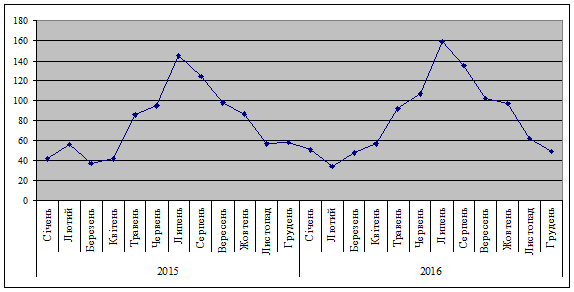
Figure 2 – Sales Schedule for 2015–2016
The purpose of the time series analysis is to describe the characteristic features of the series, to further construct a series model for predicting future values based on past observations.
For this, the correlation analysis apparatus was used. Correlation is a relationship of two or more quantities, while changes in the values of one of the values accompany changes in the values of another value [8].
Correlation analysis allows us to arrive at the following conclusions about the behavior of the time series [6]:
- If the series contains a trend, then the degree of mutual dependence between successive values of the series and the correlation between them is very high. In this case, the autocorrelation coefficient is significant for the first few shifts of the series, and subsequently decreases to zero.
- If the action of the random component is large, then the autocorrelation coefficients for any value of the shift will be close to zero. High variability of the series, which is a consequence of the influence of the random component, leads to a decrease in the mutual connection between successive values of the series and, accordingly, to a decrease in the coefficient of autocorrelation.
- If the series contains a seasonal component, then the autocorrelation coefficient will be large for the shift values equal to or multiples of the seasonal component.
In the analysis of time series, the autocorrelation of the series is calculated and an autocorrelation function is constructed (fig. 3). To calculate the autocorrelation of the series, a copy was used, shifted in the direction of the delay by a certain number of samples.
Figure 3 – Autocorrelation function of the time series of sales
(animation: frames 8; repetitions are not limited, the size is 25,4 KB)
When analyzing autocorrelation functions and visual analysis of time series, one can draw conclusions about the presence of a seasonal component. Also, there is a high degree of correlation for some shifts, which will be taken into account when constructing a predictive model.
Conclusion
When doing master's work, basic methods of forecasting were considered, existing systems for managing turnover in the enterprise were described. The analysis and preliminary processing of statistical data for the system of sales forecasting was carried out. Time series of sales of building materials for 2015 – 2016 are constructed and investigated. Also, experimental studies were carried out using data provided by a private enterprise.
When writing this essay, the master's work is not yet complete. Estimated completion date: May 2018. The full text of the work and materials on the topic can be obtained from the author or his supervisor after the specified date.
References
- Безрукова Т.Л., Борисов А.Н., Шанин И.И. Совершенствование управления эффективным развитием экономической деятельности предприятий / Общество: политика, экономика, право – Научная электронная библиотека «Киберленинка».
- Регрессионный анализ // Википедия. [2017–2017]. URL: https://ru.wikipedia.org/wiki
- Пример регрессионного анализа [Электронный ресурс] // URL: https://math.semestr.ru
- Прогнозирование на основе метода экспоненциального сглаживания [Электронный ресурс] // URL: http://www.ekonomika-st.ru/drugie/metodi
- Искусственная нейронная сеть // Википедия. [2017-2017]. URL: https://ru.wikipedia.org/wiki
- Вудвуд Е.Ю., доц. Васяева Т.А. Анализ статистических данных для системы прогнозирования продаж // Информатика, управляющие системы, математическое и компьютерное моделирование (ИУСМКМ – 2017). – Донецк, ДонНТУ – 2017, с. 247-254.
- Афанасьев В.Н., Юзбашев М.М. Анализ временных рядов и прогнозирование: Учебник. — М.: Финансы и статистика, 2001.
- Корреляция // Википедия. [2017—2017]. URL: http://ru.wikipedia.org