
Abstract
Content
- Introduction
- 1. Description of the scheme of the power facility and the source data
- 2. Verification calculation of short-circuit currents
- 3. Calculation of self-starting modes of engines SN
- Conclusions
- List of sources
Introduction
The Sochi gas power plant is an important strategic facility of the Russian Federation. The key feature of this power facility is the use of foreign equipment, in particular-special asynchronous electric motors in the system of own needs. For this ES, the calculation of short-circuit currents and the possibility of self-starting the engines of their own needs By the southern branch of ORGRES was made. This work is performed to verify the existing calculation. To check the equipment PS collected: the scheme of the normal mode and the scheme of their own needs, short circuit power, types and parameters of power equipment. According to all the information received, the program training CAD electrical part of stations and substations, based on AutoCAD, have been Lena machine design scheme, which is a complete diagram of the main electrical interconnection of ES with all the switching equipment in the system to their own needs. According to this scheme, the calculation of short-circuit currents in the maximum mode and the calculation of self-start of the engines of the system of own needs was performed.
1. Description of the scheme of the power facility and the source data
Sochi gas power plant is characterized by a branched system of its own needs, in which asynchronous motors of foreign sample are used, passport data are presented in table 1.1. The main data of the equipment are presented in tables 1.2-1.3.
Table 1.1–Passport data of section enginesSN
|
ММ |
Рн, кВт |
Kp |
Вm |
Мp |
W, rpm |
cosf |
kpd |
GD, kg * M * M |
n |
|
CN |
315 |
5.5 |
2.3 |
1.2 |
980 |
0.82 |
0.925 |
334.341 |
3 |
|
GDK |
600 |
5.5 |
2.3 |
0.7 |
2984 |
0.9 |
0.962 |
102.325 |
1 |
|
SN |
160 |
6.2 |
2.2 |
1.6 |
2984 |
0.82 |
0.96 |
11.901 |
1 |
|
Podp |
5.5 |
7 |
2.8 |
2 |
2895 |
0.88 |
0.86 |
0.096 |
1 |
|
PojN |
90 |
6.5 |
2.6 |
1.6 |
2960 |
0.92 |
0.934 |
4.317 |
1 |
|
NTVO |
37 |
6.7 |
2.9 |
1.9 |
1470 |
0.87 |
0.92 |
4.446 |
2 |
|
PEN |
160 |
7 |
3 |
2.4 |
2950 |
0.91 |
0.955 |
13.0 |
1 |
|
CNVD |
11 |
6.2 |
2.7 |
2.2 |
1460 |
0.84 |
0.885 |
0.919 |
2 |
|
KN |
55 |
7.5 |
2.8 |
2.3 |
2950 |
0.91 |
0.934 |
2.246 |
1 |
|
CNND |
5.5 |
6.3 |
3.1 |
2.5 |
1445 |
0.81 |
0.86 |
0.386 |
2 |
Table 1.2–Passport data generators
|
Number |
Pn, MW |
xd |
cosf |
|
1 |
32,5 |
0,161 |
0,8 |
|
2 |
12 |
0.11 |
0.8 |
Table 1.3–Passport data transformers
|
Number |
Sn, MW |
Class voltage, kV |
Uк, % |
|
1 |
80 |
121/10,5 |
12 |
|
2 |
10 |
115/10,5 |
10,5 |
Figure 1.1 – Diagram of the main electrical connections of the Sochi gas power station
(animation: 5 frames, 156 kilobytes 5 cycles of repetition)
The scheme of the main electrical connections presented above is characterized by three voltage classes: 110 kV on the system side, 10 kV-generator voltage and voltage of the sections of the General station load and 0.4 kV on the own needs side. CH is powered through TSN 1 and TSN 2, or through RTSN, labeled T-5. The total station load consists of 2 sections of 10 kV, with connected circulation pumps (TSN) and gas-booster compressors (GDK), as well as transformers of own needs of 10/0.4 kV. Sections of own needs of units and sections of plant load share bus at 0.4 kV. SN feature of the ES is also the absence of irresponsible engines in the solution design Institute.
2. Verification calculation of short-circuit currents
The southern branch of ORGRES calculated the short-circuit currents in the key circuits. For this calculation, a simplified scheme of the main electrical connections of the object was applied (figure 2.1) and a replacement scheme (figure 2.2). To simplify further calculations, each node of the scheme was assigned a number. The results of the calculations are presented only for 1, 4, 7 and 8 nodes. The test calculation is carried out according to the method of nodal potentials in the matrix form of recording using the functions of calculating the resistances of the main electrical equipment.
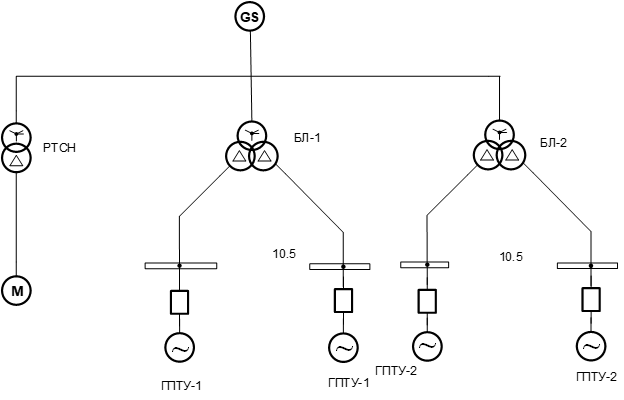
Figure 2.1 – Simplified calculation scheme
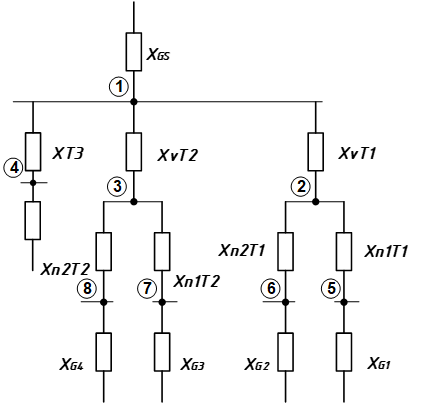
Figure 2.2 – The calculated equivalent circuit
The calculation results obtained by ORGRES are presented in table 2.1. Calculations were made under the following conditions: base voltage 115 kV and 10.5 kV, base power 80 MVA.
Table 2.1–Known fault current levels
|
The value of the currents of a three-phase short circuit, kA |
|||
|
On-load tap-changer position T1 and T2 |
Neutral |
Extreme upper |
Extreme bottom |
|
Node number |
|||
|
1 |
13,3 |
13,26 |
13,31 |
|
4 |
4,96 |
4,88 |
5,22 |
|
7 |
30,79 |
30,53 |
30,92 |
|
8 |
24,39 |
24,15 |
24,51 |
First of all, the mathematical package MathCAD was used for verification, with the program for calculating short-circuit currents developed in it. First of all, a matrix of branches of the initial circuit was formed (Fig. 2.3).
Figure 2.3 – Matrix of circuit branches
Для каждого узла был прописан уровень напряжения (рис 2.4) , сформирова-на вспомогательная матрица P (рис 2.5).
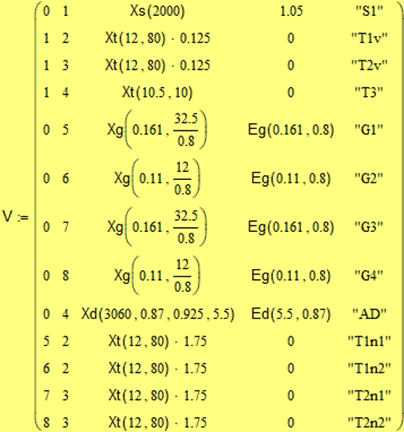
Figure 2.4 – Knot stress matrix
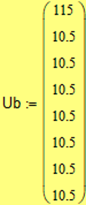
Figure 2.5 – Auxiliary matrix P
Using standard formulas characteristic of the nodal potential method in the matrix form of writing, we obtain the result (Fig. 2.6).
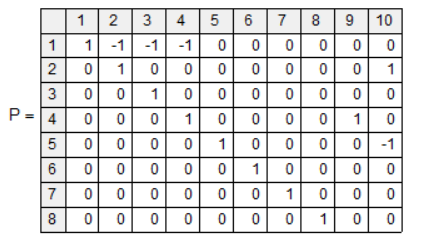
Figure 2.6 – Implementing CBM in MathCAD
To analyze the results, the results of calculations of the Southern branch of ORGRES and the results of calculations in the MathCAD software are summarized in one table (table 2.2) and the relative error is determined by the formula:
d=(I1-I2)/I1*100%
Table 2.2–Comparison of the results of the calculation of short-circuit currents
|
Node number |
Short-circuit current as calculated by ORGRES, kA |
Short circuit current as calculated in MathCAD, kA |
Relative error, % |
|
1 |
13,3 |
13,8 |
3,6 |
|
4 |
4,96 |
6,8 |
27 |
|
7 |
30,79 |
34,1 |
9.701 |
|
8 |
24,39 |
27,1 |
10 |
Thus, in a node with a connected powerful motor load (node 4), a large discrepancy was found. In this regard, we carry out a resistance test in all branches, the test result is summarized in table 2.3.
Table 2.3–Comparison of branch resistance calculation results
|
Start of branch |
End of branch |
ORGRES, Xv, Ohm |
MathCAD, Xv, Ohm |
|
0 |
1 |
- |
0,04 |
|
1 |
2 |
0,012 |
0,015 |
|
1 |
3 |
0,012 |
0,015 |
|
1 |
4 |
0,84 |
0,84 |
|
0 |
5 |
0,32 |
0,317 |
|
0 |
6 |
0,59 |
0,587 |
|
0 |
7 |
0,32 |
0,317 |
|
0 |
8 |
0,59 |
0,587 |
|
0 |
4 |
4,06 |
3,991 |
|
5 |
2 |
0,215 |
0,21 |
|
6 |
2 |
0,215 |
0,21 |
|
7 |
3 |
0,215 |
0,21 |
|
8 |
3 |
0,215 |
0,21 |
As can be seen from the table, the discrepancies in the resistances are very small, in the AB branch, the error is only 1.7% with a fault current error of about 27%.
3. Calculation of self-starting modes of engines SN
The choice of the scheme was due to the presence of a real object: the Sochi gas station. A fragment of its scheme is presented in Figure 3.1.
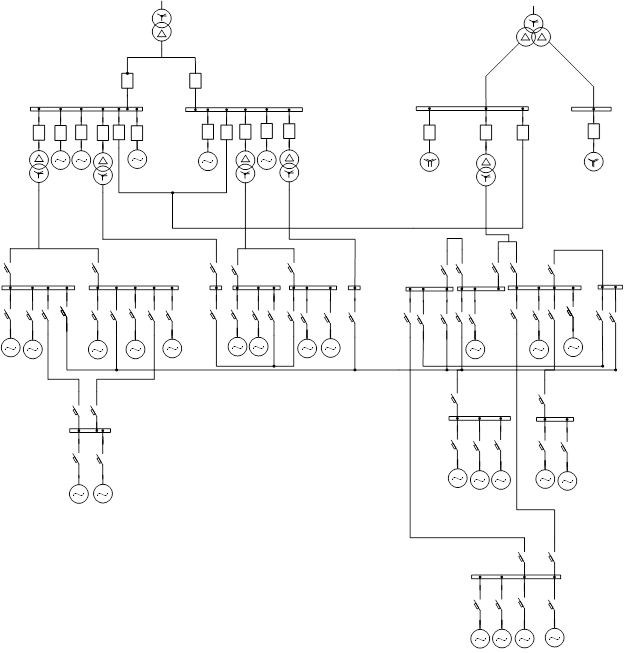
Figure 3.1 – Settlement scheme of the Sochi station
The self-start process is preceded by the run-out mode of the units. Separate individual (single) and group run-out of electric motors. Individual run-out is called such run-out, when one engine is disconnected from the network and from other engines, or when electrically coupled engines do not have a significant impact on the run-out process (similar units with the same load factors, between the engines included reactor or transformer). The reduction of the motor speed occurs under the action of the resistance torque of the mechanism. When fueling the engines close to the fault runout will occur on a steeper characteristic, due to the occurrence of additional braking torque. If the mutual influence of the motors disconnected from the power supply is great, then this run-out is called a group run-out. At group run-out the part of engines having big constants of time of units, move to the generator mode and give a part of the kinetic energy to the engines having smaller constants of time of units and working thus in the motor mode. The rotational speed of the engines operating in the generator mode is reduced somewhat faster, and the engines operating in the power consumption mode are slightly slower than in the individual run-out. So for example, for S. n. TPP with a power interruption duration of 1-2. 5 s, the fan motor rotation speed in the group run-out is about 5% lower than in the individual run - out, and the average rotation speed of the pump motors is about 15% higher than in the individual run-out [2]. When the engines run out, if the pause is caused by switching off the ignition source, the residual voltage generated by the engines that have entered the generator mode is stored on the tires.
The magnitude and rate of attenuation of this voltage is determined by many factors: the previous period of operation, run-out conditions, the type of engine and mechanism, electromagnetic parameters of the engine. The duration of self-start is limited by the heating of electric motors and the need to maintain the technological mode of operation of the equipment while reducing the angular velocity of the responsible mechanisms. For cross-linked power plants, the self-start time is limited only by heating the electric motors and is within 25 & ndash;35 s. for block power plants, the self-start time is limited by the reliability of the process and is 20 s.[6]. At more exact calculations of self-start of electric motors and the mechanisms brought by them consider its separate stages: braking at short circuit or power failure, run-out, repeated power inclusion, group self-start. In this case, the decrease in the rotational speed during the run-out and the duration of self-start are determined on the basis of solving the equation of rotor motion.
In the process of group self-start there is a change of sliding, currents of electric motors and voltage on tires. With this in mind, the methodology developed grapho-analytical calculation of the group-starting motor by the method of successive intervals. The calculation is performed in the following sequence: for a given power interruption time, the individual run-out of the motors is calculated using the rotor motion equation In the event that the run-out of the engines is a group, the speed of rotation of the units obtained at the end of the run-out must be multiplied by the correction factor [7]. Depending on the run-out mode, the value of this coefficient is taken: during the run-out during the C. s. on the s. n. for pumps 0.97; for fans 0.99; at the group run-out caused by a power interruption of the tire sections, respectively 1.15 and 0.95. According to the torque characteristics of the units for the obtained rotational speeds, the resistance moments of the po mechanisms and the torques of the electric motors are found, which are then reduced to the actual initial voltage when self-starting.
In option A1, it is necessary to perform a group self-start calculation of both sections of the 10 kV main power supply unit (ED TsN-1, TsN-2, TsN-3 and GDK-1, GDK-2 10 kV) during a 1.8 s power outage according to the following condition: disconnect T -5 backup protection, power is supplied from block 1, the block ED is loaded. The design scheme of this option is shown in Figure 3.2..
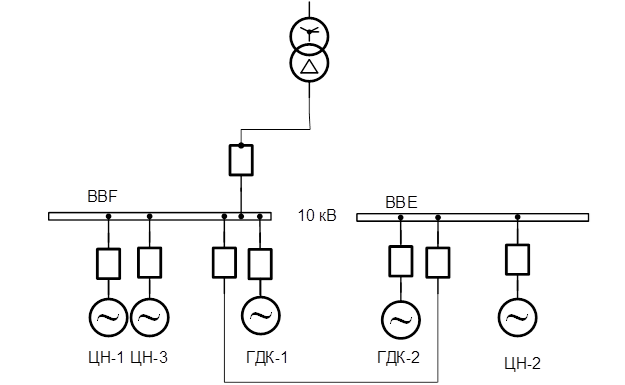
Figure 3.2 – Schematic diagram of option A1
In fig. Figure 3.3 shows the engines involved in self-starting. In fig. 3.4 the conditions for calculating self-start with an individual coast without an up-load in the MathCAD shell are presented.
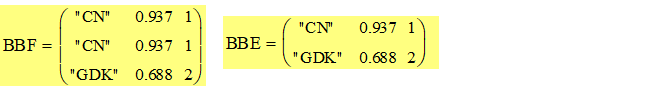
Figure 3.3 – Self-starting engines
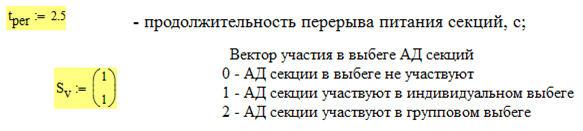
Figure 3.4 – Conditions for calculating self-start in the MathCAD shell
In figure 3.5, the characteristics of different blood pressure are represented by lines of different colors. The names of the mechanisms from the first to the eighth: TsN-1, TsN-2, GDK-1, TsN-3, GDK-2
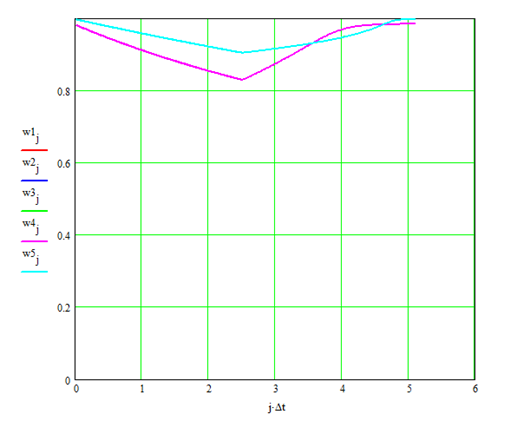
Figure 3.5 – Changing the BP rotation frequencies during their self-start after a power interruption lasting 2.5 seconds.
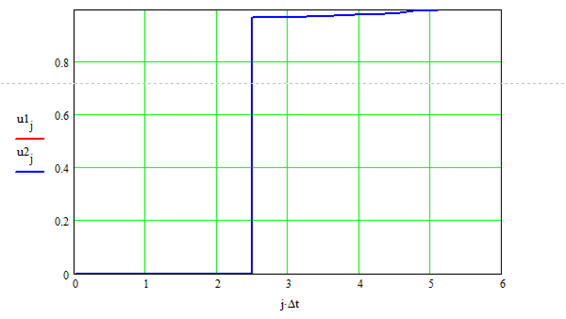
Figure 3.6 – Changes in section voltages during the self-start.
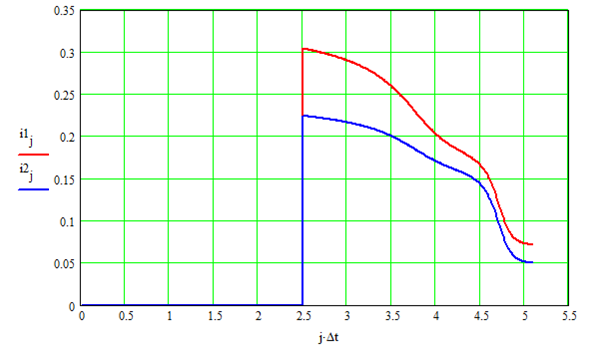
Figure 3.7 – Change in currents sections during self-start
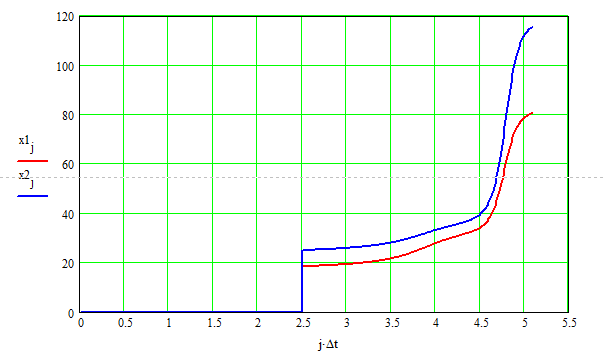
Figure 3.8 – Changing the resistances of sections during startup
Conclusions
1. An electronic design diagram of the main electrical connections of the Sochi gas power station has been created, which allows to simulate its operation modes, as well as change its configuration by simulating switching devices.
2. Calibration calculation of short-circuit currents at key nodes of the power facility in MathCAD software and training CAD of the electrical part of stations and substations
3. To test the engine self-starting mode, 3 different options were developed. In option A1, self-starting of electric motors occurred in 3 seconds, and the initial residual voltage in the section is 1.02 of the rated voltage. In the case of A2, the self-starting of the electric motors occurred in 4.3 seconds, and the initial residual voltage on the sections was 1.03 of the rated voltage.
4. Option B1 involves self-starting at the same time the engines of the sections 10 and 0.4 kV. In this case, the self-starting of the motors took place in 4 seconds, the voltages were reduced to a voltage of 0.4 kV, and, according to the results, at the time of self-starting, in some sections they decreased to 0.7 from the nominal, for 10 kV sections the voltage decreased by 2%.
5. As a result of all the studies, we can conclude that the operation of the Sochi gas station circuit can be carried out without shutting down the ZMN 2 stages of non-responsible engines.
The master's thesis is devoted to the urgent scientific task of creating a CAD system for the electrical part of power plants and its implementation in the conditions of the power system of Donbass and Russia
Further research focuses on the following aspects:
- Expanding program capabilities, creating controlled electrical circuits.
- The introduction of European methods of mathematical representation of the physics of the behavior of engines and generators.
When writing this essay, the master's work is not yet completed. Final completion: May 2020. Full text of the work and materials on the topic can be obtained from the author or his manager after the specified date.
List of sources
- Неклепаев Б. Н.
Электрическая часть электростанций и подстанций для кур-сового и дипломного проектирования
/Неклепаев Б. Н., Крючков И. П. Энер-гоатомиздат, Москва,1989. – 607 с. - СТО 56947007-29.240.30.010-2008. Схемы принципиальные электрические распределительных устройств подстанции 35-750 кВ. Типовые решения.–Введ. 2007-12-20. Москва: ОАО
ФСК ЕЭС
, 2007. – 132 с. - СТО 56947007-29.240.10.028-2009. Нормы технологического проектирования подстанций переменного тока с высшим напряжением 35-750 кВ (НТП ПС).–Введ. 2009-04-13. Москва: ОАО
ФСК ЕЭС
, 2009. – 96 с. - Правила устройства электроустановок.–7-е изд.–Москва: ЭНАС, 2017.–330 с.
- Рожкова Л. Д., Козулин В. С. Электрооборудование станций и подстанций.–Москва Энергоатомиздат, 1987. – 648 с.
- ГОСТ Р 50270-92 Короткие замыкания в электроустановках под редакцией В. П. Огурцова-Ростов-на-Дону
РОСТОВТЕПЛОЭЛЕКТРОПРОЕКТ
1992 г. - Павлюков В. А. Учебная САПР электрической части станций и подстанций : учеб. пособие / В. А. Павлюков, С. Н. Ткаченко, А. В. Коваленко.–Харьков : ФЛП Панов А. Н., 2016. – 124 с.
- Официальный сайт
CAD Electric Education
. https://es-cad.ru
- Васильев А. А.
Электрическая часть станций и подстанций
–2-е издание–Энергоатомиздат, Москва, 1990, – 576 с. - Бадагуев Б. Т. Пожарная безопасность на предприятии: Приказы, акты, ин-струкции, журналы, положения / Б. Т. Бадагуев.–М.: Альфа-Пресс, 2013. – 488 c.