
Abstract
When the abstract was writing this master's work was not complete yet. Final completion: june 2020. Full text of work and materials on the topic can be obtained from the website after this date.
Содержание
- Introduction
- 1. Goal and tasks of the research
- 2. Analysis of the subject of the study
- 2.1 Object analysis
- 2.2 Analysis of the demographic component of the population
- Conclusion
- References
Introduction
In last years, the Internet has taken a rather important part of our lives. People use it in daily life constantly and often cannot exist normally without access to the world network, especially when working remotely from home. Many of the Internet is now perceived as a normal resource, necessary for a comfortable life and occupying the same place with electricity, heat, gas and water. It’s hard to imagine our lives without the internet right now. Therefore, it is natural that everyone expects to access the resources of the global network at high speed and at affordable prices. For some categories of citizens, however, this still remains an unattainable dream or luxury. This is especially true for private sector residents. Data traffic is the main component of communication systems. And in order to provide quality service to increasing traffic flows, appropriate methods of analysis and monitoring of networks are needed, which constantly face incomplete and increasing demands of users and network systems. Traffic analysis is a vital component for understanding network requirements and capabilities.
1. Goal and tasks of the research
The aim of the scientific work is research of the conditions for improving the efficiency of access to the Internet using the example of Makeevka village.
In the scientific work it is necessary to solve the following tasks:
- To carry out an analysis of the object and demographic component of the population;
- Define statistics of used traffic;
- Calculate self–similar traffic;
- Identify the best connection type;
- Simulate traffic changes from social groups.
2. Analysis of the subject of the study
2.1 Object analysis
For residents of multi–story buildings Internet connections is not a problem, as most often they are provided with a wide range of connections and various services. They can choose not only a certain package of services, but, in some cases, even a provider who will provide them with these very services. The main problem of connection in the territory of a single–story buildings private building is that most often there is only one provider in such territory, which does not care very much about connection of these subscribers. There are even situations where no provider is served in such settlements. The fact is that most often providers consider it not economically profitable to invest funds and resources in creating or improving the network infrastructure of the private sector. This is due to the complexity of cable routing, the great distance from existing lines and the low density of potential customers. It is much easier and more profitable for providers to connect multi–story buildings which require less money spent, will pay off quickly and will begin to bring profit than to extend their services to private developments.
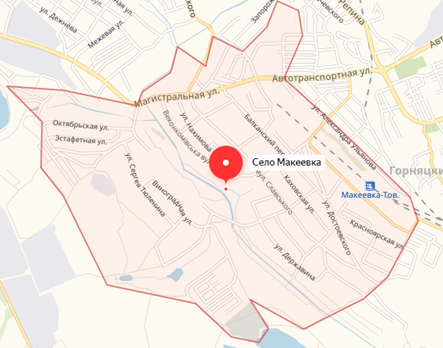
Figure 1 — Considered territory
There is a provider in the territory under consideration, but as previously mentioned, does not actively connect possible subscribers. Mostly on this site in some places old copper communication lines are laid, but the number of services on them is very limited.
Recent studies show that telecommunication traffic for most types of services is self–similar (fractal) [6,7].
A stochastic process is called fractal when some of its (important) statistical characteristics exhibit scaling properties with corresponding scale indicators. Since scaling mathematically results in power ratios in scalable quantities (i.e., power dependence of statistical characteristics), one can conclude that, for example, telecommunication traffic, exhibits fractal properties when some of its estimated statistical characteristics exhibit power dependence over wide time or frequency bands.
2.2 Analysis of the demographic component of the population
The Interrelation between demographic processes and telecommunications has been under discussion for a long time, and demographic research is the basis for assessing a large number of indicators in different spheres of life.
According to the General Department of Statistics of the DNR as of January 1, 2019, the total population of the Republic amounted to 2.3 million people, including 94 % of the urban population and 6 % of the rural population. The city of Makeevka has a population of 370,000, including approximately 2.3 thousand in the village of Makeevka. The birth rate in the Republic has negative dynamics. However, it is worth noting that at the same time the mortality rate, on the contrary, has a small positive dynamic in the decline and by the end of 2018 decreased by 0.5 %.
Using statistics on the Donetsk People's Republic, we will give an age demographic pyramid.
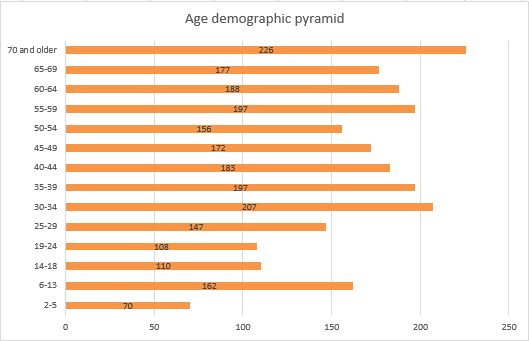
Figure 2 — Age demographic pyramid of Makeevka village
Using statistics, we will identify the number of people of each of the age groups we set who use the Internet depending on the time of day.
| 0:00–2:00 | 2:00–4:00 | 4:00–6:00 | 6:00–8:00 | 8:00–10:00 | 10:00–12:00 | 12:00–14:00 | 14:00–16:00 | 16:00–18:00 | 18:00–20:00 | 20:00–22:00 | 22:00–00:00 | |
| 2–5 | 0 % | 0 % | 7 % | 10 % | 16 % | 17 % | 17 % | 16 % | 82 % | 84 % | 81 % | 3 % |
| 6–13 | 0 % | 0 % | 0 % | 30 % | 8 % | 8 % | 15 % | 66 % | 90 % | 95 % | 90 % | 1 5% |
| 14–18 | 7 % | 0 % | 0 % | 40 % | 8 % | 8 % | 8 % | 60 % | 90 % | 95 % | 90 % | 50 % |
| 19–24 | 18 % | 8 % | 0 % | 50 % | 7 % | 7 % | 7 % | 7 % | 88 % | 95 % | 93 % | 72 % |
| 25–29 | 17 % | 7 % | 2 % | 65 % | 7 % | 6 % | 6 % | 7 % | 55 % | 90 % | 95 % | 88 % |
| 30–34 | 14 % | 6 % | 3 % | 66 % | 6 % | 5 % | 5 % | 6 % | 45 % | 89 % | 94 % | 87 % |
| 35–39 | 7 % | 4 % | 2 % | 65 % | 6 % | 5 % | 5 % | 6 % | 47 % | 89 % | 95 % | 88 % |
| 40–44 | 6 % | 4 % | 2 % | 67 % | 6 % | 5 % | 5 % | 6 % | 45 % | 90 % | 95 % | 88 % |
| 45–49 | 4 % | 0 % | 2 % | 65 % | 7 % | 6 % | 6 % | 7 % | 55 % | 90 % | 95 % | 88 % |
| 50–54 | 0 % | 0 % | 3 % | 66 % | 6 % | 5 % | 5 % | 6 % | 45 % | 89 % | 94 % | 87 % |
| 55–59 | 0 % | 0 % | 2 % | 65 % | 6 % | 5 % | 5 % | 6 % | 47 % | 89 % | 95 % | 88 % |
| 60–64 | 0 % | 0 % | 7 % | 58 % | 48 % | 27 % | 18 % | 24 % | 31 % | 58 % | 35 % | 4 % |
| 65–69 | 0 % | 0 % | 9 % | 52 % | 44 % | 23 % | 17 % | 22 % | 29 % | 52 % | 23 % | 3 % |
| 70 and older | 0 % | 0 % | 10 % | 45 % | 32 % | 21 % | 14 % | 19 % | 27 % | 45 % | 19 % | 2 % |
Figure 3 — Dependence of Internet usage on age group
(animation: 8 frames, 7 cycles of repetition, 143 kilobytes)
Give values of traffic generation by one person per hour. For this purpose, using average data, we will show the overall average between listening to music online, watching videos, communicating in messengers, surfing the Internet, online games, downloading files and further using them offline.
| MB/h | GB/h | |
| Music | 76.8 | 0.077 |
| Video | 2233 | 2.233 |
| Messengers | 12 | 0.012 |
| Games | 500 | 0.5 |
| Surfing | 10 | 0.01 |
| Download and offline use | 2000 | 2 |
| Average | 805.3 | 0.805 |
Using the data in Table 1, we can calculate the number of people using Internet services in each age group and in each time interval. After summing up the number of such people in all ages, group and all periods of time, we will get a value equal to the number of hours during which in the specified territory use the Internet during the whole day and equal to 17580.
After this value is calculated, it is possible to calculate the total traffic for all residents of the village of Makeevka, multiplying the average value of traffic generation by one person per hour by the number of hours during which the Internet is used on the specified territory during the whole day. Total traffic will be approximately 14.2 Тб.
Conclusion
Based on the results of the analysis of the object and the demographic component, it can be concluded that there are several possibilities to connect subscribers in a single–story building of private sector, but each has its own both positive, such as high speed or ease of connection, and negative qualities, such as high cost. The provider should provide places of a large accumulation of people with a stable Wi–Fi connection, as well as provide each of its customers with a high–quality Internet connection. It can also be concluded that population demography strongly affects the volume of traffic, in general, and in each age group, in particular.
References
1. Способы построения сети в частном секторе [Электронный ресурс] — Режим доступа: https://lantorg.com/....
2. Киренберг А. Г. Проблема подключения к интернету малоэтажного жилого сектора и возможный способ ее решения / А. Г. Киренберг, О. М. Колесников // Вестник Кузбасского государственного технического университета. — 2015. — № 1 (107). — c. 84–87.
3. PON [Электронный ресурс] — Режим доступа: https://ru.wikipedia.org/....
4. Радке Хорст–Дитер. Все о беспроводных сетях / Хорст–Дитер Радке , Йеремиас Радке. — М.: НТ Пресс, 2011. — 320 c.
5. Шубин В. И. Беспроводные сети передачи данных / В. И. Шубин, О. С. Красильникова. — М.: Вузовская книга, 2013. — 104 c.
6. Исследовании свойства самоподобного трафика мультисервисной сети [Электронный ресурс] — Режим доступа: http://www.vestnik.vsu.ru/....
7. Terdik, G. Gyires, T. Levy Flights and Fractal Modeling of Internet Traffic, Feb. 2009 Page(s): 120–129 [Электронный ресурс] — Режим доступа: https://ieeexplore.ieee.org/....
8. Демографические процессы Республики — основа ее социально–экономического развития [Электронный ресурс] — Режим доступа: http://mer.govdnr.ru/....
9. Демографическая ситуация в ДНР [Электронный ресурс] — Режим доступа: http://xvesti.ru/....