
Abstract on the topic Research of methods of determination of structural reliability in infocommunication networks
Abstract
Content
- Introduction
- 1. Relevance of the topic
- 2. Purpose and objectives of the study
- 3. Approximate method for determining structural reliability
- 4. Method using the availability of communication lines
- Summary
- Source list
Introduction
Recently, there has been a sharp increase in the volume of traffic transmitted through infocommunication networks. This is due to the rapid development of information transfer technologies in the industry. That leads, in turn, to increase of requirements to reliability and uptime of means of communication. Reliability is directly dependent on the load coming to the network, if it exceeds its redundancy, then there are failures and data losses. The term uptime characterizes the ability of the system to maintain its performance not only in the normal load mode, but also in the case of peak.
The involvement of telecommunication network operators in market relations highlights the need to improve the quality of services provided. In the specified document technical norms on indicators of functioning of communication networks are formulated: telephone, Telegraph and data transmission, and also technical norms on indicators of reliability of these networks. Achieving the normative values of the above indicators in operation is impossible if these indicators are not laid down at the design stage of telecommunication networks. For communication networks, which are complex multifunctional systems, which consist of a large number of heterogeneous devices in their properties, reliability indicators, purpose, date of manufacture, commissioning, operating conditions, etc., we can distinguish two aspects of reliability: hardware and structural. The hardware aspect is understood as the problem of ensuring the reliability of equipment, individual devices and their elements forming a communication network.
The structural aspect of reliability reflects the functioning of the network as a whole, depending on the state of nodes and communication lines. The structural reliability of the network is connected, first of all, with the possibility of the existence of information delivery routes between the corresponding nodes or points of communication of the network.
1. Relevance of the topic
TThe relevance of the work is that currently there is a rapid development of infocommunication, which leads to an increase in the amount of information transmitted. In this regard, the network devices are subject to increased requirements of reliability and uptime.
2. Purpose and objectives of the study
The aim of the work is to increase the definition of structural reliability of the network by using the availability coefficients of different types of communication nodes.
Tasks:
- To analyze the existing methods of determining the structural reliability of infocommunication networks.
- To develop an algorithm for calculating structural reliability indicators.
- To carry out modeling for the analysis of the carried–out calculations.
Research object: Moore FSM synthesis.
Research subject: association of hardware amount reduction methods at Moore FSM implementation on FPGA.
3. Approximate method for determining structural reliability
The approach is that Vi is the ratio of the number of i–th type to the average number of I that are executed with a single execution of computing processes in a network device, where i=1,M, and M is the number of types of commands applied in the computations, which are implemented in the component network. In this case, the probability of failure–free operation and execution of the task (RZ) is calculated by the formula:
where Pк=∑ViPi – probability of average command execution;
Pi – probability of execution of the i–th command;
Vi – is using the Gibson method.
The calculation of probability of failure–free execution of commands within the time t of the computational process of RVP(t) based on the results of a calculation or estimation of the uptime of RZ and on the particular mathematical model that describes the flow of requests for the task. In most practical cases the flow of requests can be accepted by the Poisson. This is due to a lot of non–priority factors causing applications. Hence there is no aftereffect of both ordinary and stationary flow, that is, those properties that are inherent in the simplest flow.Then the probability that during time t the i–th number of applications will be received is determined by the formula:
From this it follows:
where z=μtPз
The result is:
The average work to failure depends on the computational process and is determined by the expression:
Thus, the average time to functional failure relative to computational processes is inversely proportional to the probability of the flow of applications for tasks.
The above method is described, and there are various methods to enhance. First of all, it is hardware redundancy and temporary redundancy. As for functional reliability, the effectiveness of structural redundancy is problematic. This is because errors in the computing process cannot be eliminated by switching to standby if these errors are caused by random failures, software errors, or errors in input information. In the information process, errors are eliminated with the help of information redundancy. Temporary redundancy can have a tangible effect in improving functional reliability, but the use of traditional double–triple counting methods is applicable where there are no too strict time constraints for tasks.
These considerations suggest the need for a comprehensive application of flexible strategies to ensure the functional resiliency of the MSS. These strategies, along with the above, include the introduction of control points in the implementation of computing and information processes. The approach is well known, however, if the time intervals between checkpoints are chosen in such a way that in them between applications to ensure the detection and elimination of functional partial failures, the content and effectiveness of such a strategy will change radically. Another effective strategy for improving functional reliability is the use of natural, temporary, functional and structural redundancy in MSS.
To parry functional failures, it is advisable to introduce special mechanisms for rational use of redundancy. These mechanisms, together with redundant facilities, form functional failover (CO) facilities.
The purpose of the means of ensuring functional failover:
- detection of an error in the program or in the operation of technical means;
- fault isolation;
- classification of fault;
- deciding on the nature of the fault and interrupting the process task;
- the detection of faults in;
- MTS reorganization and malfunction masking;
- restoration of the task execution process.
Thus, Coos are designed to enable the MS to adapt to functional failures. It is obvious that the main word for the definition of the composition and structure of the JI is for the developers of the MS.
The indicator that shows the effectiveness of JI is probability successful negotiation of MS and MTR to functional failures:
where Ω – this is a structural, temporary resource that is used without deterioration of other security indicators;
Ωg – allowable resource consumption.
If the resource is time, and the allowable consumption – this is the allowable outage time of the MSS tg, то:
where – this is the interval from the beginning of the occurrence of the fault until it is corrected and the workflow is restored;
fv(t) – random time distribution density function V.
The allowable time of interruptions in the system is random and is distributed exponentially, and the parameter ρg, and the full probability formula.:
where fv·(S) – is a Laplace transformation.
We estimate the probability that either no functional failures will occur during the execution of the task, or the partial functional failures that have occurred will be successfully neutralized by providing fault tolerance based on the allowable cost of excess resources. We denote the probability of failure–free execution of the task as RZ and the probability that there were no functional failures as P1 during the execution of the task. Then the probability of failure–free execution of the task under the guise of a means of ensuring functional failover will be equal to:
where β – probability of successful adoption of the first level of protection; g1=1-P1;gз=1-Pз.
If g1≤1 и gз≤1, then with an error not greater than the second order we determine:
Between the probability of successful adaptation of MSS to failures with probability g1 and gpз. β1=1-exp[–σξ], where ξ =5…10 – this is a rationing factor, but ξ=g1/(gз+g1).
This method can be applied to large, extensive networks, such as a pension Fund or tax service, which require high reliability and smooth operation.
4. Method using the availability of communication lines
To assess the structural reliability of the network, indicators are used that to some extent characterize the stability of the network operation to failures of its elements–nodes or communication lines. The choice of the indicator (group of indicators) of structural reliability is determined, first of all, by the mathematical model of adequate communication network used. As such a model, we use a probabilistic graph, the vertices of which are set in accordance with the nodes, and the edges–the communication lines of the network. The weights of the graph elements represent reliability indicators of nodes and communication lines of the network–readiness coefficients of nodes or communication lines of the network. In this case, the values of indicators can be determined on the basis of statistical data or various hypotheses. In the present paper to study the structural reliability of different variants of construction of the transport network the coefficients of readiness of communication lines are calculated by the formula:
where Кгij – availability factor of the communication line between nodes i and j of the transport network;
Lij – link length between nodes i and j; L0 – unit length of the communication line (100 km);
Кг0 – the readiness factor of the communication line of unit length.
The coefficients of availability of the communication – KY, in accordance with the technical requirements, is the value of KY ≥ 0,99999 and significantly increase the reliability of communication lines. Therefore, in the above studies, the reliability of the nodes is not taken into account.
To estimate the structural reliability of the network the mathematical expectation of the number of links in the network is used М*ОТН(Х), which is calculated by the formula:
where Х – a random variable that corresponds to the number of links in the network;
n – number of corresponding network nodes;
М(Х) – the mathematical expectation of the number of links in the network, taking into account the unreliability of nodes and communication lines.
To determine the proposed indicator of structural reliability, the simulation is used, the algorithm of which is presented in Fig.1.
Since each numerical characteristic of a random variable X corresponds to a statistical analogue, the expectation of the number of connections in the network М*ОТН(Х) in this case it is estimated as the arithmetic mean of the observed values of the random variable Х–М*ОТН(Х).
Figure 1 – The algorithm for calculating structural reliability
GIF image (10 frames, 7 cycles, 43,8 Kb)
1 – beginning;
2 – input of initial data;
3 – i=1;
4 – drawing of States of graph elements in the i–th test;
5 – determination of the number of links in the graph i&ndashth test;
6 – i=i+1;
7 – i≤N;
8 – calculation М*ОТН(Х) ;
9 – output results;
0 – end;
As the initial data for the solution of the analysis problem we will use:
а) network structures represented by weighted graphs:
- option 1 – the radial–hub;
- option 2 – annular;
- option 3 – a network–like network with a node connectivity factor of at least 3;
- option 4 – a network–like network with a node connectivity factor of at least 5;
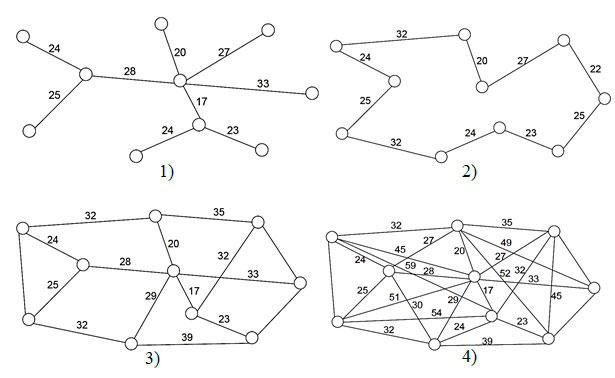
Figure 2 – The structure of the analyzed networks: 1) – the radial–hub structure; 2) – annular structure; 3) – network structure; 4) – fully connected structure.
b) the number of vertices n=10 (the location of nodes in the study of different variants of the network does not change);
c) the weight of each edge of the graph represents the link length and the availability factor respectively;
d) the coefficient of readiness of the communication line of its unit length during calculations varies from 0 to 0,999;
f) the rank of paths (the number of network segments forming a path) used to link the vertices of a graph varies depending on the network structure from 1 to n – 1;
g) the number of tests carried out for a given value of the CLC is determined by the requirement for the accuracy of the results with a confidence probability 0,95.
Summary
The developed algorithms calculate the structural reliability of infocommunication networks, including both approximate and detailed calculation of indicators of reliability, allow to solve not only tasks of analysis and synthesis task, which gives the opportunity effectively to make a choice of acceptable variant of the structure of the transport network taking into account the reliability of communication lines of the network, and can be used at the design stage and also to adjust the structure of transport network conditions.
Список источников
- Теория сетей связи / под ред. В. Н. Рогинского. М.: Радио и связь, 1981.–192 с.
- Закиров В. И., Золотухин В. В. Исследование надёжности беспроводных сетей методом имитационного моделирования в среде AnyLogic // Имитационное моделирование для науки и бизнеса (ИММОД–2011), Санкт–Петербург, 2011. c. 365–369.
- Никольский И. Е. Модели и методы построения широкополосных оптических сетей доступа. Автореферат диссертации на соискание учёной степени д. т. н. ФГУП ЦНИИС–ЛОНИИС, Санкт–Петербург, 2011.–33 с.
- Алигулиеев Э. А. Вероятность безотказной работы сети. E–journal “Reliability” Theory & Application, №1, vol. 2, 2011. – С. 88–90.
- Бугров Д. А. Методы поэтапной структурной оптимизации магистральных корпоративных сетей. Автореферат на соискание учёной степени к. т. н. Нижегородский государственный технический университет. Нижний Новгород, 2007.–10 с.
- Рахматулин А. М. Разработка метода расчёта отказоустойчивости решётчатых оптических транспортных сетей. Автореферат на соискание учёной степени к. т. н. ФГУП ЦНИИС, М.: 2010.–19 с.
- Попков В. К. Математические модели связности. Новосибирск: РИЦ «Прайс–курьер», 2006.–490 с.
- Лившиц А. П., Мальц Э. А. Статистическое моделирование систем массового обслуживания. М.: Сов. радио, 1978.–248 с.
- Величко В. В., Субботин Е. А., Шувалов В. П., Ярославцев А. Ф. Телекоммуникационные системы и сети / под ред. В. П. Шувалова. Том 3. М.: Горячая линия–Телеком, 2005.–711 с.