Essay
Информация о авторе
Abstract
- Introduction
- 1. Relevance
- 2. The purpose and objectives of the study
- 3. Analysis of existing methods
- 4. The principle of operation of radiological charts in radiation therapy
- 5. Conclusions
- List of sources
Introduction
One of the main aspects of the treatment of cancer is radiation therapy. In order to begin treatment of a person, a topographer identifies the affected areas of human tissue on x-rays, the so-called "artifacts". In the future, the doctor determines the type of oncological pathology, as well as the number and type of radiation, which is aimed at destroying the tissues affected by oncology. To minimize damage to healthy cells of the body, so-called “radiological maps” have been created – these are maps that reflect by what pattern waves of a certain type (alpha, beta, gamma) will be scattered. At the moment, the selection of these cards is manual, which greatly slows down the pace of patient treatment. Because of what, the treatment is delayed, and the patient’s health is not displayed satisfactorily.
1. Relevance
This system is relevant because at the moment, the selection of radiation cards is done manually, which takes a lot of time from a topographer, thereby increasing the patient’s treatment time, and time in this area of activity is an extremely important aspect.
2. The purpose and objectives of the study, planned results
The goal is to provide high quality services for patients with cancer, to simplify the preparation of the patient for radiation therapy, to improve the effectiveness of this therapy in the initial stages.
Objective
• Providing a better x-ray image
• Optimization of the process of selecting radiological charts for radiation therapy
• Improving the quality of services provided to patients in the oncology center
3. Analysis of existing methods
3.1. Object Detection and Recognition
First of all, after receiving the next image, it is required to select objects of interest on it, namely the focus, and then clarify the type of object found. To solve this problem, there are many different approaches, namely segmentation, feature detection, categorical recognition, etc., for further analysis, the following groups of methods were identified: those based on pattern matching and based on feature extraction. [2]
3.2. Detecting objects using the template search method
This group of methods works according to the following principle: two components are required – the original image and the template image. To determine a similar area, it is necessary to impose a template on the picture and move it pixel by pixel, from left to right, from top to bottom. In each position, a metric is calculated that shows whether the pictures match or not. For each position of the template, the metric is entered in the resulting matrix R. Each position (x, y) in R contains a metric of matches. [4]
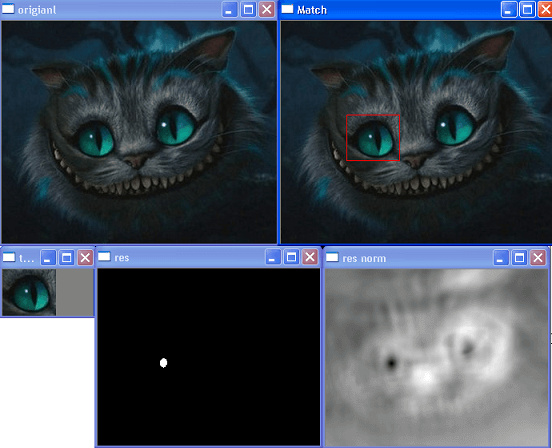
An example of the method of detecting objects
3.3. Principal Component Method (CIM)
It is one of the ways to reduce the dimensionality of data with minimal loss of information. This method reduces to calculating the eigenvectors and eigenvalues of the covariance matrix of the source data [5]. To apply the principal component method to luminescent images, a table of initial data was formed as follows: the image was divided into pixels, each of which was numbered. [1] In turn, each pixel carries information about the intensity of the three color components: red, green and blue.
Least square method
OLS is to find such F(a,b)= ∑ni=1(yi–(axi+b))2 linear dependence coefficients at which the value of the function of two variables will be the smallest. In other words, for certain values of a and b, the sum of the squares of the deviations of the presented data from the resulting line will have a minimum value. [3] This is the meaning of the least squares method.
The main advantages and disadvantages of each method are presented in table 1.
Name of methods Advantages Disadvantages Principal Component Method – ease of implementation;
– low memory consumption for storing objects;
– ease of adding new trained figures.– very sensitive to light;
– sensitive to the angle of rotation of the object;Least square method – convenient to implement;
– the availability of mathematical conclusions– complexity of the computational procedure
– sensitivity of estimates to sharp emissionsObject Detection – works in the conditions of overlappings;
– Searches for all available instances of the object in a single pass.– the complexity of the algorithm is growing exponentially with an increase in the number of model parameters. In order to find out the appropriateness of using the described methods in the analysis system, a comparison was made in terms of recognition accuracy, processing time of one image, computational complexity and the size of the training sample.
Полученные результаты сравнения представлены в таблице 2.
The obtained comparison results are presented in table 2.
Method The volume of the training sample, pcs. Processing time for one image, ms Computational complexity Recognition accuracy Main components 29303 100 + ~80% Object Detection 26405 100 +++ ~85% Least square method 28140 100 + ~90% Note: the number of “+” signs indicates the degree of difference for the criterion.
Thus, the least squares method is much simpler when carrying out a computational procedure and gives good estimates with respect to statistical properties. This method is most suitable for the task.
In the process of studying existing methods, experimental studies were conducted to select the most effective method in terms of recognition accuracy.
Table 3 – Comparison of recognition methods
Method Name Advantages Disadvantages Watershed method Satisfactorily localizes the presence of a texture other than the background Excessive segmentation Normal Section Method Well localizes the presence of a texture different from the background. Good image presentation model Do not provide localization of objects. Does not highlight brightness changes and texture rotation. Long runtime Method for assessing changes in spectrum shape Satisfactorily provides localization of objects, localizes defects Does not localize defects caused by rotation Longer lead time 4. The principle of operation of radiological charts in radiation therapy
Radiation therapy is the directed use of radiation for the treatment of neoplasms and a number of non-tumor diseases. When irradiated, the death of diseased cells occurs, which stops the development of the disease. If left untreated, diseased cells can grow continuously, destroying healthy cells and spreading throughout the body. [6]
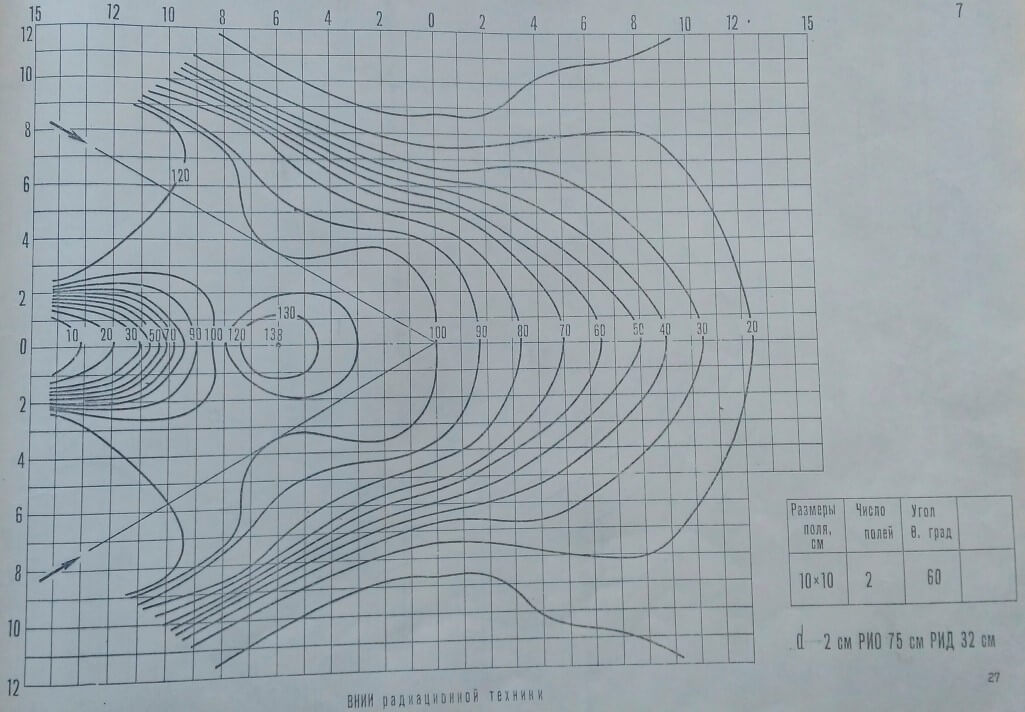
Image 1 – Example of a radiological chart
Irradiation is used to treat many types of tumors, and for many patients it is the only treatment they need. Radiation therapy can reduce pain, symptoms of compression of healthy organs, stop bleeding.
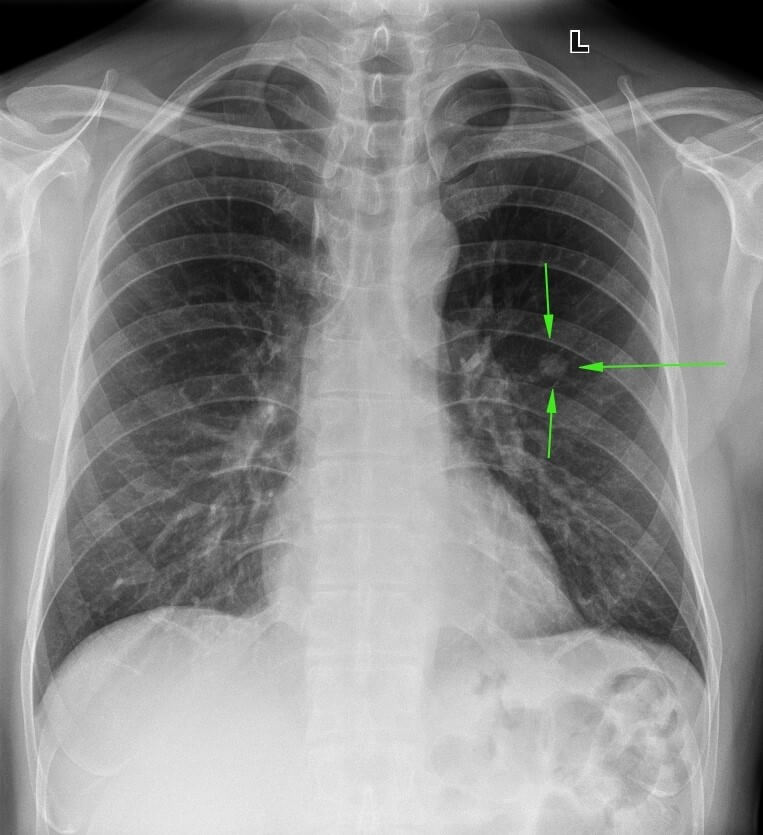
Image 2 – A picture with a focus of inflammation
The radiation source can be brought to the affected area in several ways, if the source:
• is located at a distance from the patient’s body – radiation is called remote;
• placed in any cavity - intracavitary;
• injected directly into the affected area in the form of fluid, wire, needles, probes, as well as fluid through the mouth, into vessels and cavities.
When planning treatment, a factor such as point radiation directly into the focus of the affected cells is involved. To minimize damage to healthy tissues, it is customary to use standardized radiological charts for the distribution of dosimetric radiation. Due to this, it becomes possible to minimize the damage caused by the device with a source to healthy tissues of a patient with cancer. [6]
Conclusions
At this stage of the master's work, a comparative analysis of the existing categories of methods for solving the problem, the advantages and disadvantages are identified. The directions in the solution of the recognition subtask are determined. During the study of the subject area, significant problems were identified that may arise during image processing, namely, the difficulty in the accuracy of selecting a map for the lesion to minimize damage to uninfected cells.
List of sources
1. Donoser, M. and Bischof, H. Efficient Maximally Stable Extremal Region (MSER) Tracking.
2. Anop MF, Katueva EV, Mihalichuk V.I. Particle swarm algorithms in the image processing problem // Science and Education. – 2015. – № 1.
3. Vodolazsky I. A., Egorov A. S., Krasnov A. V. Genetic algorithm and its most common methods of implementation.
4. Bay H., Ess A., Tuytelaars T., Van Gool L. Speeded-Up Robust Features (SURF) // Computer Vision and Image Understanding. June 2008. Vol. 110(3). P. 346-359.
5. Е.Е. Borisov, O.D Funko, On the task of finding an object in the image // Science and Education – 2014. – №2.
6. N.A. Lichman, N.G. Kukva, N.G. Semikoz Radation therapy of primary and mestatic tumors 2018.
7. Mimics Z [Electronic resource].
8. Planmeca Oy – Dental software – Planmeca Romexis [Electronic resource].
9. Implant-Assistant® [Electronic resource]
10. D.K. Kalinovsky, I.N. Matros-Taranets. Modern approaches to the diagnosis, treatment and rehabilitation of traumatologists using computer technology and telemedicine. Volume 7, No 1, 2009.
11. Algorithms for selecting contours of images [Electronic resource].