
Abstract
Content
- Introduction
- 1. Theme urgency
- 2. Alternative methods for solving the problem
- 3. Description of the task of improving image quality
- 4. Mathematical statement of the problem
- Conclusion
- References
Introduction
Computer image processing is relevant in any field of activity.
In computer image processing, problems such as image quality improvement, parameter measurement, image recognition, image compression, and image filtering and recovery are solved.
Some people who do not know how to use the software at the professional level usually find it difficult to choose photo editors or the necessary method of processing the image in such a way that the image is visually pleasant as a result. In addition, the very concept of image acceptability (quality) – often quite subjective and the meaning of evaluation criteria can differ significantly from user to user.
Therefore, it would be convenient to have a system that, based on the analysis of images that a user considers to be qualitative, calculates the average image quality criteria values for that user and, according to the obtained quality criteria values, performs pre-processing of the loaded image. It is possible to leave the user to completion
the image if necessary.
1. Theme urgency
Any form of information processing for which the input data is represented by an image, for example, photographs or video frames, is called image processing. Image processing can be carried out both for obtaining an output image (for example, preparation for printing reproduction, for broadcasting, etc.), and for obtaining other information.
The object of research is the image as a way of transmitting visual information. The study of images is based on their analysis and processing.
Image analysis involves the study of individual characteristics, components or individual objects with which the quality parameters of a given image are calculated. So, as a result of image analysis, we can distinguish a classification of approaches to their formation and storage: raster and vector graphics.
A digital raster image A(Y,X) is represented in a discrete two-dimensional space, consists of a certain number Y – the row number and X – the number of columns that form a certain grid, and the element at the intersection of the Yth row and Xth column, called pixel, contains a code that usually identifies the color.
Image processing, based on the processing of the corresponding signals, provides for the introduction of certain changes in the generated image compared to the original image, namely [1]:
- Change (distortion) of the image in order to achieve any effects (artistic improvement);
- Visual (noticeable by the eye) image quality improvement (brightness and contrast correction, color correction, etc.);
- Objective improvement in image quality (eliminating distortions such as distortion, blur, defocusing, sharpening, etc.);
- Image contouring – definition of individual images, selection of image contours
2. Alternative methods for solving the problem
In order to have different components working to achieve the goal of improving image quality and processing, it is proposed to create an integrated system, since most methods for image processing are already implemented and have open source code. In this system will be implemented using libraries and using API such processing methods as: Correction of exposure and contrast, adjustment of brightness and saturation, elimination of noise and blur, application of various filters and some similar methods.
Integrating processing methods means having functional subsystems and processing algorithms in the system to solve the problem of improving quality and achieving results in different ways, by applying different methods to the same data and by integrating the resulting output information.
In addition, a library of different images processed with different quality will be formed. The user will be able to select the image that best matches his or her views of the quality image. It will then be able to load its own image for processing, and it will be processed by the system according to the parameters that are set for the images selected by the user. If the result in something does not correspond to the user 's preferences, he will be able to adjust some parameters using the processing tools provided by the developed system.
3. Description of the task of improving image quality
As part of the master's work, the task was to improve the quality of images. At the same time, the concept of quality may differ for different images.
The task of improving image quality includes several subtasks:
- Image quality improvement
- Eliminate noise in images
- Amplifying useful and suppressing unwanted information
To accomplish this task, a set of multiple images will first be formed to which various processing methods are applied: correction of exposure and contrast, adjustment of brightness and saturation, etc.
Two approaches to image quality assessment are possible: quantitative evaluation using mathematical methods and subjective assessment based on expert assessments. In addition, they may be absolute or comparative.
It is necessary that the user, among the images presented before him, choose those that most satisfy his visual perception. That is, subjective evaluation is applied. The selected images calculate quality evaluation parameters that are typically affected by the applied processing methods, namely:
- Brightness – is a characteristic that determines how much the colors of an image differ from black. Brightness change is carried out by reducing or increasing the value of b of the each pixel in the same value, which leads to the fact that all elements of the correcting image are lighter or darker.
- Contrast is a characteristic of the difference in color saturation of its brightest and darkest areas.
- Sharpness – is the degree of blur of the boundary between adjacent portions of an image with different optical density (brightness).
In the next step, the user loads his image, which will be converted by various methods according to approximate average values of the found parameters.
4. Mathematical statement of the problem
Let the user choose the images that best match his perceptions of quality. It is necessary to assess the quality of ideal images, according to the user, by means of quantitative estimates.
1. To estimate the brightness of an image, the correct construction of a histogram of the brightness distribution of the image elements is used [2].
A histogram of a digital image with brightness levels in the range [0, L-1] is called a discrete function

where rk is the kth brightness level, аnd nk – is the number of pixels in the image with rk brightness.
Values of the normalized histogram will be calculated using the formula:

where k = [0, 1, ..., L–1].
p(rk) – estimation of the probability of occurrence of a pixel with a brightness value of rk
It can be noted that the sum of all values of the normalized histogram is one.
The horizontal axis of the histogram represents the values of brightness levels rk, and the vertical axis represents the values of the histogram h(rk) = nk or p(rk) = nk/n, if they are normalized.
On a dark image histogram, the nonzero levels are concentrated in the area of low (dark) brightness range values. Similarly, significant levels of the bright image histogram are offset to the top of the range. The low contrast image has a narrow histogram located near the center of the brightness range. The single color image is gray. The non-zero levels of the high contrast image histogram cover a wide portion of the brightness range. As a result, the image, whose element values distribution is close to uniform and occupies the entire range of possible brightness values, will look high-contrast and will contain a large number of halftones.
2. The ratio of mean-square deviation to the maximum possible brightness value is most universally used to estimate contrast [3].
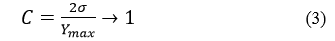
where σ – standard deviation,
Ymax – maximum brightness value.
C varies in the range 0≤C≤1, and its value should seek to 1 for best visual perception enhancement. A value of 0 corresponds to a single-color image and a value of 1 corresponds to a maximum contrast image.
3. To estimate the sharpness of an image, a two-dimensional Fourier spectrum excess measure is calculated.
Some steps are taken to determine the sharpness of the image.
In the first step, you need to select a rectangular area in the original image.
Next, you need to convert the selected area of interest into the frequency domain.
From the transformed obtained region, calculate a measure of the excess of the two-dimensional Fourier spectrum using the formula:

where μ2 – second central moment, μ4 – the fourth central moment, σ – standard deviation.
The measure of the excess is defined as the ratio of the fourth central moment and the square of the second central moment (standard deviation to the fourth degree). The result of the calculation should tend to the maximum value, since the sharper image corresponds to a large amount of excess.
Then, based on the above formulas for quality evaluation, for the case where the user has selected only one acceptable image, we obtain:
- for brightness the parameter Рideal(rk),
- for Сideal contrast,
- for sharpness γideal.
It is necessary to obtain a pre-processed image whose parameters are calculated in a similar manner to an acceptable image. At the same time, the difference between the values of the parameters of the quality image and the values of the parameters of the user image should strive to minimum:
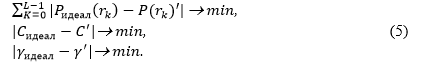
where Рideal(rk) – image brightness value,
Р(rk)' – probability value of brightness of the processed user image,
Сideal – image contrast ratio,
С' – contrast value of the processed user image,
γideal – image sharpness value,
γ' – sharpness value of the processed user image.
There is also an option that the user will choose several qualitative, in his opinion, images. In this case, it is necessary to find the quality evaluation values for each image according to the same given formulas that were used in the first case. Therefore, for each corresponding set of parameters of those satisfactory images, average values must be found.
4. To calculate the average brightness:

where Р(rk) – average brightness probability of high-quality images,
Pn(rk) – values of brightness probabilities of high-quality images,
n – number of all quality images.
k = [0; L–1]
5. For contrast:

where С – average contrast of high-quality images,
Сn – values for assessing the contrast of quality images,
6. For sharpness:

where γ – average sharpening quality images,
γn – sharpness values for high-quality images,
As a result, it is necessary to obtain an image with pre-processing, the parameters of which are also calculated according to the given formulas for quality assessment. In this case, the difference between the values of the averaged parameters and the values of the parameters of the user image should strive minimum:
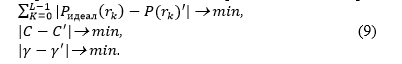
Thus, based on the above formula, the user will receive a final pre-processed image.
Conclusion
The study reviewed various image processing tools and technologies. The criteria for evaluating image quality are also considered. It is decided to create a system that will integrate different functional subsystems of image processing through API technology, applying different processing methods, and processing algorithms of different SDK libraries for web development will also be used. The task of improving the quality of images was formulated and described.
While writing this abstract, the master 's work has not yet been completed. Approximate completion date: June 2020. The full text of the work and materials on the topic can be obtained from the author or his manager after the specified date.
References
- Компьютерная обработка изображений. [Электронный ресурс] – Режим доступа: URL: http://aco.ifmo.ru/el_books/image_processing/1_01.html
- Методы обработки изображений: лабораторный практикум. В 2 ч. Ч. 1 / сост.: С. В. Воронов, А. Г. Ташлинский, И.В. Горбачев. – Ульяновск: УлГТУ, 2016. – 50 с.
- Критерии и методы укрупнённой оценки качества изображений в растровых графических форматах. [Электронный ресурс] – Режим доступа: URL: http://www.aiportal.ru/articles/other/evaluation-of-image-quality.html