
Summary of the topic of graduation work
Content
- Introduction
- 1. Actuality of theme
- 2. The purpose and objectives of the study, the planned results
- 3. Subject area analysis
- 3.1 Review of tools
- 3.2 Analysis of solution methods
- 3.3 Analysis of object detection methods
- 4. Scientific novelty and practical value
- Conclusions
- List of sources
Introduction
Many drivers are feeling tired or drowsy, and they are not even aware of their condition. Tracking dangerous driving behavior can help to alert drivers to their driving style and the risks involved, thereby reducing the percentage of careless driving and improving safe driving behavior on the road. The concept of "driving in half-sleep" may sound frivolous, but the number of accidents caused by the driver's falling asleep at the wheel takes more lives every year and leads to trauma. Driving while drowsy is as dangerous as driving while intoxicated, as evidenced by the analysis of the number of injuries and deaths resulting from driving. Whether the driver has fallen asleep at the wheel or has slowed down his reaction speed–all of this can equally lead to serious dangerous effects of drowsy driving.
1. Topicality of the topic
Advanced Driver Assistance Systems (ADAS) are designed to assist the driver in preventing or mitigating accidents. High-priority warning signals are provided by these systems to encourage alertness and timely and appropriate driver action in situations where there may or may be a direct risk of serious injury or loss of life.
The main modern technologies that make up ADAS systems:
All ADAS systems can be divided into two categories:
2. Purpose and objectives of the study, planned results
Goal setting
Not much work has been devoted to monitoring and controlling the image driver, so the topic is relevant. The main difficulty is that you can recognize the subject regardless of the angle of view and the lighting conditions when shooting. Also important is the limited functionality of mobile ADAS solutions, as they are unable to simultaneously track both driver behavior and vehicle traffic due to the fact that only one smartphone camera is used in the process.
The purpose of the study is to review methods of detecting, recognizing and tracking objects of the photographic order to improve the safety of drivers and passengers of the vehicle. In this case, the object means the identity of the driver. The solution to the task of monitoring the condition of the driver consists of several steps. Figure 1 presents the basic steps of processing a photographic order.
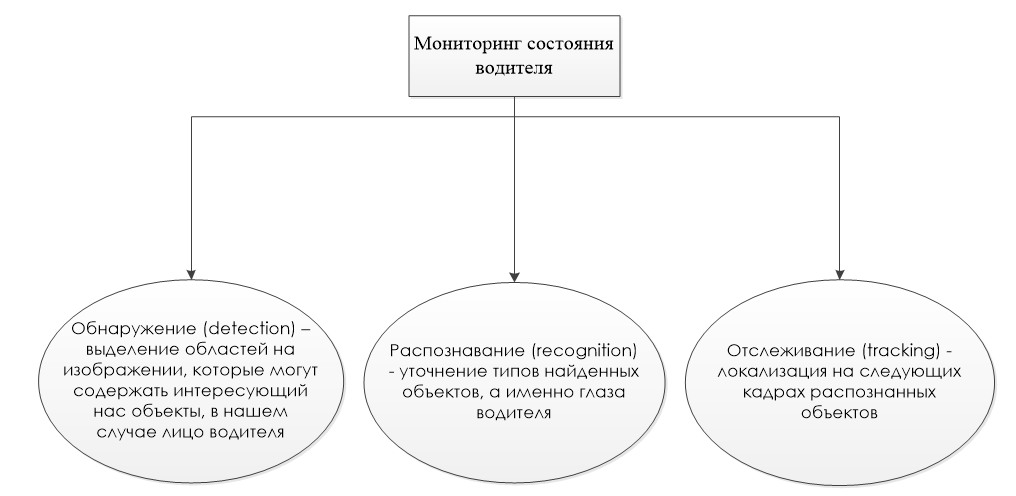
Figure 1–The basic steps of processing a photo series for the task of monitoring and controlling driver fatigue
Detect and Recognize Objects in a Frame
First of all, after receiving the next frame, you need to select objects of interest, namely the driver's identity, and then specify the type of object found. categorical recognition, etc., for further analysis, the following groups of methods were identified: based on pattern mapping and feature based.
Detecting objects using the pattern search method
This method group works by the following principle: two components are required–the original image and the template image. To determine such a plot, you need to overlay the pattern and move it pixel-wise, from left to right, from top to bottom. Each position calculates a metric that shows whether the pictures match or not. For each position of the metric template is entered in the resultant matrix R. Each position (x, y) in R contains a match metric. At the end of the comparison, the best matches are in the global lows (using the least squares method) or the highs (using the correlation method or the cross-correlation method). This group of methods is well-used in the analysis of scenes in which the camera is static, and all the copies of the searched objects look the same. In practice, this leads to the following problems: in case of changing the shooting angle, the overlap immediately shows unstable operation of the method.
Categorical Object Recognition
In order to avoid the problems described above, it was decided to use an alternative approach, namely to find individuals using a trained classifier. The use of the classifier involves the selection of some characteristic features in the image, the machine training of the classifier on a set of positive and negative samples, which are consciously present or absent objects of the desired class, and the use of the classifier in the next image to find objects on it. Among the most popular methods of this group are the following: Viola-Jones method, the main components, Huff transformation.
The process of determining drowsiness
The existing hardware and software complexes evaluate the functional state of the person using one of the following methods: electroencephalography, analysis of cardiac activity, head movements, response time to the stimulus, electrodermal activity, eye movements, blinking, measurement of the fraction of time during which the eyelids are partially closed by estimates observer (PERCLOS). PERCLOS (PERcentage of eye CLOSure) is the fraction of time during which the driver's eyelids are partially closed by an observer or an appropriate application.However, the effectiveness of such systems is still small. The reason for this is insufficiently developed physiological and behavioral criteria, based on which can be recognized dangerous for the driver state, problems with the registration of biological signals, problems with ergonomics and usability, closed algorithms, lack of information exchange in the developer environment, as well as the simple unwillingness of drivers controls.
The most promising in terms of ease of use, signal quality and informativeness of the recorded parameters is the method of analysis of oculomotor reactions. In this work we used the method of video-eye (tracking-eye), which combines all these advantages. You may find the following physiological signs that measure the inattention, fatigue or drowsiness of the TK driver: the proportion of time that the eyes are closed (PERCLOS), yawning, nodding, blinking frequency, blinking speed.
The criterion for drowsiness is a condition where the eyes are closed more than 80% per minute. If the percentage of eye closure exceeds 80% within a minute, then the person is considered as drowsy.Sleepiness is a feeling of fatigue and "blindness" that results from a sleep disturbance and is accompanied by a constant or periodic desire to fall asleep during a non-sleep setting. Excessive drowsiness reduces alertness. The speed of reaction slows down, complicates decision making, and reduces attention, memory, and coordination of movements. One of the hallmarks of drowsiness is the moment when the driver "pins his nose", that is, it becomes difficult for him to keep his head in a normal position. When fatigue or drowsiness develop, the eyes may become longer and slower, and (or) the frequency of blinking may vary, and (or) when blinking, the eyelids may begin to drop with a small amplitude, for example, until the eyes begin to close to short-term "microbases", ie sleep states that last for about 3-5 seconds or longer, or to long sleep.
Generalized Scheme of System Operation
The driver fatigue monitoring and control subsystem consists of three modules:
- The driver's face detection module in the frame.
- Key recognition eye module.
- Face tracking module in the following frames.
The input information for such a system is a sequence of photos taken at a certain frequency. The driver detection algorithm is applied to each of them. After receiving the frame area with an object, it is necessary to compare the key features of the resulting object with those in the database. As a result, we get a confirmation or refutation of the "this person" statement. In the absence of matches, write the new feature vector in the database. Then the tracking of the position of the driver's eye is detected and checked for fatigue using the available methods. A generic diagram of the driver fatigue monitoring and control subsystem is shown in Figure 2.
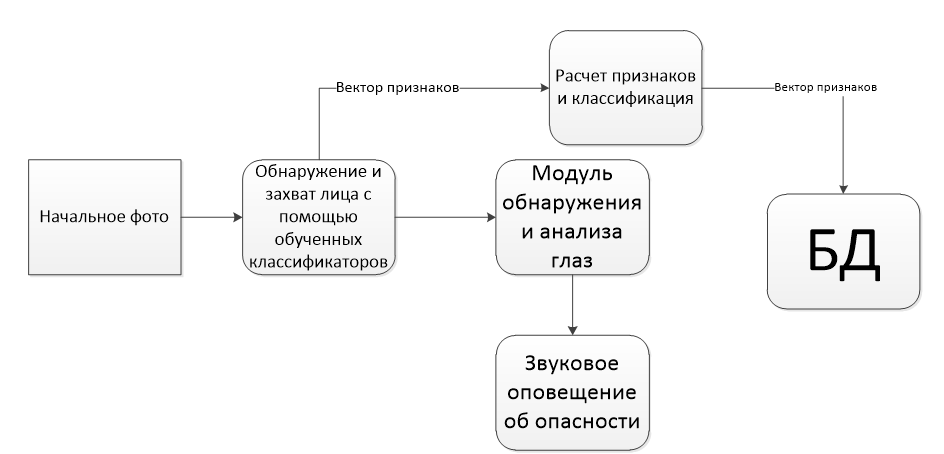
Figure 2–Generalized diagram of the driver fatigue monitoring and control subsystem
3. Domain Analysis
Many drivers are feeling tired or drowsy, and they are not even aware of their condition. Tracking dangerous driving behavior can help to alert drivers to their driving style and the risks involved, thereby reducing the percentage of careless driving and improving safe driving behavior on the road. The concept of "driving in half-sleep" may sound frivolous, but the number of accidents caused by falling asleep at the driver's wheel, every year, takes more lives and leads to injury. Driving while drowsy is as dangerous as driving while intoxicated, as evidenced by the analysis of the number of injuries and deaths resulting from driving. Whether the driver has fallen asleep at the wheel or has slowed down his reaction speed–all of this can equally lead to serious dangerous effects of drowsy driving.
Advanced Driver Assistance Systems (ADAS) are designed to assist the driver in preventing or mitigating accidents. High-priority warning signals are provided by these systems to stimulate alertness and timely and appropriate driver action in situations where there may or may be a direct risk of serious injury or loss of life.
All ADAS systems can be divided into two categories:
There are a number of different solutions available in the ADAS market. The following disadvantages of integrated ADAS systems can be noted:
3.1 Tools Overview
Due to the novelty of research in the subject area, in the process of software market research, only one software product was found, similar in functionality to that considered in the framework of the master's work of the system.
One of the most popular mobile applications in the field of ADAS systems is the iOnRoad3 solution. The app uses a rear camera, sensors and sensors built into the smartphone to detect ahead of driving cars and alert the driver in the event of an emergency. This system captures objects in front of the driver in real time, calculating the current speed using sensors. When approaching, an audible and graphical collision warning pops up, allowing the driver to slow down in a timely manner.
Mobile applications, in turn, have their drawbacks. The main thing is that mobile ADAS solutions are not able to track both the behavior of the driver and the movement of vehicles, and in such applications only one of the cameras available on the smartphone is used. Thus, mobile ADAS solutions do not take into account the full spectrum of dangerous road situations that a driver of a vehicle may encounter.In addition, in such mobile solutions, all intensive calculations for image and road processing and analysis are performed only on the driver's smartphone, which may not always be acceptable due to the limited resources of mobile devices. Thus, the deployment and execution of mobile application processes is not presented in a cloud environment.
Figure 3–Example of ADAS system operation
3.2 Analysis of Solution Methods
Considering the tasks of monitoring and controlling the fatigue of the driver, it can be divided into three sub-tasks: detection, recognition and tracking.
- detection–the selection of areas in the image that may contain objects of interest to us, in our case the driver;
- tracking–localization on the following frames of recognized objects.
There are two ways to track a driver's face in a photo. The first is the detection of an object in each frame and the second is the support through detection in the first frame, that is, the object is allocated, recognized and further monitored in each subsequent frame. This method is computationally efficient, unlike the first, where you have to look for objects in each frame, which results in a significant computational load on the system.
Analysis of Object Detection Methods
1. One possible approach to solving the object search problem is to use machine learning algorithms to construct models of object classes (human, motorcycle, plane, car, bus, etc.) and output algorithms to determine the position of objects. objects in the image.
Building a model consists of two steps:
Finding objects based on a template implies that there is an object image–a template–and a test image that is mapped to that template. In the simplest case, the matrix of the intensities of the colors most characteristic of the object can act as a template. More sophisticated methods of this group use as a template the sets of feature vectors (descriptors), geometric representation of the object or probabilistic models of objects, which contain information about the distribution of pixel intensities. Matching with a template involves comparing test and template descriptions by some metric selected–usually Euclidean distance, norm L1, weighted quadratic error convolution, or correlation.
Scientific Novelty and Practical Value
The scientific novelty is, first of all, that the object of the study, which is the model of definition of the face and eye selection, is taken for the study, which adds complexity in the study of the subject area. In the course of the study of the subject area, various materials were collected for further analysis and the choice of the direction of their own research. The complexity of the study lies primarily in the instability of most algorithms for face recognition, namely the complexity of their recognition at slight turns and slopes. On the basis of the studied materials, the mathematical formulation of the object detection problem was formulated.
Based on the review, it was decided to use the method of categorical recognition of objects in the image. At the moment, the Viola-Jones method introduced in 2001 is the most popular because of its high speed and efficiency.
The basic principles of the Viola-Jones method are:
Method Specifications:
The principles of Viola-Jones are based on Haar primitives. In the original version of the algorithm, only non-rotated primitives were used, and the attribute value was calculated as the simple difference between the sum of the pixel brightness in the sub-sectors. In the future, primitives with a slope of 45 degrees and asymmetrical configurations were proposed. Instead of calculating the simple difference, it was suggested to attribute a specific political value to each subarea and to calculate the value of the trait as a weighted sum of pixels of different areas. The signs are calculated within a moving image of a scalable window.
The calculated value of such an indicator would be: F = X-Y
where X is the sum of the brightness values of the dots that cover the light part of the feature, and Y is the sum of the brightness values of the dots that close the dark part of the feature.
Summed Area Table (SAT) is used to calculate them: the sum of all pixels to the left and above is recorded in each pixel of the image.
The Viola-Jones algorithm uses the so-called Boosting, a set of methods that help to improve the accuracy of analytical models or to strengthen "weak" models. It is a procedure of sequentially constructing a composition of machine learning algorithms, when each successive algorithm seeks to compensate for the disadvantages of the composition of all previous ones. In this case, the AdaBoost algorithm is used.
The Viola-Jones method uses a cascading model of strong classifiers. It is a decision tree where each node is built to detect all images that interest and reject areas that are not images.
The cascade is governed by the following rules:
simple classifiers;
For the object tracking task, it was customary to use a Kalman filter to obtain the probable positions of previously found objects in a new frame based on the history of its previous positions.
The main features of this algorithm:
The master's work is not yet complete when writing this essay. Final Completion: April 2020. Full text of the work and subject matter may be obtained from the author or his supervisor after the specified date.
List of sources
- Culjak I., Abram D., Pribanic T., Dzapo H., Cifrek M. A brief introduction // 2012 Proceedings of the 35th International Convention MIPRO. Opatija, Croatia. 2012. P. 1725-1730.
- Kalman R.E. A new approach to linear filtering and prediction problems // Journal of Basic Engineering, Vol. 82(1), 1960. P. 35-45.
- Cristianini N., Shawe-Taylor J. An Introduction to Support Vector Machines and Other Kernel based Learning Methods. New York: Cambridge University Press, 2000.
- Dalal N., Triggs B. Histograms of oriented gradients for human detection // Proceedings of the IEEE Computer Society Conference on Computer Vision and Pattern Recognition. 2005. Vol. 1. P. 886-893.
- Amos B., Ludwiczuk B., Satyanarayanan M. Openface: A general-purpose face recognition library with mobile applications, CMU School of Computer Science, Pittsburgh, Pennsylvania, United States, CMU-CS-16-118, 2016.
- Viola P., Jones M. Rapid Object Detection using a Boosted Cascade of Simple Features // Proceedings of the IEEE Computer Society Conference on Computer Vision and Pattern Recognition. Kaiai, Hawaii, USA. 2001. Vol. 1. P. 511-518.
- Bay H., Ess A., Tuytelaars T., Van Gool L. Speeded-Up Robust Features (SURF) // Computer Vision and Image Understanding. June 2008. Vol. 110(3). P. 346-359.