Conference Paper · March 2009
DOI: 10.1109/ROBIO.2009.4913155 · Source: IEEE Xplore
CITATIONS
READS
35
4,663
5 authors, including:
205 PUBLICATIONS
3,870 CITATIONS
66 PUBLICATIONS
1,833 CITATIONS
Some of the authors of this publication are also working on these related projects:
The user has requested enhancement of the downloaded file.
Proceedings of the 2008 IEEE
International Conference on Robotics and Biomimetics
Bangkok, Thailand, February 21–26, 2009
Driver Fatigue Detection System
E. Rogado, J.L. García, R. Barea, L.M. Bergasa, Member IEEE and E. López
Abstract—Abstract–This paper presents a method for
II.
FATIGUE DETECTION DURING DRIVING
detecting the early signs of fatigue/drowsiness during driving.
Analysing some biological and environmental variables, it is
The fatigue/inattention/drowsiness are very vague
possible to detect the loss of alertness prior to the driver falling
concepts. These terms refers a loss of alertness of vigilance
asleep. As a result of this analysis, the system will determine if
while driving. Indicators of fatigue can be found in [1].
the subject is able to drive. Heart rate variability
(HRV),
steering-wheel grip pressure, as well as temperature difference
A. Visual Features
between the inside and outside of the vehicle, make possible to
There is an important quantity of studies related with
estimate in an indirect way the driver’s fatigue level. A
this area [2]. Most of them are based on facial recognition
hardware system has been developed to acquire and process
these variables, as well as an algorithm to detect beats and
systems to determine the position of the driver’s head, the
calculate the HRV taking into account the others aspects
frequency of blinking, etc.
mentioned before.
This frequency and the degree of eyelid opening are
good indicators of tiredness level [3]. In a normal situation,
Index Terms
- ECG, HRV, Inattention, Fatigue,
driver blinks and moves the eyes quickly and constantly,
Drowsiness.
keeping a large space between eyelids. In a sleepy state, we
can appreciate that the speed of blinking and the opening
I. INTRODUCTION1
decrease.
Based on researches done by the Real Automóvil Club
With regard to the driver’s head angle in a normal
de España
(RACE), driver drowsiness involves a high
situation, he maintains a lifted up position and only does the
percentage (30%) of traffic accidents.
typical movements related to the driving. Passing into a
This is a complex phenomenon that implies a decrease
drowsy state implies to nod off as well as a more frequent
in alerts and conscious levels of the driver. It is no possible
head’s position change. In fact, when it is a deep stage, the
measure it up with directs methods, but it can derive from
nodding off is extremely slow and the head keeps itself
visuals features
(movements, expressions) or no visuals
completely relaxing [4].
(physiological variables like HRV, brain activity, etcetera).
Other research lines are centered in the analysis about
Being able to detect driver’s state in each moment and
facial expression. In general, people are prone to have
using this information in a driver-vehicle system, may lead
different expression depending on the alert level that show
to the development of a more intelligent driver assistance
[5].
system which will prevent car accidents.
B. Non-visual Features
The objective of this study will be design a non-
Driver’s concentration can be affected by
invasive system which could monitor the indoor
environmental factors, therefore it would be interesting to
environmental conditions as well as the driver, in order to
sensorize the cabin. Diverse studies analyze the
determine the alert and attention levels. The biological data,
concentration of carbon monoxide and oxygen in air. An
which was acquired by different sensors, will be stored,
intelligent gas sensing system offers an added security in the
processed and evaluated on real time by a system capable to
vehicle, warning when the concentration is higher than
detect the early signs of fatigue, since the physiological
tolerable levels (CO of 30 ppm and oxygen levels below
variables are intimately related to this phenomenon.
19.5%) [6].
This paper describes the system used for detecting the
Other non-visual features are physiological variables.
fatigue during driving in section II. The general architecture
Galvanic skin response
(GSR) and the conductivity are
(hardware and software) of the system implemented in
relation to the psychological state of the person
[7].
section III and IV. In section V same results with
Gripping force gives us an idea about driver’s attention
professional driver are showed. Section V shows conclusion
level, and body temperature is an important physiological
and future works for detecting the driver fatigue state during
parameter that depends on driver’s state too: body
driving.
temperature increases due to infections, fever, etc. reflecting
the autonomic responses and the activity of a human’s
The authors want to express their gratitude to the Education and Science
autonomic nervous system [8]. Electroencephalogram gives
Ministry and to the Madrid Community and to the University of Alcala
a lot psychophysiological information about stress state,
because of financing the projects "Cabina inteligente para el transporte en
drowsiness or emotional reactions [9].
carretera" (PSE-370100-2007-2) and SLAM-MULEX (CCG07-UAH /DPI-
Nevertheless, electrocardiogram and heart rate
1736).
variability are ones of the most important variables. In fact,
978-1-4244-2679-9/08/$25.00 ©2008 IEEE
1105
power spectrum can be calculated as a Fourier discrete
transform of the HRV, and, knowing the relation between
the person’s state and his/her spectrum, determine the
driver’s psychophysiological conditions. The parameters of
interest are the total power (from 0.03 to 0.4 hertz), low
frequency power
(from
0.05 to
0.15 hertz) and high
frequency power (from 0.15 to 0.4 hertz) [10].
The acquisition of the HRV has been made amplifying
and filtering an ECG signal, with the purpose of detecting to
QRS complex and calculating the time between consecutive
R waves. When the separation between R waves is
obtained, this could be represented in function of the beat
graphically. In our case, it is interesting to calculate the
histogram and the frequency response. The heart rate
Fig. 1 Analog subsystem.
variability gives us some information about the respiratory
system (increase in respiration and decrease in exhaling),
Some piezoresistive force sensors FlexiForce [12] are
vasomotor system, temperature changes
(causes little
used to measure a voltage which is proportional to the
changes in HRV) and central nervous system, that is in
applied force. Using an appropriate electronic that the
direct relation with the person’s emotional state.
manufacturer prescribes us, we can get a signal which is
Finally, not only physic but also mental state can
limited between zero and five volt that will be acquired by
influence in the way of driving. The biggest automakers
the ADC of the microcontroller. Electronics were adjusted
focus their efforts in this direction. Citroen has elaborated a
to achieve an adequate sensitivity level for our necessities.
system that detects the step of a line
(continuous or
Thus, when the driver is holding the steering-wheel, the
discontinuous) when the indicator has not been activated
resulting voltage is higher than the established threshold
[11]. Moreover, abrupt direction changes, variations in the
previously.
way of the brake or in the driver’s body position (evaluated
Electrocardiographical signal is gotten by ECG
through pressure sensors in the seat) are others relevant
electrodes, a circuit based on a precision instrumentation
parameters to take into account for the analysis of the
amplifier INA114 and a band-pass filter to remove both
driver’s alert state.
high frequency and continuous component. Next, adaptation
electronics were added to set the signal inside the dynamic
III. HARDWARE IMPLEMENTATION
range of the ADC.
Although the pulse could be calculated by the ECG
It is necessary an adequate hardware to obtain the
signal, other possibility has been added to receive this pulse
biological variables that the algorithm needs for its
signal using a commercial cardiothoracic belt utilized by
processing.
sportsmen. To make this possible, a receiver has been
The developed system is made up of an analogical
implemented to work at the same frequency that the belt
subsystem and other digital. The first one of them does an
emits (5 kHz). Its circuit is made up of an amplifier and a
adaptation of the signal to acquire it through an analogical
band-pass filter. When cardiothoracic belt detects a pulse, it
to digital converter. The second one filters and processes the
emits a sinusoidal wave at
5 kHz. The microcontroller
resulting signal that it was gotten in the analogical phase.
detects this sinusoid, and therefore the pulse, and is able to
Furthermore, the digital system is able to send information
calculate the HRV directly.
in a wireless way using bluetooth or zigbee.
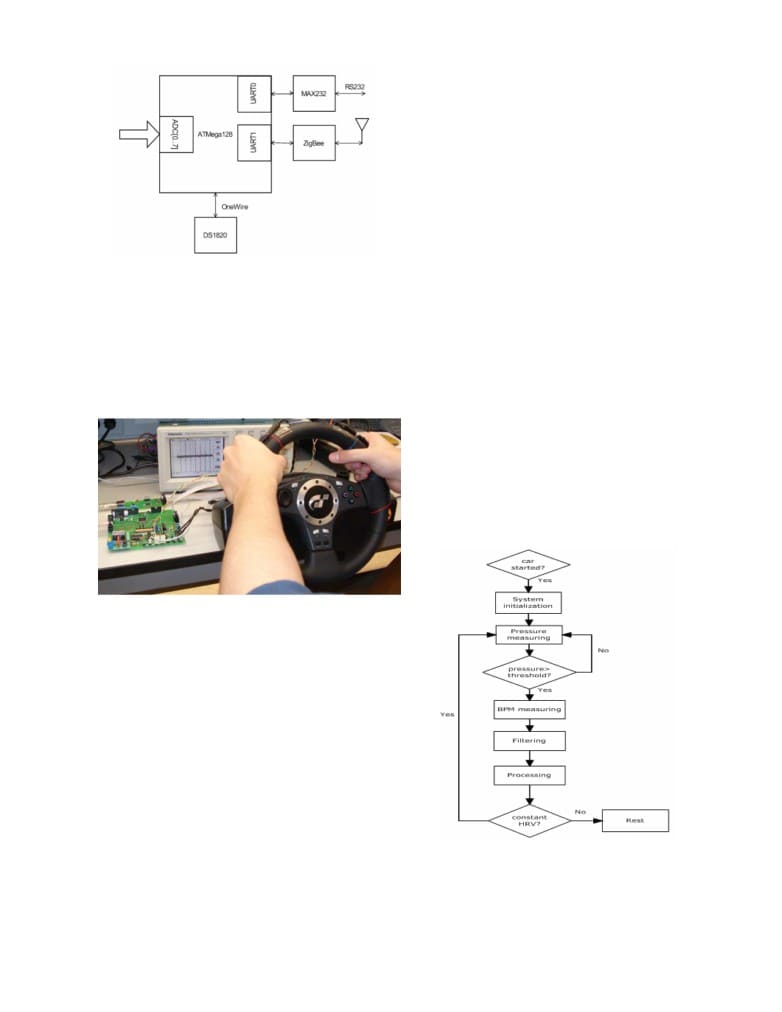
B. Digital Subsystem
A. Analog Subsystem
Digital system acquires the signals of the analogical to
This subsystem the pressure that driver exerts over the
digital converter and processes them according to the
steering-wheel of the vehicle, the electrocardiographical
developed algorithm. This system is based on an Atmel
signal coming from some ECG electrodes, as well as the
ATMega128 microcontroller that has eight channels of
pulse through a commercial cardiothoracic belt (figure 1).
high-accuracy
10 bit A/D Converter and high-speed
program execution
(16 MHz) that is enough for the
application. Figure 2 shows this subsystem.
1106
Nowadays, mostly cars offers this data
(steering-wheel
angle) by means on-board computer using a CAN bus.
IV. SOFTWARE IMPLEMENTATION
Our system uses two types of software: one for the
microcontroller ATmega128, and another one for the
computer with a wireless link among both devices using
bluetooth or zigbee.
In a global way, in figure 4 the flow diagram of the
complete application is shown. The software has been
implemented to carry out the following realtime functions:
1) Signals acquisition coming from the sensors.
Fig. 2 Digital system. It is the one that receives the analogical signals, to
2) Signals filtering.
digitize and process them. It also obtains temperature information and it has
3) Signals processing.
wireless communication capabilities.
4) Analysis of the results in a combined way to detect the
first symptoms of fatigue.
Microcontroller can communicate using the serial port
The pulse measuring stage is very important for the
(RS232) or using a Bluetooth or Zigbee wireless module in
HRV calculation that is the main parameter in which our
order to send the results of the processing to a central
study is based. Hence, and as we already mention
system or debug the system during the execution.
previously, we use two different methods to detect the beats
Indoor and outdoor temperature is measured by a
with in order to implement a more robust algorithm that,
DS1820 one-wire digital temperature sensor from Maxim.
before any unexpected event, allow to detect those
Figure 3 shows the system implemented.
correctly. The algorithm is based on a dynamic threshold
since the QRS complexes cannot present the same
amplitude in different people [13]. Previously, it has been
necessary to filter the obtained signal with a pass band
digital filter and to derive the filtered signal. The result is
squared obtaining a significant peak for each QRS complex.
Also, to develop the algorithms and the study in a
comfortable way has been used LabWindows with an
acquisition card PCI-6014 of National Instruments.
Fig. 3. Implemented system running. In the steering wheel there are two
ECG electrodes and the presure sensors connected to the hardware.
C. Acquisition Card
To perform the test in the laboratory, a National
Instruments LabWindows Real-Time target
(PCI-6014)
connected with the analogical subsystem and a Logitech
commercial steering-wheel has been used. Both
electrocardiographical and pressure sensors has been
situated over the steering-wheel which may detect the angle
of the same thanks to the electronic integrated on it. If the
steering-wheel is connected by USB, different movements
and keystrokes of the button can be detected using the
appropriate driver of LabWindows. Its precision is about
one tenth of degree. The measurement of the position of the
steering-wheel provides other variable that can be used to
detect changes in the driver’s behavior as a consequence of
Fig. 4 Software’s flow diagram
a sleepy state. Referring to a real car, it could use an
encoder or an angle sensor with enough precision.
1107
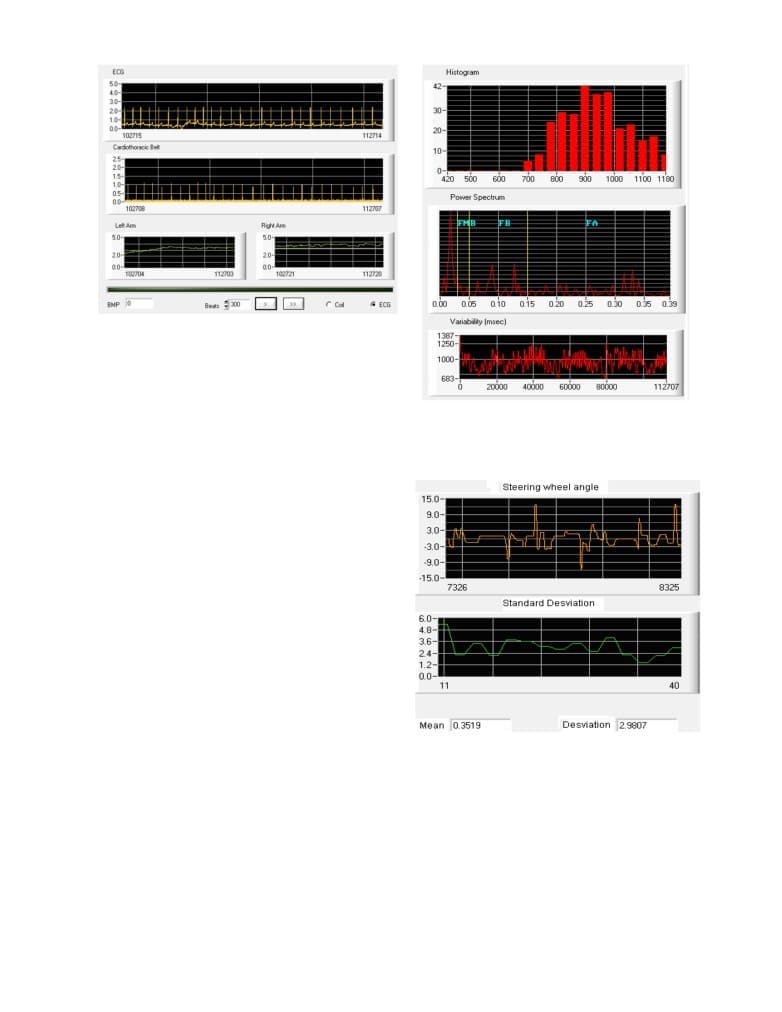
Fig. 5. Pulse detection detail using the software’s graphical interface
implemented in LabWindows. Top image shows the signal captured
through the ECG electrodes. Under it, signal of a commercial
cardiothoracic belt is shown. Finally, the signals obtained from the presure
sensors are observed.
The captured signals and the results obtained are stored
in the PC’s hard disk for their later study. To evaluate the
driver's state in each moment, our algorithm combines the
Fig. 6. HRV analysis using LabWindows. Top image is the fellow’s HRV
histogram obtained during the driving. Below power spectrum and heart
information about the physiologic parameters to offer the
rate variability are shown.
most appropriate decision considering the existent
relationship among the different indicators.
Using the HRV signal we study the frequency response.
It is carried out an interpolation over those calculated HRV
values. With the interpolated signal statistical and spectral
indexes are calculated. The statistical ones are calculated
directly using the interpolated signal and they are the mean,
the variance and the root mean square. The spectral ones are
obtained using the power spectrum calculated using a FFT.
The interest parameters are the total power (from 0.03-0.4
Hz), the very low frequencies power (VLF, from 0.03-0.05),
the low frequencies power (LF, from 0.05-0.15), the high
frequency power (HF, from 0.15-0.4) and the relationship
between LF and HF (Fig. 6).
The steering wheel position is obtained using a
LabWindows’s driver for a Logitech’s commercial steering
wheel. In our case it’s necessary to detect the angle,
carrying out it with a precision to tenths of a degree. The
position is sampled every 0.05 seconds and it’s stored in a
file. Also, each
200 samples the mean and the typical
deviation of the steering wheel angle are calculated. The
Fig. 7. Detection of the steering wheel movements.
objective is to detect an important variation in the typical
deviation (figure 7).
Also, to simulate a conduction environment in the
laboratory a small game has been created, controlled with
the steering wheel, in which objects that appears in the
screen should be dodged. In this way we can detect the
driver's normal variability during a normal conduction state
and compare it with the one that we obtain of the same
driver when it suffers drowsiness (Fig. 8).
1108
Fig. 9 HRV examples under extreme fatigue conditions.
In the carried out tests, when the person is in an alert
state, HRV oscillates showing the sinusal frequency (more
or less), but when one gives the first nod off (first symptom
of the drowsiness) HRV falls abruptly maintaining its value
Fig. 8. Driving simulation.
constant during about 10 beats approximately. Calculating
the HRV frequency, it’s observed that, after this nod off, the
V. RESULTS
value of the frequency it’s higher to their previous medium
value. This fact can be appreciated in figure 10. When these
With the simulation system installed in a laboratory we
two conditions take place simultaneously, then we could
are carrying out tests on people with a healthy heart in a
affirm that there are appearing the first symptoms of fatigue.
comfortable environment to get to sleep. The final system
that we are using at the laboratory uses LabWindows to take
samples of the pressure exercised on the steering wheel by
each hand, of the electrocardiogram signal (both of them:
the one obtained using the sensors located in the steering
wheel and the one obtained by the commercial
cardiothoracic belt) and of the steering wheel position every
0.05 seconds.
The system, besides storing the samples for their later
study, also has the capacity to analyze them presenting in
graphic the signals that are being obtained as well as the
power spectrum and the HRV signal histogram, and the
mean and typical deviation of the steering wheel position.
In figure 9 can be observed the HRV captured for the
same person under conditions of extreme fatigue (24 hours
without sleeping) and in different days. The test consists on
placing the user on the simulator and to try that this falls
asleep driving. In HRV 1 and 2 the driver falls asleep
Fig. 10. HRV examples under extreme fatigue conditions with sleep attack
although he wakes up immediately. In HRV 3 the driver
and yawns (doze).
doesn't fall asleep although due the fatigue he yawns
continually.
If the driver is awake and attentive, abrupt changes in
Using the captured files and after the analysis of that
HRV mentioned previously are nonexistent. In fact, in the
ones we could affirm that, in the case of a tired person,
figure
11 can be observed perfectly that, although takes
certain HRV variations belong together with the first
place a HRV slight fall that stays constant during some
drowsiness symptoms. As we relax ourselves, HRV
samples, the frequency has a little variation respect to their
increases
(pulsations diminish). When the first nod off
medium value.
happen a considerable drop of the HRV takes place. In
Although it is certain that with the exposed examples it
figure 10 can be observed that the HRV slope is growing,
seems that with HRV one can deduce when the driver will
what it means that the driver is relaxed and that’s involve a
fall asleep, this it is not this way due to their variability. The
possible situation of danger in the highway.
previous results had been obtained in situations of rest and
1109
total silence, but in later studies with people that have
studied the HRV variability during the conduction and to
driven maintaining a conversation, laughing, etc, we have
account for this information, combining it with others to be
obtained very similar results to those gotten in the
able to evaluate the driver's state.
drowsiness case, the main difference is that in these cases an
In systems which are based on the study of the heart rate
HRV increase is not detected and therefore the person is not
variability, in the power spectrum and in the histogram, it is
in the relaxation phase next to the sleepy state (Fig. 12).
necessary a minimum number of samples to obtain valid
results. Hence, it is required to obtain a minimum number of
beats before considering these data as valid. That requires a
minimum time before the obtained results are reliable.
Our objective is to combine this information with visual
information and with the driving environment
(road
conditions, climate, etc) to detect the drowsiness during the
conduction and in this way to reduce the risks and dangers
Fig. 11 Relaxed person's HRV.
for the drivers.
These systems are not only useful for the driver's
security also they are the base to develop register devices
that make easy the reconstruction and investigation of
accidents storing driving related data, state of the driver and
driving environment.
REFERENCES
Fig. 12 An awake driver’s HRV analysis. The driver is speaking.
[1]
R. Bittner, K. Hána, L. Poušek, P. Smrka, P. Schreib and P. Vysoký,
Detecting of Fatigue States of a Car Driver, ISMDA 2000, LNCS
At the moment we are working in developing new
1933, pp. 260-274, 2000.
algorithms that allow us to determine the user's state and to
[2]
G. Scharenbroch, Safety vehicles using adaptive interface technology
consider HRV like a valid signal to determine the driver's
(SAVE-IT) (Task 10): Technology review. Delphi electronics and
state. We are comparing our results with other obtained by
safety systems Tech. Rep., 2005
[3]
Qiang Ji, Zhiwei Zhu, y Peilin Lan: Real-Time Nonintrusive
means of PERCLOS (Percent Eye Closure) and others
Monitoring and Prediction of Driver Fatigue. IEEE Transactions on
based on actions carried out by the driver (steering wheel
Vehicular Technology, vol. 53, nº. 4, July 2004.
angle). For it, is made use of the simulator developed inside
[4]
Mai Suzuki, Nozomi Yamamoto, Osami Yamamoto, Tomoaki
the CABINTEC project that models a truck head (Fig. 13).
Nakano, y Shin Yamamoto: Measurement of Driver's Consciousness
by Image Processing-A Method for Presuming Driver's Drowsiness
by Eye-Blinks coping with Individual Differences
-
2006 IEEE
International Conference onSystems, Man, and Cybernetics
[5]
Haisong Gu, Qiang Ji†, Zhiwei Zhu: Active Facial Tracking for
Fatigue Detection. Applications of Computer Vision, 2002. (WACV
2002)
[6]
Galatsis, K.; Wlodarski, W.; Li, Y.X.; Kalantar-zadeh, K.: Vehicle
cabin air quality monitor using gas sensors for improved safety.
Optoelectronic and Microelectronic Materials and Devices, 2000.
COMMAD
2000.
Proceedings
Conference
on
Volume , Issue , 2000 Page(s): 65–68
[7]
F. Nasoz, O. Ozyer, C. L. Lisetti, and N. Finkelstein, “Multimodal
affective driver interfaces for future cars,” in Proc. ACM Int.
Multimedia Conf. Exhibition, 2002, pp. 319-322.
[8]
Axisa, F. Dittmar, A. Delhomme, G. : Smart clothes for the
monitoring in real time and conditions of physiological, emotional
and sensorial reactions of human. Microcapteurs et Microsyst.
Biomedicaux, INSA Lyon, Villeurbanne, France;
[9]
Lin, Y.Leng, H. Yang, G. Cai, H.: An Intelligent Noninvasive Sensor
for Driver Pulse Wave Measurement. Sensors Journal, IEEE
[10]
Claudia Lerma González, Oscar Infante Vázquez y Marco V. José:
Fig. 13. Trunk simulator.
Sistema de Análisis de la Variabilidad de la Frecuencia Cardiaca.
[11]
ECURITY/AFIL/AFIL.htm
VI. CONCLUSION
[12]
[13]
Serhiy Matviyenko: Low-cost EKG Pulsometer. CYPRESS
Most of the systems designed to detect the driver's state
Application note
are based on the study of visual facts (eyes movement, head
movement, facial expression) or non visual facts (HRV,
ECG, pressure exercised over the steering wheel, relative
humidity, etc). Detecting the fatigue with a single
physiological parameter is not possible, becoming necessary
the study of diverse variables. In this work we have been
1110