Аннотация
A.Y. Kharitonov, A.B. Birukov, A.B. Peresekin, S.P. Barkov. Mathematical modeling of heat state of oven lining during conditions of forced furnace stand–by in LabVIEW. The actual problem of heat losing during the process of furnace lining is considered and the method of sufficient precision to predict thermal state of furnace lining is developed. For visual and dynamic diagnostics the mathematical modeling of thermal state of furnace lining is used, which was programmed in LabVIEW environment.
Relevance
The loss of heat from the environment occurs in any furnace, but they are significant in thermal and cyclic furnaces, when the heat treating cycle includes furnace cooling to a low temperature, or when this cooling is due to long intervals between heating cycles.
For those furnaces heat loss is formed by three fundamentally different areas: through the refractory masonry, heating of atmospheric air, incoming to the environment through construction elements leakiness and refractory masonry, slope pipes cooling in welding and methodical furnace zones.
Given areas are convenient to analyze using mathematical modeling.
Formulation of the problem
The essential production task is the development of the method of furnace liningresidual heat contentdetermination, allowing predicting of the thermal state of furnace lining after arbitrary durationstand–by. This information is required for defining rational technical parameters of furnace output during working thermal state.
The problem of determining of heat content lining can be solved either by using the method of mathematical modeling or by using operational diagnostics based on the analysis of instantaneous heat balance[1 – 3]. A number of approaches for in–depth analysis of thermal state are shown in those given papers.
The developed method [4] allows predicting thermal state of furnace lining after arbitrary duration stand–by with sufficient precision. This information is required to determine rational technical parameters of furnace output during working thermal state.
The LabVIEW environment is used for visualization of the method. It cancount mathematical model and its cycle in real time. The environment allows outputting calculated numerical values and graphs onto the interface.
LabVIEW is an environment of graphical programming, which is used by technical specialists, engineers, teachers and scientists around the world for a quick creation of complex applications for measuring, testing, managing, automation of scientific experiments and educating. The LabVIEW basis includes the concept of graphical programming such as functional blocksseries connection on block–diagram.
Streaming programming in LabVIEW environment allows a developer fully focus on data and data processing ways. Program nodes,which are functions, cycles and other language constructions, receive data through entries, execute their processing and output data by outputs. As soon as the parameter values enter in every input terminal node, the node code is being executed (the processing of incoming data). [5]
Building mathematical model
The mathematical model, describing the process of furnace liningwas built. It consists of series of equations.
At the beginning, the initial heat flow is found (1.1, 1.2, 1.3):
where:
tk1 is temperature on external boundary of insulating furnace, C;
tkos is environment temperature, C;
δ1 is thickness of high–temperature furnace lining, m;
δ2 is thickness of main layer of the furnace lining, m;
δ3 is thickness of insulation layer of the furnace lining, m;
λ1 is thermal conductivity of high–temperature of the furnace lining,  ;
;
λ2 is thermal conductivity of main layer of the furnace lining, ;
λ3 is thermal conductivity of insulation layer of the furnace lining, ;
Temperatures of layers boundary are calculated (1.4, 1.5, 1.6):
where:
t1 is temperature of the furnace inner boundary C;
Average layers temperatures are calculated (1.7, 1.8, 1.9):
Heat flow is calculated (1.10, 1.11, 1.12):
The thermal content of 1 m2 main boundary layer is calculated (1.13, 1.14, 1.15, 1.16):


where:
ρ1 is density of furnace lining high–temperature layer,  ;
;
ρ2 is density of furnace lining main layer, ;
ρ3 is density of furnace lining insulation layer, ;
t1s is heat capacity of furnace lining high–temperature layer,  ;
;
t2s is heat capacity of furnace lining main layer, ;
t3s is heat capacity of furnace lining insulation layer, ;
The heat loss of furnace masonry is calculated (1.17):

where:
τ is time interval, c;
The heat loss of heating of atmospheric air (1.18, 1.19):

where:
Vν is air volume,  ;
;
Cν is air heat capacity, ;
Fν is wall area, m2;
Total heat loss is calculated (1.20):

The remaining masonry heat capacity is calculated (1.21):

The residual heat in first, second and third layers are calculated (1.22, 1.23, 1.24):

The average mass temperature of the first layer after one cooling interval is calculated (1.25):
The temperature of inner surface of the first layer (1.26):
The obtained result from the previous equation is the new value of temperature and serves as the new calculation interval.
The results of modeling process
After developing the model, it is adapted in dynamic process in LabVIEW environment. The visual process consists of the furnace lining illustration, deflection bar charts of remaining heat in three layers, field indicating change in process speed, field indicating the temperature value of outer boundary of furnace and pause–stop buttons for the convenience of process check. The screenshot of the process check initial start is shown below (Figure 1).
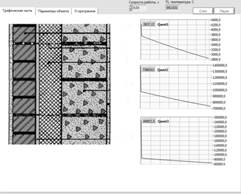
Figure 1 – the initial start of furnace lining process in LabVIEW environment
During the process operation check, the remaining heat values in three layers started to stabilize, as shown in the previous figure. The temperature drop at the inner boundary of the lining also decreased and assumed a constant value t1 ≈ 15 C in the final result, which led to changes in histograms of remaining heat in the layer (they look like lines) (Figure 2).
Figure 2 – values of remaining heat shown in histograms
During the process of creating a block diagram, a While Loop
was created, which can be found in the Structures function. A Stop
button is
created on the front panel, which indicates the end of the program. It connects to the block of Stop if True
loop. When the Stop
button is pressed,
the value True
is transmitted, as a result the cycle terminates and thereafter the program. A pause button for the program Pause
was also created.
It is connected to the block of Continue if True
loop. When the value is True
, the cycle goes into pause mode. To continue the process, the button
Pause
should be pressed again.
The sequences of blocks with various mathematical actions were created for calculation algorithms. For example, equations 1.18, 1.19 and 1.20 are given. It is necessary to find the heat loss Qptv of equation 1.18. For this, a numerical constant of the same parameter was created. The original parameters of other values must be created (or add the earlier found blocks to the calculation), for example Vν, Cν, etc.
The value of Qpv from equation 1.19 is found as a ratio. The Divide
block was created from the Numeric function. Then the blocks Qptv and Fνare combined with it.
The resulting value is not needed on the front panel.
The value of the total heat loss from equation 1.20 is calculated as the sum of the two previous blocks. The Add
block of the
Numeric function was created and then combined with blocks Qpv and Qptv. The value of the total heat loss ∑Qp is obtained. It should be hidden.
Other formulas with a difference in operations and input data were created similarly.
The remaining heat values in three layers Qaost1, Qaost2 and Qaost3 must be output in form of histograms. For this, values are wired to the graph block (Waveform Graph).
To create a loop, t′1 must be converted to t1 and the wire must be conducted to the beginning of loop. Thus, the program will run in a loop that the user can stop in anytime (Figure 3).
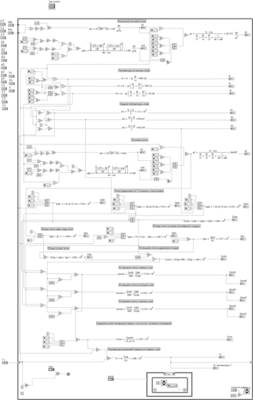
Figure 3 – block diagram of the furnace lining process in the LabVIEW environment
Conclusions
The actuality of heat loss in the furnace lining process is considered. The causes of heat loss in such areas have been identified: through the refractory masonry: heating of atmospheric air, incoming to the environment through leakiness of construction elements and refractory masonry; slope pipes cooling in welding and methodical furnace zones.
The developed method allows accurately to predict the thermal state of the furnace lining. This technique is implemented in a mathematical model with cyclically varying values. The method also allows to predict the thermal state of the furnace lining after stand–by of arbitrary duration with a sufficient accuracy. This information is necessary to determine the rational technological parameters to adjust the furnace into working thermal state.
The LabVIEW environment was used for visual and dynamical diagnostics and observing parameters by algorithm. These parameters are furnace temperature, the heat remaining of all layers and heat loss. A cycle in which all the equations are calculated in order is developed. The loop works endlessly; the user can pause and stop the process. The values of the heat remaining in three layers are displayed visually in the form of histograms.
References
1. Барков С.П., Туяхов А.И. Исследование тепловой работы нагревательной печи с внутренней изоляцией // Международная научно–практическая конференция студентов Металлургия ХХI столетия глазами молодых
, Донецк – 2015. – С. 88–89
2. Бирюков А.Б. Диагностика нагревательных печей периодического действия на основании построения и анализа моментальных тепловых балансов / А.Б. Бирюков, Е.В. Новикова, Т.Г. Олешкевич // Промышленная теплотехника. – 2014. – № 2. T. 36. – С. 29.
3. Biryukov A.B. Mathematical model for studying of metal air–cooling process in furnaces / A.B. Biryukov, A.I. Voloshin, P.A. Gnitiev // Steel in Translation. – 2015. – № 7. – P. 77–81
4. Барков С.П. Инженерная методика прогнозирования теплового состояния футеровки методической печи, находящейся в условиях простоя / Барков С.П., ТуяхоА.И. в // Вестник ДонНТУ. –2016. №5(5). –С. 43–47. (сер.: металлургические процессы и оборудование)
5. Быстрая разработка [электронный ресурс] // National Instruments Россия: [сайт]. URL: http://www.labview.ru/labview/what_is_labview/rapid_development.php
6. Интеграция с оборудованием [электронный ресурс] // National Instruments Россия: [сайт]. URL: http://www.labview.ru/labview/what_is_labview/integration_with_hardware.php
7. Комплексная программа Энергосбережение в г.Донецке на 2010–2014 гг.
/ Лукьянченко А.А., Гришин Г.А., Сафьянц С.М. и др. – Донецк,2010 – 188 с.