
Abstract
Содержание
- INTRODUCTION
- 1. PROPOSED SCIENTIFIC NOVELTY. STATEMENT OF THE PROBLEM FOR THE DEVELOPMENT OF A MEASUREMENT TOOL
- 2.ANALYSIS OF THE CONTROL OBJECT. OVERVIEW OF METHODS FOR MEASURING SELECTED CONTROLLED PARAMETERS
- 2.1. General information about existing methods for measuring dissolved oxygen in water
- 2.1.1 Titrimetric measurement method
- 2.1.2 Iodometric measurement method
- 2.1.3 Pyrophosphate measurement method
- 2.1.4 Photometric measurement method
- 2.1.5 Luminescent measurement method
- 2.2 Devices for measuring dissolved oxygen in water
- 2.2.1 Millivoltmeter pH-420
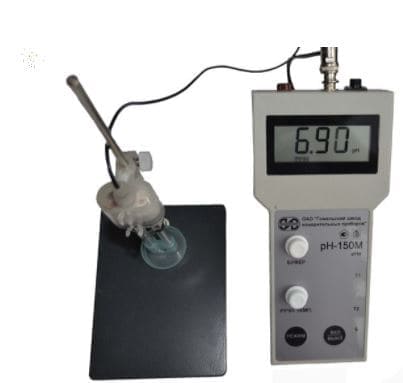
- 2.2.2 Millivoltmeter pH-150М
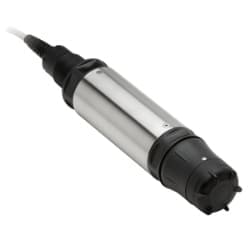
- 2.2.3 Dissolved oxygen sensorLDO sc
- 3. PROCESS FOR OBTAINING LUMINISCENT OXYGEN SENSITIVE ELEMENT
- 4. DEVELOPMENT OF A MICROPROCESSOR SYSTEM
- 4.1 Processor system functions
- 4.2 Microcontroller selection
- 4.3 Choosing a engineering environment
- 4.4 Program development
- 4.5 Simulation of the circuit and program
- CONCLUSION
- REFERENCES
INTRODUCTION
Taking into account the arisen shortage of fish, the way of improving the existing fishing industry is relevant for Donbass. One of the very first criteria that workers meet,this is the determination of oxygen in artificial reservoirs for the normal life of fish. In turn, determining the accuracy of dissolved oxygen depends on the instrument used.
Dissolved oxygen sensors operate in challenging environments. Since any contamination affects the measurement accuracy and carries for itself such consequences as fish death, or their oversaturation with gases, which also leads to death. By carrying out control in the necessary period, it is possible to exclude critical state of fish health, which will make it possible to avoid their mass death.
The luminescent method for the determination of dissolved oxygen in water is most practical both in terms of the quality of measurements performed and in terms of its maintenance.It makes it possible to shorten both the control period and the sampling time, which in turn can become a determining factor for fast solutions to the problem.
Based on the foregoing, the task was set to analyze existing methods for measuring the amount of dissolved oxygen in a reservoir, and describe the optimal a variant of obtaining an oxygen-sensitive element for the method in which the best measurement result will be achieved. And also to develop a program for a microprocessor system,for which at different values of the counter there will be output to the terminal.
1. PROPOSED SCIENTIFIC NOVELTY. STATEMENT OF THE PROBLEM FOR THE DEVELOPMENT OF A MEASUREMENT TOOL
The currently widely used dissolved oxygen sensors based on electrochemical measurement methods have a number of disadvantages. Such as: degradation of the anode and consumption of electrolyte as a result of the fact that for each molecule reduced at the cathode there is a corresponding oxidative reaction at the anode, and this is the cause of the drift of the readings and underestimation of the results. Such errors can be kept within certain limits. by regularly calibrating the sensor and replacing the electrolyte.It is based on the optical method for monitoring the oxygen content in water, improved by measuring oxygen concentration using not only the length of time during which the fluorescence process took place as its analogs, and also due to the intensity with which it occurred. An advanced optical sensor will allow you to more accurately determine the concentration of oxygen in water. Such as high sensitivity to low oxygen concentrations, no need for calibration, no flow and resistance to contamination.
Having analyzed the devices based on different measurement methods, it can be concluded that they are most suitable for measuring dissolved oxygen. in reservoirs, devices that are based on the luminescent method. But, existing devices have measurement errors. Improvement through measurement oxygen concentration by not only the length of time, but also by the intensity with which the fluorescence occurred, will significantly increase the measurement accuracy of this device.
2. ANALYSIS OF THE CONTROL OBJECT. OVERVIEW OF METHODS FOR MEASURING SELECTED CONTROLLED PARAMETERS
2.1. General information about existing methods for measuring dissolved oxygen in water
2.1.1 Titrimetric measurement methodAmong all methods for the determination of dissolved oxygen in water, one of the first is the Winkler titration method. Although this method is considered one of the oldest methods, however, until now it has not lost its relevance. The essence of this method is that the taken water sample is treated with potassium hydroxide, potassium iodide, and manganese sulfate to form manganese hydroxide.
Oxygen in water reacts with Mn (II), converting it to Mn (III). Unstable Mn (III) then reacts with another oxygen molecule and its valence becomes equal to (IV). In order to fix the reaction to the solution, add sulfuric or hydrochloric acid, which in turn converts the precipitate into manganese sulfate, while acting on iodine as an oxidizing agent. The iodine obtained is further determined by titration of phenylarsine oxide with starch as an indicator.
When using this method in natural waters, it was found that it has numerous obstacles. Below we will consider what difficulties may arise when analyzing by titration with the simultaneous presence of frequently encountered impurities in water.
Ferrous and ferric iodines: Ferrous compounds can compete with manganese in the initial stage of oxygen fixation. After the resulting reaction with oxygen, Fe (III) hydroxide is obtained, its kinetics with iodide in an acidic medium is slowed down. Thus, if the concentration of iron exceeds 25 mg / l, the use of the titration method will lead to underestimation of the results of definitions. To eliminate this problem, it was proposed to eliminate the effect of Fe (III) by adding fluoride, or phosphoric acid when acidifying the sample. The resulting complex does not in any way give iron the opportunity to interact with iodide ions. However, this method does not allow to eliminate the influence Fe (II)
Nitrite ions: As a rule, the presence of nitrite in water is caused by the microbiological transformation of ammonium into nitrate. Nitrites in an acidic medium can oxidize iodide ions, which will lead to overestimation of the determination results. However, if the concentration in water is not will exceed 0.05 — 0.1 mg / l, it is worth using the direct titration method.
2.1.2 Iodometric measurement methodThe iodometric method is applicable to all types of waters, free from interfering substances and containing dissolved oxygen at a concentration of more than 0.2 mg / l up to double saturation oxygen (approximately 20 mg / l). Easily oxidized organic substances such as tannins, humic acids and lignins interfere. Oxidable sulfur compounds, such as sulfides and thiourea are also interfering.In the presence of these substances, it is preferable to use the electrochemical sensor method according to ISO 5814. Nitrites in concentrations up to 15 mg / L do not interfere with the determination, because they are bound by the addition of sodium azide during the analysis. In the presence of oxidizing or reducing agents, modified methods must be used. In the presence of suspended solids that can fix or absorb iodine, you can use a modified method described below.
The essence of the method lies in the reaction of the oxygen dissolved in water of the sample with the freshly precipitated Mn (II) hydroxide, which is formed by adding hydroxide sodium or potassium to manganese sulfate. Acidification and oxidation of iodide by a manganese compound of a higher valence leads to the release of iodine in equivalent oxygen quantities. The isolated iodine is determined by titration with sodium thiosulfate.
2.1.3 Pyrophosphate measurement methodThe proposed method uses the same oxidation reaction of Mn (II) with dissolved oxygen to Mn (III) in an alkaline medium, which served as the basis for the Winkler method. However, due to the presence of sodium pyrophosphate in the solution, the precipitate is dissolved, since the pyrophosphate complexes Mn (II) and Mn (III) are soluble in water. The Mn (III) complex has a bright red — violet color. Its concentration is determined by titration with a solution of a reducing agent in an acidic medium, adding the indicator - mdash; diphenylamine or N — phenylanthranilic acid.
The main advantage of this method is that it can be used in the presence of many substances that react with iodine or iodide ions, in particular — in the presence of nitrites, and thus interfering with the determination of oxygen by Winkler. If the sample contains "active chlorine", it must be determined and the found amount in terms of oxygen subtracted from the oxygen determination result.
2.1.4 Photometric measurement methodPhotometric methods for determining the concentration of molecular oxygen in the visible region of the spectrum are based on the oxidation reactions of organic and inorganic substances. Of organic substances that interact with oxygen and are used for its photometric determination, use the following redox indicators: indigo carmine in leukoform, anthraquinone — a — sulfonic acid, safranin T, methylene blue.
The oxygen concentration is determined using indigo carmine, which is a fine—crystalline powder, the solution of which in water is colored in an intense blue. When indigo carmine is reduced, a pale — yellow leuco base is formed, which, when interacting with oxygen, is oxidized to indigo carmine, and the solution turns blue again. A measured volume of recovered indigo carmine is taken, mixed with the sample and placed in the cuvette of the spectrophotometer. The optical density is measured and the concentration of molecular oxygen in the sample is found using the calibration graph.
The main disadvantages of redox indicators — low sensitivity (0.1 mg / l), instability of analytical forms and not always sufficient selectivity. Pyrogallol, pyrocatechol, 2.4 — diaminophenol and other aromatic oxy & mdash; and dioxy compounds react with oxygen to form colored reaction products. Determination of the concentration of molecular oxygen with a pyrogallol solution is based on the ability of oxygen to color an alkaline pyrogallol solution. The color of the solution is compared with a solution of iodine of a certain concentration. The minimum oxygen concentration, which is determined using pyrogallol, is 0.01 mg / l.
The photometric method based on the oxidation of the cuprous ion to the cuprous ion by the oxygen contained in the sample is recommended for determining the concentration molecular oxygen in the certification of calibration solutions. The bivalent copper ion forms a blue-colored complex compound with ammonia. The color intensity obtained is compared to that of standard solutions containing ammonia and various known concentrations of cupric ion. The relative error in determining the concentration of molecular oxygen does not exceed ± 5–10%.
Photometric methods for determining the concentration of molecular oxygen in mixtures have the following advantages: high sensitivity and selectivity; the ability to create universal designs of analyzers with several indicator solutions for the simultaneous determination of a number of trace impurities. Disadvantages of the photometric method for determining the concentration of molecular oxygen — bulkiness of hardware design and low reliability.
2.1.5 Luminescent measurement methodThe essence of the luminescent method is as follows. The energy acquired by a substance when it absorbs electromagnetic radiation, usually converted to heat, but in some cases, most of the energy can be re-emitted as fluorescence or phosphorescence. Fluorescence often fades away (i.e. weakens) in the presence of oxygen. The degree of extinction depends on the possibility of a collision oxygen molecules with fluorescent molecules in their excited state, and the energy that would be emitted as fluorescence is transferred to the oxygen molecule. The oxygen concentration is determined by mixing the sample with a solution of a fluorescent substance exposed to exciting radiation, and by measuring the intensity fluorescence. However, in addition to practical difficulties, this method is characterized by high inertia. The sensitivity of determining the concentration of molecular oxygen increases with a combination of the kinetic analysis method (a compositional analysis method that uses the relationship between the reaction rate and the concentration of the reacting substances) and luminescent.
This combination of analysis methods is called luminescence-kinetic. According to this method, the concentration of molecular oxygen is determined by the intensity luminescence. The high quantum yield of luminescence and the high sensitivity of modern light-detecting equipment make it possible to observe the process sufficiently long. The ability to phosphoresce is found in most organic compounds. The interaction of excited oxygen molecules with such substances reduces concentration of excited oxygen molecules and leads to quenching of the observed phosphorescence, i.e. phosphorescence intensity is a function of concentration excited oxygen molecules.
2.2. Devices for measuring dissolved oxygen in water
2.2.1 Millivoltmeter pH-420It is a portable device with mains and autonomous power supply and is intended for measuring pH, EMF (Eh) and temperature of the investigated media. The values ??of the measured value (pH, mV, °C) are displayed in digital form on the liquid crystal display. He can solve simple siblings automation tasks without significant costs and without connecting additional modules. Has an independent connector for connecting a sensor, the values ??of which are displayed on the screen.
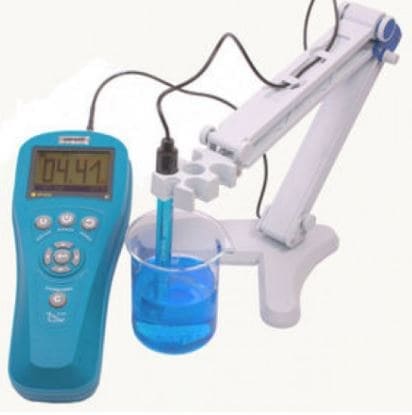
Designed for on-line measurement of the activity of hydrogen ions (pH), oxidation — reduction potentials (Eh), EMF of the electrode system and temperatures of technological solutions, natural and waste waters. The device has a convenient and quick calibration. Used in industrial laboratories and research institutions in various sectors of the national economy, including in laboratories of enterprises of the bakery and meat industry, as well as in the field.
The operating principle of the LDO sensor is based on optical technology. The uniqueness of this method is that the sensor cover with a phosphor layer replaces the electrolyte, electrodes and gas permeable membrane of traditional electrochemical cells. The sensor is calibrated at the factory for a specific cover with a durable and stable coating, so no subsequent recalibration is required. Unlike electrochemical sensors, the optical measurement does not absorb dissolved oxygen and therefore the LDO is not sensitive to contamination, and the flow rate does not affect the measurement results. The Hach — Lange LDO sensor is completely immune to dissolved gases such as H2S or CO2, which can poison and even disable traditional polarographic oxygen sensors. Immediately after switching on, the sensor is ready for measurements, because it does not take time to polarize.
3. PROCESS FOR OBTAINING LUMINISCENT OXYGEN SENSITIVE ELEMENT
The process of obtaining such a film i.e. the process of obtaining a luminescent oxygen-sensitive element has two stages:
1) Getting a porous matrix;
2) Immobilization of the indicator into the matrix.
There are times when these processes are combined. Each stage of the process affects the properties of the sensor as a whole. Sensitive element matrices, into which the luminescent indicator is adsorbed, there can be either thin films (in sol –gel and ash processes), or volumetric – porous elements. At the moment, the most promising direction in the development of luminescent sensitive elements of oxygen sensors is the use of sol – gel technologies. Compared to existing technologies, the matrix obtained using sol –gel technology has a number of advantages. Such as: large surface area, given roughness, high chemical, photochemical and temperature stability.
ВThe possibility of using the sol–gel synthesis process at normal (low) temperatures makes it possible to create favorable conditions for the immobilization of organic molecules in inorganic glass structure. Also, with the help of a solgel process, it facilitates the obtaining of the specified properties of the coating, which determine the critical parameters sensor – sensitivity and response time. Not the least of the features of sol–gel technology is the possibility of minimizing the sensitive element of the sensor up to down to micro sizes. This process can be used to create films with a thickness of up to 0.2 ?m, providing fast sensor response times. One of the biggest advantages of this film manufacturing technology is its ability to minutiarize the sensitive element of the sensor down to micro–size. An important characteristic of an oxygen–sensitive element is its ability to sustainably endure the process of operation and storage.
However, it is the ability of luminescent sensors to preserve the metrological characteristics of a sensitive element, during long–term storage and operation, that helped them become popular and compete with previously widely used electrochemical detectors. The peculiarity of the location of the sensitive element relative to the photodetector and the excitation source is no less important than the choice of technology and the method for performing the analysis. In what – That degree, it determines the choice of the method and scheme of registration of quenching fluorescence. The choice of circuit depends on the sensor and its operating conditions. Most often, the signal at which the fluorescence measurement occurs is recorded in the transmitted and reflected light at 90 degrees to the excitation radiation.
At present, the following main directions of development of luminescent sensors can be distinguished:
• synthesis of new stable indicators with high quantum yields;
• creation of SE with weakly dependent (ideally – independent) from temperature parameters;
• obtaining SEs with hydrophobic properties;
• creation of materials with stable luminescence characteristics, independent of the influence of the environment, which can be used to obtain support elements;
• development of new techniques for the sustainable implementation of indicators into the matrix in order to increase the temporal stability of the sensor;
• introduction of components that increase the sensitivity and response time of the sensor in the operating range of oxygen concentrations;
• creating highly selective SE.
In addition, the development of CHE rulers is promising. Such sensors can be created using:
• luminescent indicators with different properties for different analytes, immobilized in one matrix;
• coatings with different permeability for different analytes;
• a set of selective sensors (sensor bar) based on modern microtechnologies.
The direction of creating luminescent oxygen sensors is undoubtedly promising, since with all the accompanying problems reflects the development trend of modern instrumentation, aimed at creating microsensors and sensor multisystems based on advanced science– intensive technologies.
4.DEVELOPMENT OF A MICROPROCESSOR SYSTEM
4.1 Processor system functionsThe use of a microprocessor system in products not only leads to an increase in technical and economic indicators (reliability, power consumption, overall dimensions), but also allows you to reduce the development time of devices and makes them modified, adaptive, and also allows you to reduce their cost. The use of a microcontroller in control systems provides achieving high performance readings and low cost.
The microcontroller serves to calculate the oxygen concentration in a given sample based on the information from the sensors, transfer the calculated data to a PC, and also output the obtained values ??on the display device.
4.2 Selecting a microcontrollerTo reduce development time, cost, and increase the level of unification, it was decided to use an Arduino board. There are many convenient and proven libraries, which makes the program code more structured and reliable. Arduino is currently the most reliable and convenient way to simulate on microcontrollers. Arduino Uno & mdash; This device is based on the ATmega328 microcontroller (datasheet). It includes everything you need for convenient work with the microcontroller: 14 digital inputs / outputs (of which 6 can be used as PWM & mdash; outputs), 6 analog inputs, 16 MHz crystal resonator, USB connector, power connector, In-Circuit Programming (ICSP) connector and reset button. To get started with the device, you just need to supply power from the AC / DC - adapter or battery, or connect it to your computer using a USB & mdash; cable. Unlike all previous Arduino boards, Uno uses a USB & UART interface converter as microcontroller ATmega16U2 instead of FTDI chip.
Arduino Uno can be powered from USB or from an external power supply & mdash; the source type is selected automatically. Arduino Uno provides a number of possibilities to communicate with a computer, another Arduino or other microcontrollers. So that every time before downloading the program did not require pressing the reset button, the Arduino Uno is designed in a way that allows it to be reset programmatically from a connected computer.
4.3 Choosing a design environmentThe Arduino development environment consists of a built-in text editor of program code, a message area, a text output window (console), toolbars with buttons for frequently used commands and several menus. For downloading programs and communication, the development environment is connected to the Arduino hardware. A program written in the Arduino environment is called a sketch. The sketch is written in a text editor with cut / paste, text search / replace tools. When you save and export a project, explanations appear in the message area, and errors that have occurred can also be displayed. Text Output Window (Console) shows Arduino messages including full error reports and other information. Allows you to work with multiple sketch files (each opens in a separate tab)
4.4 Program developmentTo implement the approximating polynomial, it is required to develop a processor device in the Arduino environment, by which the oxygen concentration will be calculated. The developed program is shown below:
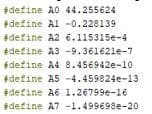
Figure 4.1 — Polynomial coefficients
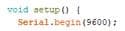
Figure 4.2— Initialization function
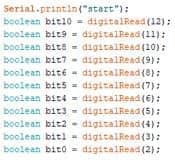
Figure 4.3 — Reading a binary code from a counter

Figure 4.4 — Convert binary to decimal
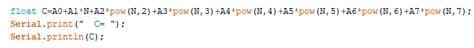
Figure 4.5 — Implementation of an approximating polynomial
4.5 Simulation of the circuit and programTo solve the problem, it was decided to use the Proteus program. This is the most powerful computer-aided design system that allows you to virtually simulate the work of a huge number of analog and digital devices. Proteus VSM software package allows you to assemble a circuit of any electronic device and simulate his work, identifying errors made at the design and routing stages. The program consists of two modules. ISIS & mdash; electronic circuit editor followed by imitation of their work. ARES & mdash; PCB editor equipped with Electra autorouter, built-in library editor and automatic component placement system.
To reduce development time, development costs, and increase the level of unification, it was decided to use an Arduino board. To complete the required task, you need
enter the decimal code using manual input. The oxygen measurement result with the accumulated counter code equal to
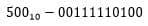 would be 6.83 mg / L. The microcircuit diagram for this code is shown in Figure 4.6
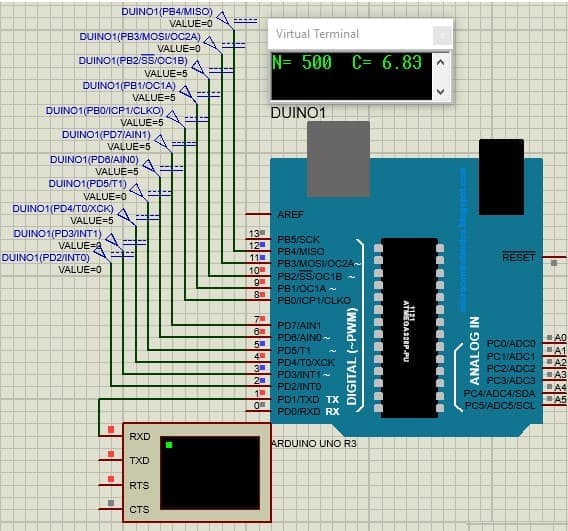
Figure 4.6 — Implemented program with counter code equal to 500
If the accumulated counter code is 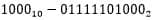 , the oxygen measurement result will be 3.00 mg / l.
This microcircuit is shown below.
The oxygen measurement result with the accumulated counter code equal to
, the oxygen measurement result will be 3.00 mg / l.
This microcircuit is shown below.
The oxygen measurement result with the accumulated counter code equal to 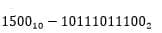 will be equal to 1.18 mg / l.
The microcircuit diagram for this code is shown in Figure 4.8
will be equal to 1.18 mg / l.
The microcircuit diagram for this code is shown in Figure 4.8
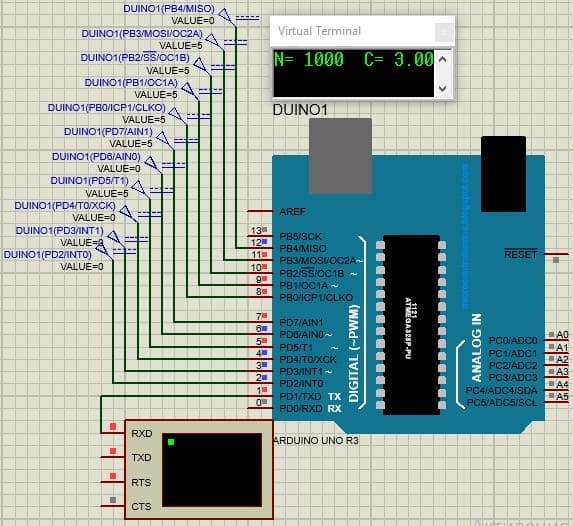
Figure 4.7 — Implemented program with a counter code equal to 1000
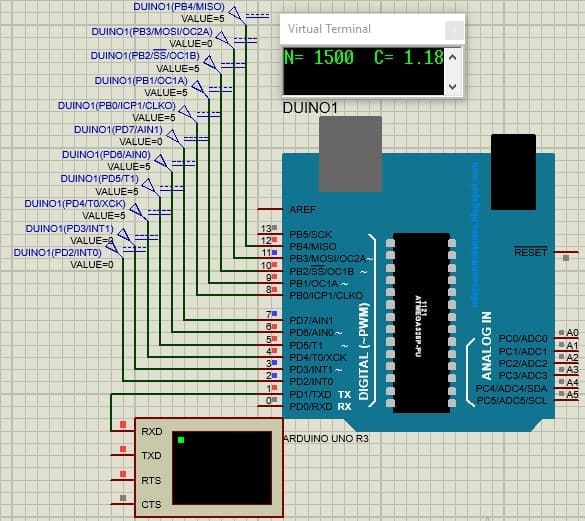
Figure 4.8 — Implemented program with counter code equal to 1500
Within the framework of this section, issues related to the development of a microprocessor system were considered. The Arduino microcontroller was chosen as well as the Arduino IDE programming environment. A program has been developed for different values ??of the counter code with output to the terminal.
CONCLUSION
Various methods have been investigated to determine the concentration of dissolved oxygen in water bodies. Comparison of the results obtained when using these methods showed that the most promising in the development of an electronic system will be the use of the method fluorescence, and a luminescent oxygen sensor. With the help of this electronic system, the amount of dissolved oxygen in the fishery reservoir will be determined, taking into account the season, influence of external and internal factors.
References
- Скуг Д. Уэст Д. Основы аналитической химии. - М.: Изд-во МИР, 1979. – 408-410 с.
- Замышляева М.Г. Михеева А.А, Очистка производственных сточных вод. - М.: Москва, 1969. – 201 с.
- ГОСТ 31859-2012 Метод определения химического потребления кислорода. – М.:Москва: Стандартинформ, 2014. – 10 с.
- LDO – люминесцентный метод измерения растворенного кислорода в воде [Электронный ресурс] – Режим доступа: http://www.ecoinstrument.com.ua/...
- Люминесцентные сенсоры кислорода [Электронный ресурс] – Режим доступа: http://www.microsystems.ru/...
- Разумовский С.Д. Кислород - элементарные формы и свойства. - М.: Химия, 1979. - 304 с.
- Агасян П.К. Основы электрохимических методов анализа. - М.: Химия, 1984. - 168 с.
- Божевольнов Е.А. Люминесцентный анализ неорганических веществ. - М.: Химия, 1966. - 416 с.
- Тхоржевский В.П. Автоматический анализ газов и жидкостей на химических предприятиях. - М.: Химия, 1976. - 272 с.
- Шпак И.Е. Михайлова А.М. Характеристика и анализ вод. - Саратов: Сарат.гос. техн. ун-т, 2000. - 80 с.
- Аманазаров А. Шарнопольский А.И. Методы и приборы для определения кислорода. - М.: Химия, 1988. - 144 с.
- Морф В. Принципы работы ионоселективных электродов и мембранный транспорт. - М.: Мир, 1985. - 280 с.
- Сокольский. Ю.М. Очистка вод. - М: Химия, 1986. - 258 с.
- Шуваева О.В. Современное состояние и проблемы элементарного анализа вод различной природы. Новосибирск: ГПНТБ СО РАН, 1996. - 48 с.
- Лотош В.Е. Экология природопользования. Екатеринбург: Полиграфист, 2001. - 540 с.
- Никифоров А.Ф. Физикохимия воды и водных растворов. Екатеринбург: 2003. - 92 с.
- Стромберг А.Г. Физическая химия. - М.: Высшая школа, 1988. - 496 с.