
Contents
- Introduction
- RELEVANCE OF MATHEMATICAL MODELING FOR MINING
- 1.1 The role of computer modeling in solving applied and scientific problems
- 1.2 Understanding Computer Simulation
- 1.3 Computer Simulation in Mining
- CONCEPT OF GEOINFORMATION SYSTEMS
- 2.1 Main characteristics of GIS
- 2.2 Methods and technologies of modeling in GIS
- LINKING A SPACE IMAGE IN QGIS
- Conclusions
- List of sources
Introduction
Man-made human intervention in the development and exploitation of the earth's interior violates the balance of the environment is usually extremely unfavorable. Secure conduction problems work on the development of underground space and the construction of structures in it dictate the need for various fundamental and applied research. The number and severity of problems generated by man-made interventions, from a safety point of view during the creation and operation of underground structures, and from the point of view of the ecology of the natural environment, significantly outstrips the accumulation of experience in solving or at least to neutralize them by direct mining practice. The statistics of catastrophic events in mining urgently require the development of ideas about the behavior of the rock mass under technogenic impact and careful choice of approaches to adequately describe the behavior of the rock mass.
With the development of computer technology, it becomes more and more important the role of computer modeling in solving applied and scientific problems. For computer experiments, a suitable mathematical model is created and appropriate software development tools are selected. The choice of programming language has a huge impact on the implementation of the resulting model.
RELEVANCE OF MATHEMATICAL MODELING FOR MINING
1.1. The role of computer modeling in solving applied and scientific problems
Traditionally, simulation on a computer was understood only as simulation (IM). However, it can be seen that in other types of modeling the computer can be extremely useful, except perhaps for physical modeling, where a computer can actually be used too, but, rather, for control purposes modeling process. For example, in mathematical modeling, one of the main stages is the construction of mathematical models from experimental data. - at present it is simply unthinkable without a computer. In recent years, thanks to the development of the graphical interface and graphic packages, the computer, structural and functional modeling. The beginning of the use of the computer even in conceptual modeling, where it is used, for example, in the construction of systems artificial intelligence.
Thus, we see that the concept of "computer modeling" is much broader than the traditional concept of "modeling on a computer "and needs clarification, taking into account today's realities.
1.2. The concept of computer modeling
Modeling is the process of building and using a model. A model is understood as such a material or abstract object that, in the process of study, replaces the original object, keeping its properties important for this study.
Computer modeling as a method of cognition is based on mathematical modeling. Mathematical model (MM) - it is a system of mathematical relations (formulas, equations, inequalities, and signed logical expressions) representing essential properties of the object or phenomenon under study.
Computer simulation (CM) is one of the most effective methods for studying complex systems. Computer models are easier and more convenient to study due to their the ability to carry out computational experiments in cases where real experiments are difficult due to financial or physical obstacles, or may give unpredictable results. The consistency of computer models allows us to identify the main factors that determine the properties of the studied original object ( or a whole class of objects), in particular, to study the response of the simulated physical system to changes in its parameters and initial conditions.
The main task of any model, including a computer model, is to obtain data about the object of research using certain theoretical calculations and computer calculations, without carrying out expensive experiments. Although the resulting model may be an exact copy of the original, but most often some elements important for this study are recreated in the models, and the rest are neglected. This simplifies the model. But in other way, creating a model - an exact copy of the original - can be an absolutely impossible task.
1.3. Computer modeling in the mining industry
The task of computer modeling of geomechanical processes and phenomena is to obtain qualitative and quantitative estimates the studied phenomenon in natural conditions when it is replaced by a physical model, the transition in the description to a mathematical model and the implementation of the latter by computer methods.
The solution of geomechanics problems in computer implementation consists of four stages and is:
- physical formulation, including the formulation of the type of problems from geometric considerations; selection of a physical model with an indication of the forces acting in the array;
- descriptions of the structural and mechanical features of the massif and the presentation of the necessary quantitative estimates of the mechanical properties of rocks;
- mathematical formulation of the problem and writing a complete (closed) system of equations in accordance with predetermined physical equations that describe the behavior of the environment;
- computer implementation of a mathematical system of equations with the help of our own software products or using existing ones, allowing to solve a mathematical system of equations with varying various parameters;
- verification and analysis of the results, conclusions based on the decisions obtained.
The use of computer methods in geomechanics makes it possible to adapt and spread the methods of mathematical modeling for studying complex geomechanical processes. The undoubted advantage of computer modeling is the ability to take into account and vary the set of parameters involved in a mathematical setting. Of course, it is necessary to be aware of the framework for the effective use of certain solutions when modeling real processes. The use of computer methods is effective and justified in the case of studying mechanical processes, the modeling of which is very laborious or almost impossible. carry out using other approaches in accordance with the constructed model.
THE CONCEPT OF GEOINFORMATION SYSTEMS
2.1. Main characteristics of GIS
Modern geographic information systems (GIS) represent a new type of integrated information systems, which, on the one hand, include data processing methods of many pre-existing automated systems (AS), on the other hand, they have specific features in the organization and processing of data. In practice, this defines GIS as multipurpose, multidimensional systems. Based on the analysis of the goals and objectives of various GIS operating at present, the definition of GIS as geographic information systems, not geographic information systems. This is due to the fact that the percentage of purely geographical data in such systems is insignificant, data processing technologies have little to do with traditional processing of geographic data and, finally, geographic data serve only as a basis for solving a large number of applied problems, the goals of which are far from geography. So, GIS is an automated information system designed for processing spatio-temporal data, the integration of which is based on geographic information. Complex information processing is carried out in GIS - from collection to storage, updating and presentation, GIS should therefore be considered from different perspectives. How GIS control systems are designed to support decision-making on optimal land and resource management, urban management, transport and retail management, the use of oceans or other spatial objects. At the same time, cartographic data are always used to make decisions, among others. Unlike automated control systems (ACS) in GIS there are many new technologies for spatial data analysis. As such, GIS is a powerful tool transformation and synthesis of various data for control tasks.
How automated GIS information systems combine a number of technologies or technological processes of known information systems such as automated research systems, automated design systems, automated reference and information systems, etc. CAD technologies are the basis for the integration of GIS technologies. Since CAD technology is enough approved, this, on the one hand, provided a qualitatively higher level of GIS development, on the other, it significantly simplified the solution problems of data exchange and selection of technical support systems. By this, GIS has become on a par with general-purpose automated systems. type CAD, ASNI, ASIS. How geosystems GIS include technologies (primarily technologies for collecting information) of systems such as geographic information systems, systems cartographic information (SKI), automated mapping systems (ASK), automated photogrammetric systems (AFS), land information systems (VMS), automated cadastral systems (AKS), etc. As systems using databases, GIS is characterized by a wide range of data collected using different methods and technologies. At the same time, it should be emphasized that they combine both databases of conventional (digital) information and graphical databases. data. Due to the great importance of the expert tasks solved with the help of GIS, the role of the expert systems that are part of the GIS increases. How systems GIS modeling uses the maximum number of modeling methods and processes used in other automated systems. How receiving systems design solutions GIS largely use computer-aided design methods and solve a number of special design tasks, which in a typical computer-aided design are not encountered.
How GIS information presentation systems are the development of automated documentation support systems (ADSO) using modern multimedia technologies. This makes the GIS output more visible than conventional geographic maps. Data output technologies allow you to quickly obtain a visual representation of cartographic information with various loads, switch from from one scale to another, receive attribute data in tabular or graph form. How integrated GIS systems are an example of integration various methods and technologies into a single complex created by integrating technologies based on CAD technologies and integrating data based on geographic information. As applied GIS systems are unmatched in breadth of application, as they are used in transport, navigation, geology, geography, military affairs, topography, economy, ecology, etc. Due to the wide possibilities of GIS, thematic mapping is intensively developing on their basis. As mass-use systems GIS allows you to apply cartographic information at the level of business graphics, which makes them accessible to any student or businessman, not just a specialist geographer. That is why, when making decisions based on GIS technologies, they do not always create maps, but always use cartographic data. As already stated, GIS uses technological advances and solutions applicable in such automated systems as ASNI, CAD, ASIS, expert systems. Hence, GIS modeling is the most complex in relation to other automated systems. But on the other hand, modeling processes in GIS and in any of the above speakers are very close. ACS is fully integrated into GIS and can be considered as a subset of this system. At the level of information collection GIS technologies include methods for collecting spatio-temporal data that are not available in ACS, technologies for using navigation systems, real-scale technologies time, etc. At the level of storage and modeling, in addition to the processing of socio-economic data (as in the automated control system), GIS technologies include a set of spatial analysis technologies, the use of digital models and video databases, and an integrated approach to decision-making. At the GIS presentation level complements ACS technologies with the use of intelligent graphics (presentation of cartographic data in the form of maps, thematic maps or at the level of business graphics), which makes GIS more accessible and understandable compared to automated control systems for businessmen, management workers, government officials, etc. Thus, in GIS, in principle, all the tasks performed earlier in the ACS are solved, but at a higher level of integration and data unification. Therefore, GIS can considered as a new modern version of automated control systems using more data and more methods of analysis and acceptance solutions, and primarily using methods of spatial analysis (see Fig. 1).
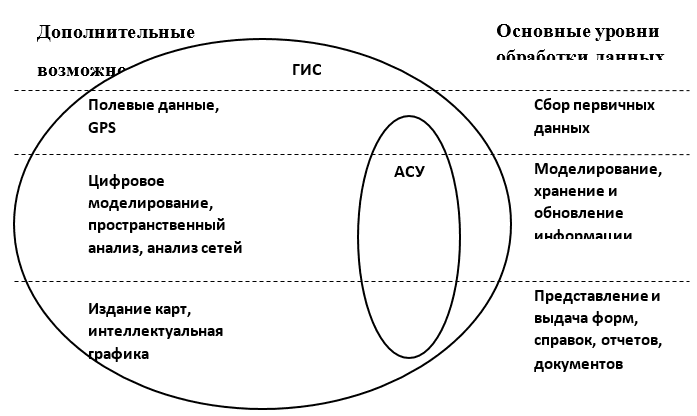
Fig. 1 Additional possibilities of GIS in comparison with the automated control system for the main levels of data processing
2.2. Methods and technologies of modeling in GIS
There are four main groups of modeling in GIS:
1. Semantic - at the level of information collection;
2. Invariant - the basis for the presentation of maps, through the use of special libraries, for example, libraries of conventional symbols and libraries of graphic elements;
3. Heuristic - communication of a user with a computer based on a scenario that takes into account the technological features of the software and the processing features of this
categories of objects (takes a leading place in interactive processing and in control and correction processes);
4. Informational - creation and transformation of various forms of information into a user-defined form (it is the main one in the subsystems of documentation support).
When modeling in GIS, the following software and technological blocks can be distinguished:
1. Operations converting formats and data presentation. They are important for GIS as a means of data exchange with other systems.
Conversion of formats is carried out using special converter programs (AutoVEC, WinGIS, ArcPress).
2. Projection transformations. Transition from one cartographic projection to another or from spatial
systems to cartographic projection. As a rule, foreign software does not support directly distributed in
our country of projection, and information about the type of projection and its parameters is quite difficult to obtain. This determines the advantage of domestic
GIS developments containing sets of necessary projection transformations. On the other hand, widespread in Russia various
methods of working with spatial data need analysis and classification.
3. Geometric analysis. For vector GIS models, these are operations for determining distances, lengths of broken lines, finding points of intersection of lines;
for raster - operations of identifying zones, calculating areas and perimeter of zones.
4. Overlay operations: imposition of dissimilar layers with generation of derived objects and inheritance of their attributes.
5. Functional modeling operations:
• calculation and construction of buffer zones (used in transport systems, forestry, when creating buffer zones around lakes, when determining pollution zones along roads);
• network analysis (allow to solve optimization problems on networks - search for paths, allocation, regionalization);
• generalization (intended for the selection and display of cartographic objects according to their scale, content and thematic focus);
• digital terrain modeling (consists in building a database model that best reflects the relief of the surveyed area).
2.3. Basic GIS Components
Any GIS includes the following components:
1. Hardware platform;
2. Software (software);
3. Data (data);
4. Staff.
The hardware platform, in turn, consists of the following parts:
1. Computers (workstations, laptops, pocket PCs),
2. Data storage media (hard drives, CDs, floppy disks, flash memory),
3. Information input devices (digitizers, scanners, digital cameras and cameras, keyboards, computer mice),
4. Information output devices (printers, plotters, projectors, displays).
The “heart” of any GIS is the data it uses for analysis. Input devices allow you to convert an existing geographic information in the format that is used in this GIS. Geographic information includes paper maps, aerial photography and remote sensing materials, addresses, coordinates of objects collected using global positioning GPS (Global Position System), space satellites or digital geographic information stored in other formats.
If we talk about GIS software, it should be noted that most software packages have a similar set of characteristics, such as layer-by-layer mapping, marking, coding geoinformation, finding objects in a given area, determining different values, but very different in price and functionality. The choice of software depends on the specific application tasks solved by the user.
ARC / INFO software product is one of the first professional GIS, focused on working with spatial information, stored in the database. As a result of its implementation, there has been a real revolution in digital cartography and in the ways of working with spatial information. ARC / INFO consists of a basic set of programs and additional modules that can be purchased separately in addition to the basic kit. The basic software package is a fully functional GIS for work in various application areas. It supports the whole cycle of work on the creation and use of GIS from data entry and editing to the organization of information requests for the analysis of spatial information and preparation of final hard copy cartographic products.
ARCVIEW GIS is a system for displaying, editing, spatial analysis, searching and managing geospatial data. This tool, like ARCINFO, is developed by ESRI.
One of the attractive features of ARCVIEW GIS is the inclusion of hints (Wizards) in the software package. These hints make it easier to use many new tools and are useful for both novice and experienced users. Added tools for creating coordinate grids and map frames (managing spacing, line types, frame type).
ARCVIEW geoprocessing and analysis tools let you perform complex spatial operations on geographic data such as creating buffer zones around cartographic features, clipping, merging, intersecting, combining topics and assigning data by location.
Other improvements include expanding the range of supported dates from 5 million 800 thousand years BC to 5 million 800 thousand years AD. which is sometimes required for geological, archaeological, etc. applications), the ability to digitize maps on a digitizer in streaming mode.
AutoCAD Map 2000 - high-precision software for creating digital maps and implementation of geoinformation analysis, including all functionalities base product AutoCAD. Contains all the necessary tools and effective functions for making cartographic basis and processing of geographic information.
Supports any graphic formats, exports data to all popular geographic information processing programs. Provides instant access to additional data for a geographic information project over the network.
AutoCAD Map 2000 provides developers with more than 2 thousand global coordinate systems (more than 100 of them are new). AutoCAD Map 2000 provides the best tools for quickly and accurately chipping cards from paper. Chipping cards dramatically speeds up translating paper maps into digital form. The software includes powerful tools for querying, modifying properties, spatial analysis, and excellent print management.
The CREDO complex is designed for processing survey materials, designing objects for industrial, civil and transport construction, exploration, production and transportation of oil and gas, creation and maintenance of large-scale digital plans of cities and industrial enterprises, preparation of data for land management, solving many other engineering problems.
Today the main software products of MapInfo are:
1. MapInfo Professional - a fully functional geographic information system;
2. MapBasic - programming environment for MapInfo Professional;
3. MapInfo SpatialWare - a technology for managing spatial information in a SQL Server / Informix database;
4. MapInfo MapX - application developer library;
5. MapXtreme - software for developing mapping applications for Intranet or Internet.
In addition to traditional DBMS functions, MapInfo Professional GIS allows you to collect, store, display, edit and process cartographic data stored in the database, taking into account the spatial relationships of objects. In one session of work, data of different formats. The built-in query language SQL, thanks to its geographic expansion, allows organizing selections taking into account the spatial relationships of objects, such as remoteness, nesting, overlap, intersection, area of ??objects, etc. Database queries can be saved as templates for later use. MapInfo has the ability to search and plot objects on the map by coordinates, address, or index system.
For visual representation and cartographic analysis of spatial data in GIS MapInfo, thematic mapping is used. MapInfo offers the following methods for building thematic maps: value ranges, bar and pie charts, graduated symbols point density, single values, continuous surface. Combination of thematic layers and methods of buffering, zoning, merging and splitting objects, spatial and attributive classification allows you to create synthetic multicomponent maps with a hierarchical structure.
GIS MapInfo opens up great opportunities for developers of geographic information software. Using modern communication methods between Windows Applications allows you to integrate the MapInfo Maps window into programs written in Delphi, Visual Basic, C ++, PowerBuilder, etc. Joint use of MapInfo and the MapBasic development environment enables everyone to create specific applications for solving specific applied problems.
QGIS Desktop is a cross-platform geographic information system for spatial analysis and mapping.
Freely distributed under the GNU GPL 2. The graphical interface of the application includes many tools for exploring spatial data. QGIS allows you to transform data and export it in a variety of formats.
One of the popular vector geographic data formats is the so-called "Shapefile". This format allows you to store various vector objects (points, polygons, etc.), but a separate file can contain objects of only one specified type. Each entry can have multiple description attributes.
BINDING A SPACE IMAGE IN QGIS
The first thing to do is add an underlay. To do this, go to the "Modules" tab - "Modules Management". In the section all you need to find "QuickMapService" then click "Install" (Fig. 2). Next, select "OSM" - "OSM Standard" (Fig. 3).
Fig. 2-3
Next, load the image (Fig. 4). Then go to the "Raster" tab and select "Georeferencer" (Fig. 5). In the window that opens (Fig. 6), select "Open raster", select the image and specify the coordinates "EPSG: 3857" (Fig. 7)
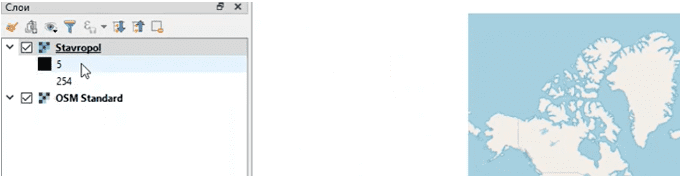
Fig. 4
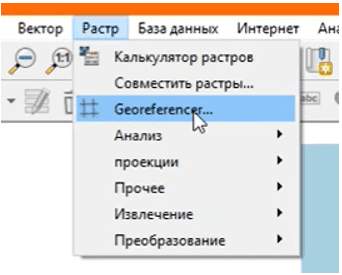
Fig. 5
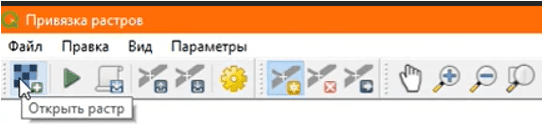
Fig. 6
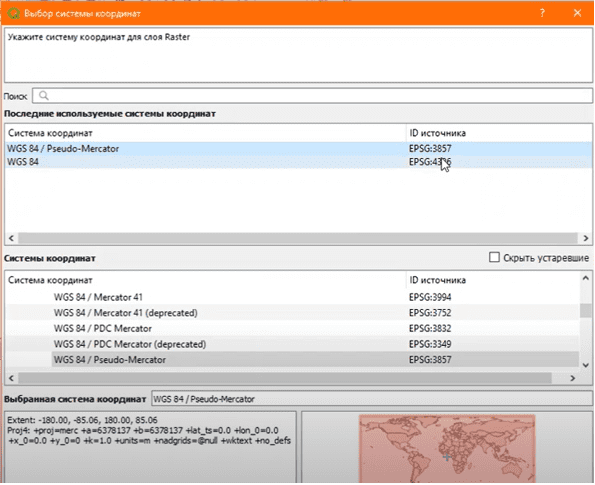
Fig. 7
Add a point (Fig. 8). We select the coordinates from the map, on the map you need to find the building on which we put the point (fig. 9) and similarly add 4 dots.
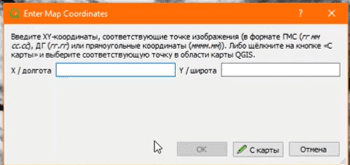
Fig. 8
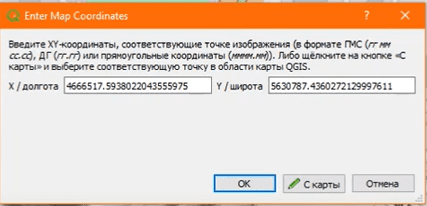
Fig. 9
Next, go to "Parameters" (Fig. 10). We set the coordinates of the points (Fig. 11-13).
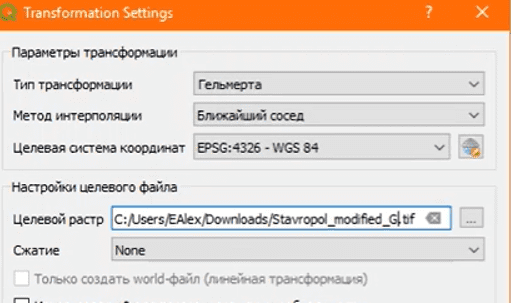
Fig. 10
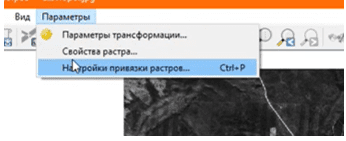
Fig. 11
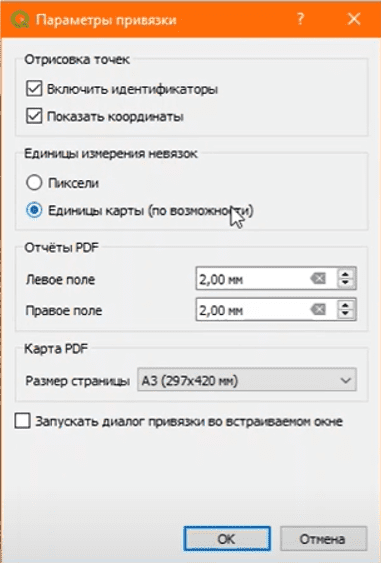
Fig. 12
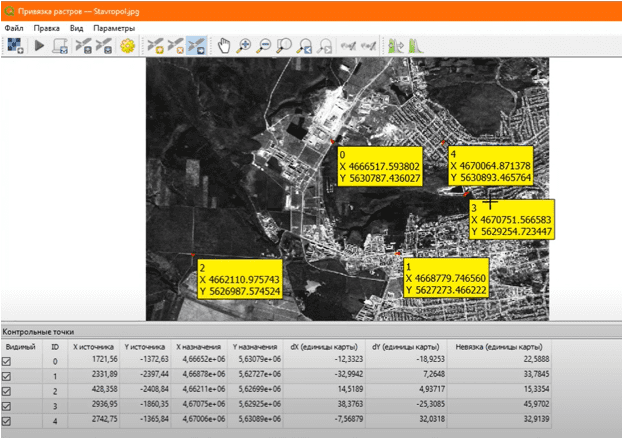
Fig. 13
The result of the work done is shown in Fig. 14.
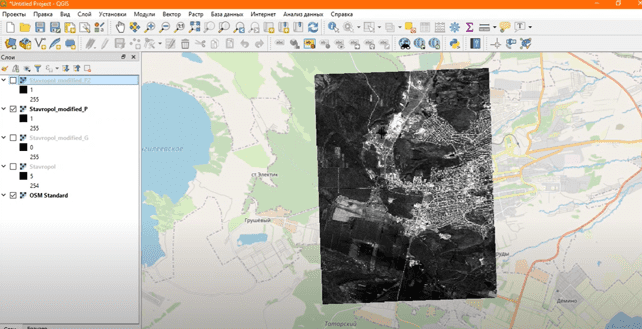
Fig. 14
CONCLUSIONS
Based on the studies carried out, it can be concluded that the use of computer technologies in the mining industry strictly necessary. Since conducting research of an experimental nature is hampered by the high risks of catastrophic phenomena and extensive material costs, computer modeling of geomechanical processes allows a more detailed approach to the study of these processes.
List of sources
- Davis J. Statistics and analysis of geological data / M .: Mir, 1997. - 92 p.
- K.Yu. Silkin. Mathematical foundations of computer graphics / Per. from English. M .: Mashinostroenie, 2008.66 p.
- Prokopenko E.V. An integrated approach to the formation of waste dumps in coal-mining regions / Borshchevsky S.V., Maslo S.V. / Materials of the IV scientific conference `` Agoshkovsky readings '', November 12, 2011. - Chita: ZabGK, 2011. -S.85-93
- Leonov P.A. Rock dumps of coal mines / Leonov P.A., Surnachev B.A. -M.: Nedra, 1970.-112s
- Picker M.P. Prevention of spontaneous combustion of rocks. / Zborshchik M.P., Osokin V.V.K .: Technique, 1990.- 176p.
- Panyukov P.N. Engineering geology. / Panyukov P.N.-2nd ed., M.: Nedra, 1978.-296s.
- Fisenko G.L. Stability of the sides of open pits and dumps. / Fisenko G.L. - M.: Nedra.-1965.-200s.
- Nature conservation. Earth. Classification of disturbed lands for reclamation. GOST 17.5.3.02-8
- Gorbunova, K. A. Technogenic impact on the geological environment of the Perm region / K. A. Gorbunova, N. G. Maksimovich, V. N. Andreichuk. - Perm, 1990. - 44 p.
- Vistelius A.B. Fundamentals of Mathematical Geology. L .: Science, 1980