Software Structure Metrics Based on Information Flow
Authors: Sallie Henry, Dennis Kafura
Source: IEEE Transactions on Software Engineering (Volume: SE-7, Issue: 5, Sept. 1981), 510–518 pp.
Abstract
Structured design methodologies provide a disciplined and organizedguide to the construction of software systems. However, while the methodology structures and documents the points at which design decisions are made, it does not provide a specific, quantitative basis for making these decisions. Typically,the designers' only guidelines are qualitative, perhaps evenvague, principles such as functionality, data transparency, or clarity. Thispaper, like several recentpublications,defines and validates a set of software metrics which are appropriate for evaluating the structure of large-scale systems. These metrics are based on the measurement of information flow between system components. Specific metrics are defined for procedure complexity, module complexity, and module coupling. The validation, using the source code for the UNIX operating system, shows that the complexity measures are strongly correlated with the occurrenceof changes. Further, the metrics for procedures andmodules can be interpreted to reveal various types of structural flaws in the design and implementation.
Introduction
The annual cost of software is currently estimated at 20 billion and rising rapidly [40]. Of this amount, a frustratingly large fraction, as high as 50–75 percent over thelifetime of a typical software system, is spent on maintaining unreliable, poorly structuredsoftware. This high maintenence factor is due in large part to errors made during the design phase [40] and to the choice of a system structure which has an overly complex interconnectivity among its components [4], [25], [35]. In the face of these problems one of the most significant and practical challenges facing software engi- neers today is the development of tools and techniques to restrain software costs while enhancing software quality.
Much of the recent work in software engineering has recognized that reducing costs and increasing quality are compatible goals which can be achieved when the complexity of the software structure is properly controlled. For example, the use of structured design methodologies allow the controlled introduction of complexity via levels of abstraction, virtual machines, or layered hierarchies [11], [23], [28], [29]. By establishing an ordered discipline during the design phase these techniques have had notable success in producing higher quality, lower cost software. Research has also concentrated on the development of specification techniques [31], testing and debugging methods [26], and the construction of programmer workbench style software development systems [12], [21]. These efforts have in common the attempt to maintain control of the emerging software product either by making explicitthedecisionsinvolved with thespecification and design of the system or by automating (making implicit) the mechanical operations involved in its assembly. Because of the fundamental relationship betweencomplexity and software quality several recent studies have focused attention on the development and validation of a set of quantitative metrics to measure the complexity of software structures [8], [17], [36], [38]. These metrics are useful management aids, important design tools, and also basic elements in research efforts to establish a quantitative foundation for comparing language constructs and design methodologies.
Previous research in software metrics has been concentrated in oneof three major areas. First, many studies explored metrics based on the lexical content of a program. These studies included Halstead's original work [17], which counted operators and operands, and its subsequent development, the cyclomatic complexity measure by McCabe [24], which counted the number of branch points in a program, and the extensive study byThayer et al. [36], which counted the occurrence of a wide variety of statement types. The common thread inthis work is the counting of lexical tokenswithout specific regard for the structure created by thosetokens. These simple lexical measures haveproven to be surprisingly robust in predicting variousaspects of software quality.
A second major research direction is based on the application of information theoretic concepts, such as entropy, to the formulation of software metrics. This approach grew out of work by Alexander and others [1] in the field of architecture and design. Channon [10] was the first of several [33], [34] who used this idea to analyzethedesign of software structures. One difficulty with Channon's measure is that each assumptionofeachprocedure must be explicitly determined. Not only is this level of detailexcessive but, since the assumptionscannot be deduced automatically, it requires a manual analysis by the designer/implementor. For large-scale systems such a time consuming operation is not feasible. The other information-based measurements alsorequire a considerabledegree of parameter estimation such as determining the probability of a change in one module causing a change in any other module. While these techniques are thoroughly grounded in an underlying theoretical base, theyhave not proven to be as practical as the lexical measures.
The third major type of metric dealsdirectly with the system connectivity by observing the flow of information or control among system components. Thework of Yin and Winchester [38] focused on the interface between the major levels ina large, hierarchically structuredsystem. The work of Henry using information flow [19] also falls into this category and is the subject of this paper. The informationflow approach is more detailed than the Yin-Winchester study because it observes all informationflow rather than just those across level boundaries. However, in contrast to the information theoretic measures, the information flow method is a completely automatable processusing fairly standard data flow analysis techniques [2], [18].
We believe thatthe information flow technique is an appropriate and practical basis for measuring large-scale systems for threereasons. First, as will be seen in the subsequent sections of this paper,the major elements in the informationflow analysis can be directly determined at design time. The availability of this quantitative measurement early in the system development process allows the system structure to be corrected with the least cost. Second, theresearch of Henry [19] has shown that the informationflow technique, illustrated in Section II of this paper, reveals more of the system connections than otherordering relations such as calls, uses [29], or dependency [20]. In this sense the information flow measurements are more sensitive than measurements based on other relationsto the nuances of system structures. Third, by observingthe patterns of communication among the system components we are in a position to define measurements for complexity, module coupling, levelinteractions, and stress points. Evaluation of these critical system qualities cannot be derived from the simple lexical measures. Thus, the information flow method leads to automatable measures ofsoftware quality which are available early in the development process and produce quantitative evaluation of many critical structural attributes of large-scale systems.
The most important practical test of a software metric is its validation on real software systems. There are many scales against which a complexity metric, such as the one proposed in this paper, may be validated e.g., determining the correlation of the measure to programming time, comprehension time, error rate, etc.). In this paper we will validate the complexity metric by demonstrating that it is highly correlated with the occurrence of system changes. The software system used inthis validation study is the UNIX operating system (version 6). We chose to use an operating system because they are important objects of study among large-scale systems. The operating system forms the interface between the hardware and applications programsand alsocreates the virtual machine environment which is critical to the success of the applications which it supports. In addition, operating systems tend to be among the more complex of software systems, both in their design and in the interrelationships of their parts. Thus, an operating system is a sound basis for the measurement and validation of software metrics. The UNIX operating system was chosen as the vehicle for the informationflow analysis forseveral reasons. First, UNIX is written in a high-level language and its internal mechanisms are well documented [22],[32]. Second, UNIX is a large enough operating system to use as a reasonable experimental basis, yet is small enough for a manageable researchproject with limited resources. The third reason forselecting UNIX is the fact that UNIX software was designed for users and not as a toy or experimental system. In particular, it was not written to illustrate or defend a favored design methodology. Fourth, UNIX is universal in that it is installed in many environments and on several different machines. Thus, we expect our results to be understood, and perhaps criticized,in detail by a larger audience. The fifth reason is thefunctionality of UNIX.UNIX, containing a powerful I/O system, a simple virtual memory structure, dynamic taskcreation and deletion, simple interprocess communication,and some protection features,possesses thetypical spectrumof operating system functions. Section II of this paper defines the basic notions of the information flow technique and illustrates these ideas with a simple example. Section III applies this technique in analyzingthe UNIX o'perating system. A structural complexity measure is presented and used toevaluate the procedure and module structure of UNIX. Section IV contains avalidation of the complexity metric by showing that this metric is strongly correlated with the existence of errorsin UNIX. In Section V we describe our initial, and as yet incomplete, attempt to develop a set of module interface measurements e.g., coupling). This material is presented primarily to show the wide range of structures which can be based on the information flow method.
Information flow concepts and defitions
In this section various types of information flows are informally presented by example. The mechanisms forderiving these flows are bypassed here but are given in [19]. Following the example, formal definitions of information flow are given.
Fig. 1 shows six modules, A ,B, C, D, E, F, a data structure DS, and the connections among these modules and the data structure. Module A retrieves information from DS and then calls B; module B then updates DS. C calls D and module D calls E and E returns a value to D which D then utilizes and then passes to F. The function of F is to update D.
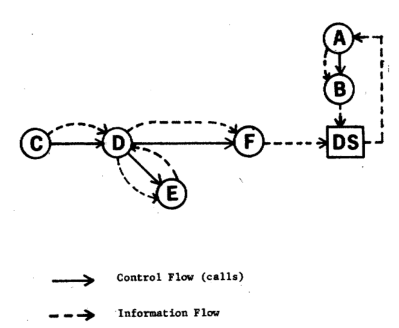
Figure 1 — An example of information flow
Generated from this example are the following direct flows of information (termed direct local flows).
A → B,
C → D,
D → E,
D → F.
These flows are simply the ones observed in a calling structure. There are also some indirect flows of information (termed indirect local flows). These indirect flows are
E → D,
E → F.
The first flow results when E returns a value which is utilized by D and the secondflow results when the information that D receives from E is passed to F. Notice that this is an example of an information flow existing when no control flow exists. There also exists a flowof information through the global data structure DS, again without a matching flow of control. These global flows are
B → A,
F → A.
Both B and F update DS and A retrieves information from DS. The information flow relations generated from this example are summarized in Fig. 2.
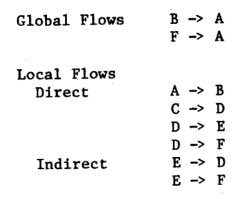
Figure 2 — Information flow relations generated from Fig.1
The following definitions describe preciselythe various types of information flow presented informally above. Additional details regardingthese definitions can be found in [19].
Definition 1: There is a global flow of information from module A to module B through a global data structure D if A deposits information into D and B retrieves information from D.
Definition 2: There is a local flow of information frommodule A to module B if one or more of the following condi- tions hold:
- if A calls B,
- if B calls A and A returns a value to B, which B subse- quently utilizes, or
- if C calls both A and B passing an output value from A to B.
Definition 3: There is a directlocal flow of information from module A to module B if condition 1) of Definition 2 holds for a local flow.
Definition 4: There is an indirect local flow of information frommodule A to module B if condition 2) or condition3) of Definition 2 holds for a local flow.
An important property of theinformation flows defined above is that the knowledge necessary to constructthe com- pleteflows structure can be obtained from a simple procedure- by-procedure analysis. Theexample presented in Fig. 1 will be used toillustrate this process. The left part of Fig.3 shows possible skeleton code for procedures D, E, and F. The corre- sponding set of relations generated for each procedure are shown in the right part of the figure. E-ach relation is named e.g., D1,D2,**, F1,F2) merely for convenience and this is not a necessary part of the relation. In this example it is assumed that the only operations involving thevalues of the variables P and Q are thoseexplicitly shown.
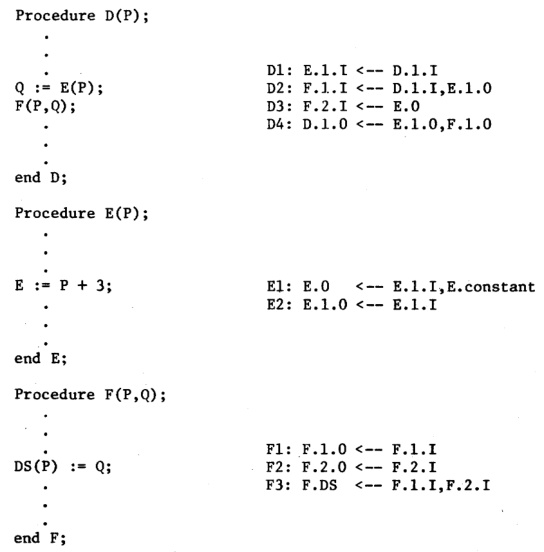
Figure 3 — Possible code and relations for Example 1
In general, a flow of information is represented by a relation of the form
destination ← source1, source2, ... , sourceN.
The source(s) and destination are denoted in one of four possible ways: 1) X. n. I denotes the value of the nth parameterof procedure X at the procedure's invocation; 2) X.n.O denotes thevalue of the nth parameter of procedure X at thetermina-tion of the procedure; 3) if X is a function, X. 0 denotes thevalue returned by that function; and 4) X. D denotes an access by procedure X to the global dataobject D. As an example, consider procedure F. Relations Fl and F2 indicatethat the output i.e., final) values of its parameters are the same as their original input values. Relation F3 indicates that the global data structure DS is updated based on the input values of its two parameters.
Notice that the form of the relations is in no way affected by the syntax of the source languagebeing used. Also note that no distinction is made between a flow of information established by a passed parameter and one established by a shared global data structure.
Using the relations generated on a procedure-by-procedure basis it is possibleto combine theserelations to form the complete structure of information flow by a simple substitution process. For example, we can derive the flow emanating from procedure D which ultimately is used to update DS by working backward from DS in the following manner:
F.DS ← F.1.I, F.2.I (F3)
← F.1.I,E.O (D3)
← F.1.I,E.1.I,E.constant (E1)
← F.1.I,D.1.I,E.constant (D1)
← E.1.O,D.1.I,E.constant (D2)
← E.1.I,D.1.I,E.constant (E2)
← D.1.I,E.constant (D1)
The first line is just relation F3. The second line is obtained by replacing F.2.I by E.O from relation D3, and so on. This substitution process can also be seen in the informationflow structure shown in Fig. 4. This structure presents all of thepossible paths of informationflow in the subset of the procedures we are considering.
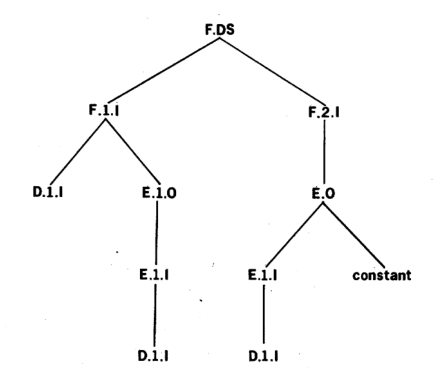
Figure 4 — Portion of the flow structure for Example 1
It shouldbe clear from this brief presentation that the infor- mation flow paths are easily computable from the relations which havebeen generatedindividually for each procedure. The current techniques of data flow analysis [2], [18] are sufficient to produce theserelations automatically at compile time. Furthermore, if a sufficiently precise design language is used, such that the relations can be generated from the design code, then the informationflow analysis can be done at design time. This justifies our earlier claim that the informationflow metrics, based on this analysis, can be made available early in the system development process. Having illustrated the underlying method of capturing the flows of information in an automatable way we will proceed in the next section to show how these flow paths can beused as the basis for measuring the complexity of software structures.
Complexity measurement
An information flow analysis was performed on the UNIX operating system and the global flows and local flows derived from the information flow analysis were used to obtain measurements for the UNIX system. These measurements, including the complexity measurements for each procedure, are presented inthis section. The local flows and global flows are used to operationallydefine the modules in the system and to reveal possible weaknesses in thedesign andimplementation of these modules. Also in the next section, the interfaces between the modules are examined placing emphasis on the coupling between the modules.
The metrics presented below operationallydefine a complexity value which attempts to measure the degree of simplicity of relationships betweensubsystems [16]. It should be kept in mind that the complexity of a given problem solution is not necessarilythe same as the unmeasurable complexity of the problem being solved. In the following text the terms complexity value, complexity of the problem solution, and complexity are all used interchangably.
The terms fan-in, fan-out, complexity, and module are specifically defined for information flow in order to present the measurements in this section. Fan-in and fan-out are described with respect to individual procedures.
Definition 5: The fan-in of procedure A is the number of local flows into procedure A plus the number of data structures fromwhich procedure A retrieves information.
Definition 6: The fan-out of procedure A is the number of local flows from procedure A plus the number of data structures which procedure A updates.
The complexity of a procedure dependson two factors: the complexity of the procedurecodeand the complexity of the procedure's connections to its environment. A very simplelength measure was used as an indexof procedure code complexity. The length of a procedure was defined as the number of lines of text in the source code for the procedure. This measure includes imbedded comments butdoes not include comments preceeding the procedure statement. Becauseof the spare use of imbedded comments and the typical occurrence of only one statement per line,this length measure is essentially equivalent to counting the number of statements in the procedure. Simple lengthmeasures, such as the number of source statements, are known to have positive correlations, albeit not the strongest correlations, with the occurrence of errors [8]. For example, Halstead's length or McCabe's cyclomatic complexity have shown stronger correlationsto errors and programming time than the simple length. We have chosen to use the simplest possible procedure measurement for convenience. Furthermore, we speculate that using any of the other procedure measurements, such as Halstead'sor McCabe's,should only improve the accuracy of the complete informationflow complexity measure given below. The connections of a procedure to its environment are determined by the fan-in and the fan-out. The formula defining the com- plexityvalue of a procedure is
length * (fan-in* fan-out) ** 2.
The term fan-in * fan-out represents the total possible number of combinations of an input source to an output destination. The weighting of the fan-in and fan-out component is based on the beliefthat the complexity is more than linear in terms of the connections which a procedure has to its environment. The power oftwoused in this weighting is the same as Brook's law of programmer interaction [9] and Belady's formula for system partitioning [6]. These interrelationships are generally very complicated for operating and other large-scale systems. The validity of the approach used in this paper, emphasizing theconnections to the environment, is supported by the material in this section and the following one showing a correlation between this measurementand system changes.
It is important again to note that the information flow analysis may be performed immediately after the design phase when theexternalspecifications have beencompleted but before the implementation hasbegun. The measurements taken at this point rely only on: 1) sufficient information to generate the information flow relations shown above, and 2) estimates of the code length in order to compute the complexity measures defined next. As we will seein the next section, the code length is only a weak factor in the complexity measure. Thus, apreciseestimate of length is not necessary and, in fact,this factor may beomittedwithout significantloss of accuracy. Based on these measures the design canbe evaluated for possible flaws before the investment in implementation has begun. This permits a design-measure-redesign cycle which is considerably shorter and less expensive than the more common design-implement-test-redesign cycle. The measurements may also be taken after the implementation phase using theexact code length for each procedure. The measurements taken at either point will show possible areas where redesign or reimplementation is needed, and where maintenanceof the system might be difficult. These measurements allow the design and implementation decisions to be evaluated for potential reliability problems.
The UNIX procedures and theirassociated complexities havebeen computed [19]. Procedures written in assembly language and certain memoryless procedures were eliminated from the information flow analysis. A memoryless procedure is one 'which is guaranteed to have kept no record of data supplied after it has completed its task [14]. Memoryless procedures are incapable of communicating information acrosssuccessive invocations and, hence, serve to terminate an information flow path. The set of local flows from all of the data structures wasused to compute the procedure complexities. Later in this section the complexity of a procedure contained in a specific module is computed using only the local flows for thedata structure associated with that module.
The procedure complexities varying between 4 and 27 432 000 represent a broad spectrum of complexities. Readers unfamiliar with the UNIX system should find this wide range believable UNIX contains some very simple and easy to understand procedures and some extremely difficult to understand procedures. A distribution of theorder of complexity of UNIX procedures is given in Fig. 5.
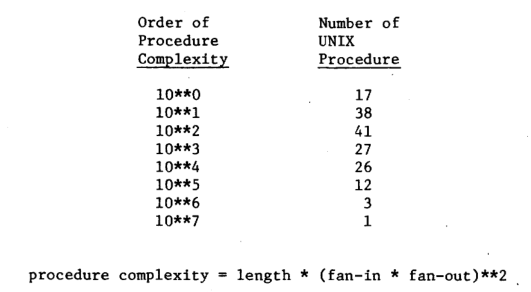
Figure 5 — Distribution of procedure complexities
The procedure complexities reveal three potential problem areasina given procedure. First, the measurements show procedures which possibly lack functionality[25]. A high fan-in and fan-out reveals a large number of connections of that procedure to its environment indicating the procedure may perform more thanone function.Second, a high complexity shows stress points in a system i.e., a procedure with high information traffic through it). At such a stress point it is difficult to implement a change to the specific procedure because of thelarge number of potential effects on its environment and, indirectly, on other procedures. The thirdarea indicated by these measurements is that of inadequate refinement. The inadequaterefinementcould be caused by either a problem in implementation or design. An implementation difficulty would be indicated by a large procedure, i.e., many lines of code. Perhaps the procedure should be divided into two or more separate procedures. The inadequate refinementcould also appear as a missing level of abstraction in the design process. This would be indicated by a large fan-in or fan-out.
The procedure complexities are used, in turn, to establish module complexities. The operational definition of module adopted for use in this paper reflects Pamas' theory of hiding design decisions within a module [30].
Definition 7: A module with respect to a data structure D consists of those procedures which either directly update D or directly retrieve information from D.
The information flow analysis was performed for each data structure in the UNIX operatingsystem. The modules in UNIX simply consist of those procedures which read from orwrite to a data structure. A module is named by the data structure which it contains. Only a subset of the UNIX modules is presented in this section, since the other modules are relatively trivial. Fig. 6 displays the modules discussed inthis paper and their descriptions.
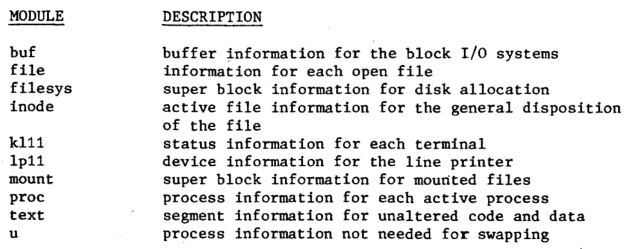
Figure 6 — UNIX module descriptions
Examination of the global flows in each module reveals the number of procedures in each module and all possible inter connections between the module procedures and the data structure. Fig. 7 displays the number of read only procedures, write only procedures, and read-write procedures for each module.Another interesting measurement easily calculated for a given module is the number of paths of information possible among these procedures through the module's data structure. The formula used to calculate the number of global flows is
(write * read) + (write read-write) + (read-write * read) + (read-write * (read-write — 1)).
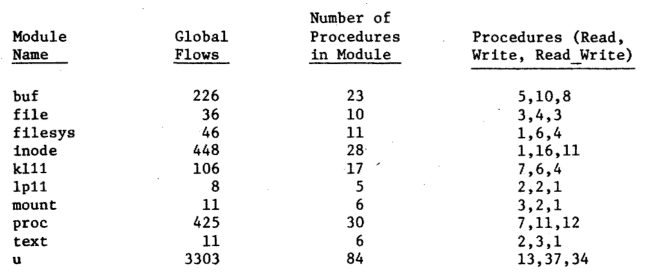
Figure 7 — Global flows for UNIX modules
This shows all possible flows of information from those procedures which can update thedata structure (write and readtwrite) to all procedures which retrieve information from the data structure (read and read-write).
The global flows measurement will indicate overloadeddata structures.Fig.7 shows that the U datastructure has 3303 global flows with 84 procedures. Clearly, the U datastructure, as compared to all other data structures, is extremely overloaded. The primary reason for this is that one function of this structure is to pass error codes across levels in thesystem.Since overhalf of the procedures have access to the U data structure, the module is so complex that is distorts other measurements. Accordingly, the U structurewill not be given furtherconsideration in this analysis. UNIX is not the only operating system with a complex, overloaded data structure. IBM OS/360 has a large global data structure called the communications vector table. The inability to control accessto this table has led toa number of reliability and adaptability problems [25].
The complexity of a module is defined to be the sum of the complexities of the procedures within the module. It is interesting to note that the majority of a module's complexity is due to a few very complex procedures. Fig. 8 shows the modules, their complexity, the sum of thethreelargest procedures' complexities, and the percentage of that sum to the module complexity. In all but one case thethree most complex procedures constitute more than 85 percent of the module complexity.
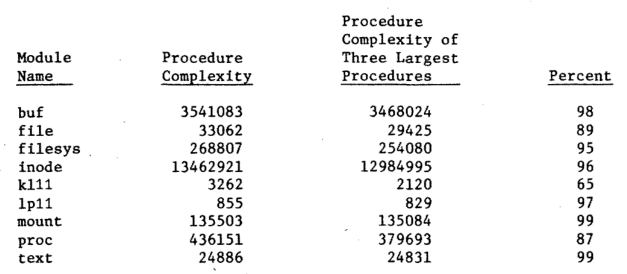
Figure 8 — Percent of module complexity for largest procedures
The global flows and the module complexities show four areas of potential design or implementation difficulties for the module. First, as with the U structure the global flows indicates a poorly refined i.e., overloaded) data structure. Redesign of the data structure to segment it into several pieces may be a solution to this overloading. Second, the module complexities indicate improper modularization. It is desirable that a procedurebe in one and only one module and, as a by product of computing the module complexities, violations of this property will be revealed. This is particularity important when implementation languages are used which do not contain a module construct and violations of the module property are not enforcable at compile time. High global flows and a low or average module complexity indicate a third area of difficulity, namely,. poor internal module construction. Numerous procedures have direct access to the data structure but there is little communication among theprocedures. Fourth, a low global flows and high module complexity may revealeither a poor functional decomposition withinthe module ora complicated interface with other modules.
In this section we have presented the definitions of procedure and module complexity based on. the connections established by an informationflow analysis. Several examples have been given illustrating how these complexity measurements canbe interpreted toreveal design or implementation problems. Finally, the measurements of a specific operating systemwere shown. In the next section we will examine the relationship between these complexity measurementsand changes in the UNIX system.
Correlation of information flow complexity measurements to change
The correlation between the complexity measurements and a collection of changes in the UNIX system is investigated in order to furthervalidate the set of metrics presented in theprevious section. These changes, 80 of which involved procedures used in the information flow analysis, were obtained by the authors from the UNIX users group [15]. These data will be used to determine the ability of the complexity measurement to predict procedures which, with a high probability, will contain needed alterations. The program changes measureof software quality has been used in previous studies [5], [13]. Basili and Reiter [5] refer to program changes as "...a reasonable measure of the relative number of programming errors..." and cite the prior work of Dunsmore and Gannon [13] showing a high (rank order) correlation between program changes and error occurrences. Because of this relationship between program changes and errors we will use these two concepts interchangeably in this section.
One of the design features observed by the module measurements was that of improper modularization, i.e., those procedures located in more than one module. It is the goal of modularization to ensure each procedure in one and only one module [30]. It is expected that procedures which violate this principle shouldbe more prone to errors due to their connections to more than one module. In the UNIX operating system there are 53 procedures in more than one module and 38of these were in the list of procedures containing changes. Fig. 9 displays the distribution of UNIX procedures in zero or one module and those contained in more than one module, the number of changes associated with these procedures, and thepercentage of procedures to be changed. A procedure may, according to our operational definition, be in no module because it does not directly access any data structure. The conclusion from this figure is simply that procedures which violate the modularity principle are more likely to require alteration. This conclusion is not at all surprising and documents the validityof the principles advancedunder the title of abstract data typing.
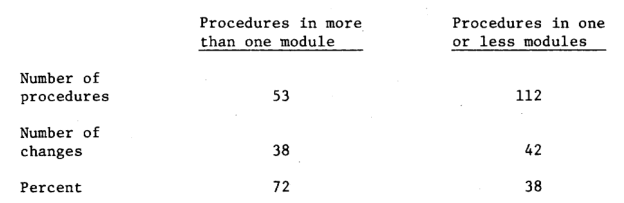
Figure 9 — Relationship of module violations to changes
The primary validationeffort involved a correlation of procedure complexity with the occurance of changes in the UNIX code. In ranking the proceduresaccording to their order of complexity we discovered that there is a strong correspondence between the changes to UNIX and high procedure complexity. Eleven out of the twelve procedures with complexity 10**5, and two out of the three procedures with complexity 10**6 required changes. The single procedure with complexity 10**7 did not require a change. However, this procedure, NAMEI, has connections to the system which are very complex and NAMEI would beextremely difficult to change [22]. Fig. 10 shows the number of procedures for each order of complexity, the number of procedures with corrections, and the percentage of those procedures containing changes.
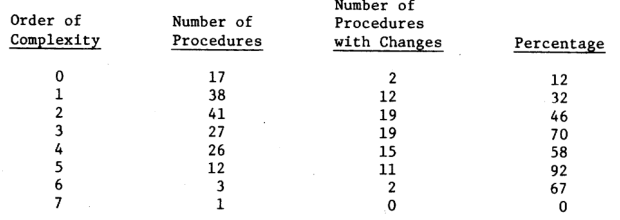
Figure 10 — Relationship of procedure complexity to changes
Levels 6 and 7 only involve four procedures and because of this small sample size, these levelswill be eliminated from the following analysis. The Spearman's r test [7] was used to correlate the order of complexity with the percentage of procedures containing an error. The resulting correlation coefficient is 0.94. The significance level of this correlation is 0.0214 indicatingthatthere is only a 2 percent change of arriving at this correlation through mere coincidence in the data. The significance levels for the correlationcoefficients reported in the rest of this section are similar to this 2 percent level.If the procedures at level 6and level 7 are included, by combining them with the procedures at level 5, thecorrelation coefficient remains at 0.94.
Additional analysis was performed to determine which of thefactors in the complexity formula contributed the most to this high correlation. The factors considered were length, (length ** 2), (fan-in * fan-out), and (fan-in * fan-out) ** 2.
The length of the UNIX procedures, measured in lines of source code, varied between 3 and 180. Using intervals of 20 lines of code, the distribution of procedures over those intervals showed that 53 percent of the UNIX procedures contain less than 20 lines of code, and that only 28 percentof those procedures contain an error, while 78 percent of the procedures with more than 20 lines of code contained errors. Due to the density of this distribution of length it was not possible to obtain a meaningful correlation coefficient usingthe Spearman r method. However, since most of the UNIX procedures are quite small we did not expect length to be a significantfactor in thecorrelation. This expectation was confirmed by a subsequent test.
The second factor analyzed was (fan-in * fan-out). Again, using Spearman's r correlation, a coefficient of0.83 was obtained. Thus, fan-in * fan-out does contribute significantly to the complexity analysis performed above.
The third factor considered was (fan-in * fan-out) **2. The intervals used in analyzing this factor were 10**(n/2). Fig. 11 displays a distribution of the eight intervals used. The Spearman correlation coefficient derived was 0.98.
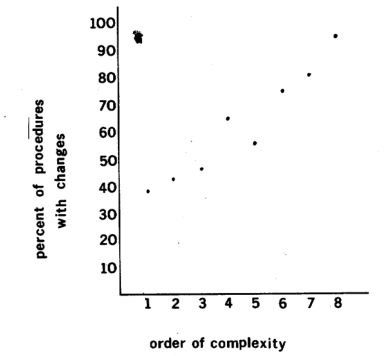
Figure 11 — Graph of (fan-in * fan-out)**2 correlation
The final factor considered was (length** 2). The intervals used for this calculation were 20 lines of code. As anticipated, a low correlation coefficient, only 0.60, was obtained. This result is significantly lower than the correlationcoefficients of those measures which incorporated aspects of the information flow.
After considering the above factors, we find that length actuallydetracts from the predictive accuracy of the complexity formula indicating that at least as far as UNIX is concerned length is not a reliable indicator ofprocedure complexity. However, the connections of a procedure to its environment, namely (fan-in fan-out) ** 2, is an extremely good indicator of complexity. The correlation coefficients and the level of significance for each coefficient are summarized in Fig. 15 in the finalsection.
Interface measurements
In the previous sections we have concentrated on the mea- surement of procedure and modulecomplexity and how to interpret these measurements in locatingpossible design andimplementation problems. In this section we present a set of measurements which focus on the interfaces which connect system components. The interface betweenmodules is im- portant because it allows the system components to be dis- tinguished and also serves to connect the components of the system together.
An often used designgoal is to minimize the connections among the modules [27] . Myers has defined six categories of coupling based on the data relationships among the modules [25] The informationflow metrics can recognize two of these categories, namely those modules that are termed content coupled and those that are termed common coupled. Con- tent coupling refers to a direct reference between the modules-. Thistype of coupling is equivalent to the directlocal flows. Common coupling refers to the sharing of a global data struc- ture and this is equivalent to the global flows measure.
The connections between two modules is a function of the number of procedures involved in exporting and importing information between the modules, and the number of paths used to transmit this information. A simple way to measure the strength of the connections from module A to module B is
(the number of procedures exporting information from module A + the number of procedures importing information into moduleB) * the number of infor- mation paths.
Occasionally, the informationflowing from A to B will pass through another procedure (see Fig.12). These additional procedures between A and B are not in any module and their only purpose is totransfer information from A to B perhaps in an altered form e.g., changing the scale of a value passed from A to B). Inorder to measure thecoupling from module A to module B, the following threefactors must be taken into con- sideration: 1) the direct flow ofinformation frommodule A to module B, 2) the flow of information frommodule A to the transfer procedures, and 3)the flowof information from the transfer procedures to module B. The coupling measurements are derived by applying the above mentioned formula tothesethree factors.
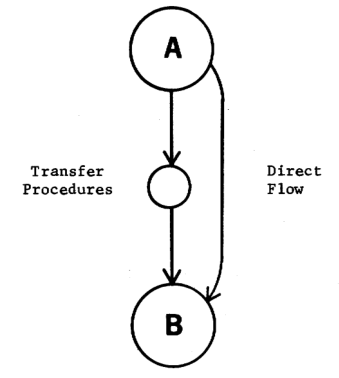
Figure 12 — Description of the interface between two modules
Fig. 13 displays these measurements for the UNIX modules. In this figure thecoupling through direct flows is given first and the coupling through the transfer procedures is in paren- thesis. Note that the coupling is not symmetrical. INODE is tightly coupled with BUF, but BUF is only loosely coupled with INODE.
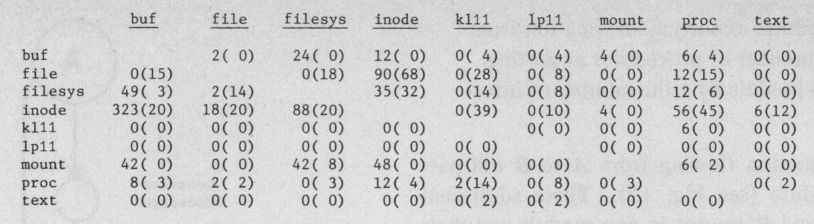
Figure 13 — Coupling through direct flows (coupling through transfer procedures)
The coupling measurements show the strength of thecon-nections between two modules. It canbe observed that the coupling measurements for the UNIX modules reveals very strong connections between INODE and BUF, FILE, FILESYS, and PROC. This strong coupling of INODE to the rest of the system indicatesthat a substantial change to the INODE mod- ule would strongly affect other system components. This measurement agrees with the fact that the INODE module plays a key role in the UNIX system. Coupling also indicates a measure of modifiability. If modifications are made toa particular module, the coupling indicates which other modules are affected and how strongly the other modules are con-nected. Thesemeasurements are useful duringthe design phase of a system toindicate which modules communicate with which other modules and the strength of that communication. During implementation or maintenance, the coupling measure- ment is a tool to indicate what effect modifying a module will have on theother components of a system.
We believe that the interface measurements presented in this section are significant and further demonstrate the wide range of measurements which can be derived from an information flow basis. However, we have found no satisfactory way to thoroughly validatethese measurements usingthe UNIX data we currently possess. Additional experiments, using other large-scale systems as vehicles, will be necessary in order to assess the utility of the interface measurements.
Summary
The procedure, module, and interface measurements presented in this paper reveal potential design and implementation difficulties. Fig. 14 summarizes the measurements together with theparticular design and implemention features associated with the measurements.
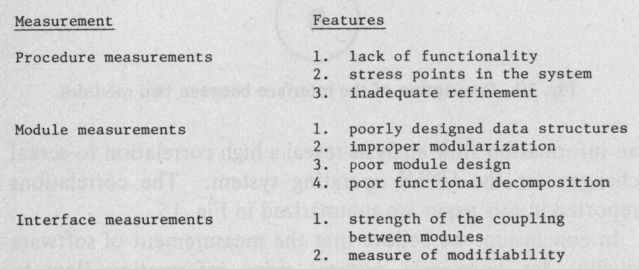
Figure 14 — Summary of the measurements and corresponding features
In addition to locating possible design and implementation weaknesses, the complexity measurements obtained through an information flow analysis reveal a high correlation to actual changes for the UNIX operating system. The correlations reported in this paper are summarized in Fig. 15.
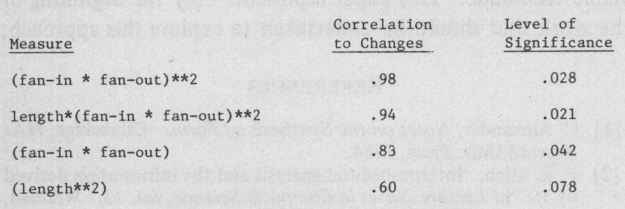
Figure 15 — Summary of correlation coefficients
In conclusion, we believe that the measurement of software quality for large-scale systems using informationflow to represent the system interconnectivity is an important and viable technique. This paper represents only the beginning of the work that shouldbe undertaken to explore this approach.
References
- C. Alexander, Notes on the Synthesis of Form. Cambridge, MA: Harvard Univ. Press, 1964.
- F.E. Allen, Interprocedural analysis and the information derived by it, in Lecture Notes in Computer Science, vol. 23. Wildbad, Germany: Springer, 1974, pp. 291–321.
- F. T. Baker, Chief programmer team management of production programming, IBM Syst. J., vol. 11, pp. 56–73, 1972.
- V. R. Basil and A. J. Turner, Iterative enhancement: A practical technique for software development, IEEE Trans. Software Eng., vol. SE-1, pp. 390–396, July 1975.
- V. R. Basili and R. W. Reiter, Jr., Evaluating automatable mea- sures of software development, in Proc. Workshop Quantitative SoftwareModels, Oct. 1979, pp. 107–116.
- L. A. Belady and C. J. Evangelisti, System partitioning and its measure, IBM Res. Rep. RC7560, 1979.
- H. M. Blalock, Social Statistics. New York: McGraw-Hill, 1960.
- J. B. Bowen, "Are current approaches sufficient for measuring softwarequality?," in Proc. ACM Software Quality Assurance Workshop, vol. 3, no. 5, 1978, pp. 148–155.
- F. P. Brooks, Jr., The Mythical Man-Month: Essays on Software Engineering. Reading, MA: Addison-Wesley,1975.
- R.N. Channon, On a measure of program structure, Ph.D. dissertation, Carnegie-Mellon Univ., Pittsburgh, PA, Nov. 1974.
- E. W. Dijkstra, The structure of the T.H.E. multiprogramming system, Commun. Ass. Comput. Mach., vol. 11, no. 5, pp. 341– 346, 1968.
- R. C. Dolotta et al., The programmer's workbench, Bell Syst. Tech. J., vol. 57, no. 6, pp. 2177–2200, 1978.
- H. E. Dunsmore and J. D. Gannon, Experimental investigation of programming complexity, in Proc. ACMINBS 16th Annu. Tech. Symp. Syst. Software, Washington, DC, June 1977, pp. 117–125.
- J. S. Fenton, Memoryless subsystems, Comput. J., vol. 17, no. 2, pp. 143–147, 1974.
- M. Ferentz,Rockefeller Univ., private correspondence, 1979.
- T. Gilb, Software Metrics. Cambridge, MA: Winthrop, 1977.
- M. H. Halstead, Elements of Software, Science. New York: Elsevier, 1977.
- M. Hecht, Flow Analysis ofComputer Programs. New York: North-Holland, 1978.
- S. M.Henry, Information flow metrics for the evaluation of operating systems'structure, Ph.D. dissertation, Iowa State Univ., Ames, IA, 1979.
- P. A. Janson, Using type-extension to organize virtual memory mechanisms, IBM Res. Rep. RZ858, 1977.
- E. L. Ivie, “The programmer’s workbench—A machine for software development,” Commun. Ass. Comput. Mach., vol. 20, pp. 746–753, Oct. 1977.
- J. Lions, “A commentary on the UNIX operating system,” Dep. Comput. Sci., Univ. of New South Wales, 1977.
- B. Liskov, “The design of the Venus operating system,” Commun. Ass. Comput. Mach., vol. 15, no. 3, pp. 144–149, 1972.
- T. J. McCabe, “tA complexity measure,” IEEE Trans. Software Eng., vol. SE-2, Dec. 1976.
- G. J. Myers, Software Reliability Principles and Practices. New York: Wiley-Interscience, 1976.
- —., The Art of Software Testing. New York: Wiley-Interscience, 1979.
- D. L. Parnas, “Information distribution aspects of design methodologies,” in Proc. IFIP 1971, New York: North-Holland, pp. 339–344.
- —, ‘On the design and development of program families,” /EEE Trans. Software Eng., vol. SE-2, pp. 1–9, Jan. 1976.
- —, “Some hypothesis about the ‘USES’ hierarchy for operating systems,” Tech. Hochschule Darmstadt, Fachbereich Inform., Darmstadr, West Germany, Res. Rep. BSI 76/1, 1976.
- —., “Use of abstract interfaces in the development of software for embedded computer systems,” Naval Res. Lab., Washington, DC, NRL Rep. 8047, 1977.
- C. V. Ramamoorthy and R. T. Yeh, Tutorial: Software Method- ology. New York: IEEE Computer Society, 1978.
- D. M. Ritchie and K. Thompson, "The UNIX time-sharing sys-Procedure measurements" Commun. Ass. Comput. Mach., vol. 17, PP. 365–375, July
- D. Schuster, “On the specification and quantification of software performance objectives,” in Proc. ACM 1977 Annu. Conf., Oct. 1977, pp. 181–188.
- N. L. Soong, “A program stability measure,” in Proc. ACM 1977 Annu, Conf., Oct. 1977, pp. 163–173.
- W. P. Stevens, G. J. Myers, and L. L. Constantine, “Structured design, ” IBM Syst. J., vol. 2, pp. 115–139, 1974.
- T. A. Thayer, M. Liplow, and E. C. Nelson, Software Reliability. New York: North-Holland, 1978.
- E. Yourdon, Techniques of Program Structure and Design. Englewood Cliffs, NJ: Prentice-Hall, 1975.
- B. H. Yin and J. W. Winchester, “The establish and use of measures to evaluate the quality of software designs,” in Proc. ACM Software Quality Assurance Workshop, vol. 3, no. 5, 1978, pp.
- E. Yourdon, Techniques of Program Structure and Design. Englewood Cliffs, NJ: Prentice-Hall, 1975.
- B. W. Boehm, “Software engineering,” IEEE Trans, Comput., vol. C-25, pp. 1221–1241, Dec. 1976.