
Abstract
Content
- Introduction
- 1. Relevance of the topic
- 2. The purpose and research tasks
- 3. Scientific novelty
- 4. Overview of social network modeling methods
- 5. Temporal modeling of social media
- 6. Clustering communities
- 6.1 General concepts of clusters
- 6.2 Main stages of cluster analysis
- 6.3 Clustering of VKONTAKTE communities
- 7. Models of information dissemination
- 7.1 Wavelet analysis
- Conclusions
- Source list
Introduction
The term social network
(from the English social networks) was introduced in 1954 by sociologist James Barnes. In his work, he described the social network as a system of points, the points of this system are people[1].
Currently, social networks are the most popular websites in the world, after search engines. And if the popularity of search engines is quite understandable, then what is the popularity of social networks?
Social networks are multifunctional and have a very simple format. They can be used for personal communication, job search, promotion of business and political ideas, and search for cooperation options.
68% of heads of state and government from 193 UN member States have their own social media accounts.
A huge plus of social networks is the absence of viruses.
According to the international Agency We Are Social, which specializes in research in the field of social media:
1. Relevance of the topic
The relevance of the research topic is due to the growing popularity of social networks in society, and their further development largely determines the prospects for the development of the Internet.
Facebook instagram, Vkontakte, Odnoklassniki, Twitter, and Facebook are popular social networks. In Russia, the most promising and popular network is the Vkontakte network. Its audience is 77% of the total mobile audience in Russia, which is 97 million active users.
2. The purpose and research tasks
The aim of the research is to develop and study mathematical models for describing the behavior of social groups.
The main objectives of the study include:
- Development of techniques for clustering communities in social networks.
- Time modeling of the number of agents in communities.
- Development of a model for information dissemination in the network.
Object of research: communities of the Vkontakte social network.
3. Scientific novelty
A mathematical model of community clustering is proposed. Mathematical models are proposed that explain the formation of a family of groups as a result of the activation of the mass of individuals and their subsequent differentiation into groups of different bias. A mathematical model describing the life cycle of communities in social networks has been developed. The processes of information distribution in the network are modeled on the basis of wavelet analysis.
4. Overview of social network modeling methods
When studying social networks, you can identify the main stages: to determine the statistical properties that characterize the behavior of systems with a network structure; to obtain statistical data; to create network models; to predict the behavior of systems based on the measured properties.
When modeling social networks, as a rule, several main characteristics are used:
Social networks are divided into formal and informal, vertical and horizontal. Informal social networks are based on informal connections, in formal social networks, the roles, rights, and responsibilities of each participant are clearly defined.
In social networks based on the vertical feature, the top is formed by the team
, which consists of leaders and their closest assistants. The team forms the group's strategy, interaction, confrontation, or collaboration tactics with external social networks.
Social networks based on the horizontal principle are a community of agents of approximately the same social status and, accordingly, influence [3].
5. Temporal modeling of social media
Life cycle of social groups
Social networks can be used as a tool to inform people about a new product launched on the market. Social media can be used as a mechanism for distributing discount coupons and offers, which makes them a means of implementing product lifecycle strategies. Social networks can be used for advertising.
Therefore, social media strategies go side by side with product lifecycle strategies, and both types of cycles are relevant for marketers in the decision-making process[4].
Each product or service has a lifecycle, and social media communities have their own specific lifecycle scenario. Humans also have a life cycle that begins at birth and ends at death. They go through infancy, growth, maturity, and death.
Knowing the stages of development of groups, you can use the stages of growth and maturity of groups, which are excellent platforms for promoting business using social networks.
The life of the group or the entire network begins with an initial zone followed by a resurgence of rumors
(the sharp increase in participants), and then decline, hollow doubters
(or valley of doubt), when part of the members leaves the group, then the growth in the number of members of the network to the zone of stability and the inevitable death of the project and replace it with a new, more relevant.

|
|
|
Starting in the summer of 2014. we collected initial data for several Vkontakte groups. The group Reports from the militia of Novorossiya
was the most significant from the point of view of cycles of life groups.
The group came to attention on June 1, 2014, when it had 12 thousand subscribers, and in five days their number exceeded 33 thousand.
The figure shows the increase in the number of subscribers of the group, on the y – axis shows the number of subscribers by X – date.

|
|
|
Considering the history of groups as a time series, we have identified the seasonal component. As you can see, the group members are most active in the autumn months, and the least active in August.
Analysis of activity by day of the week showed that the smallest number of participants participate in discussions on Saturday.

|
|
|
6. Clustering communities
6.1 General concepts of clusters
Cluster analysis is one of the possible approaches to processing statistical data in order to separate objects into groups with similar characteristics.
The term cluster
first came into scientific use in mathematics when the apparatus for cluster analysis of multidimensional data was formulated in the late 1930s. The word cluster
can be translated from English as a brush, cluster; cluster, concentration; group. The economic interpretation of the word was introduced into scientific use in 1990. by the American economist M. Porter
Cluster analysis can successfully solve such tasks as primary scoring of risks specific to the activities of banks and insurance companies, and evaluating the effectiveness of operations on the securities and derivative financial instruments market. Other examples may include tasks related to the need to cluster suppliers, competitors, and sales markets, and identify similar production situations where a defect occurs...
Cluster analysis is a set of methods and algorithms designed to divide the original set of objects into groups (clusters) so that objects with similar values of properties and attributes fall into one cluster[5].
6.2 Main stages of cluster analysis
Main stages:
6.3 Clustering of VKONTAKTE communities
However, social networks have become not only an inexhaustible source of business opportunities. Experts note the rapid politicization of social networks. This involves the formation of various online political communities, and among them can be both Pro-government (Patriotic) and opposition (from constructive critics to radicals and extremists)[6].
Groups of different directions were used for clustering. To assess the level of politicization of social networks, the possibility of intersecting their participants, and the probability of moving participants from one cluster to another, three types of communities were considered.
- 1. Completely policy-neutral interest groups (fishing, book lovers, travelers, animal lovers, etc.).
- 2. News communities and communities created to discuss political news, political parties, and TV channels.
- 3. The Third type of groups is similar to communities of the second type, but with a pronounced critical note, "critics".
To solve this problem, we considered 38 communities.
As a result of clustering, it can be concluded that in General, the considered contingent of participants is divided into five clusters. A cluster of communities that are completely indifferent to politics (cluster 2); a cluster of people who have their own Hobbies and prefer to receive brief political news. A cluster of critics and two clusters of political orientation, and in one of them only positive news is posted in groups, in the other minor criticism is possible.

|
|
|
The data obtained do not contradict the data from other sources[7]. As a rule, only a small part of society (up to 10%) is politically active, but research shows that the political activity of the population is growing[8].
7. Models of information dissemination
One of the essential aspects of studying social networks is the process of spreading information on the network. The term information dissemination
refers to the process by which some information object is distributed through communication channels in time and space among network nodes. There are several different approaches to modeling the information dissemination process.
One of the methods used to model the process of information dissemination is modeling based on analogies with physics and medicine, which is called the seepage and infection or epidemic model [9-10].The speed of information dissemination is high, similar to a normal epidemic, provided that the information is of General interest. The spread begins with a small number of groups and gradually moves to an increasing number of them, reaches a peak, followed by a decline.
As a rule, the distribution process involves three stages: the formation of the distribution base (slow growth), sharp growth, and the third stage-saturation and decline of interest in information.
To develop a model for the dissemination of information, statistics were collected for the first three days after the first publication of information about the decree in the media. Decree on determining for humanitarian purposes the categories of persons who have the right to apply for citizenship of the Russian Federation in a simplified manner
.
The figure shows how the area of information distribution changed over the course of three days, and the total user coverage for these three days is taken as 100%.

|
|
|
7.1 Wavelet analysis
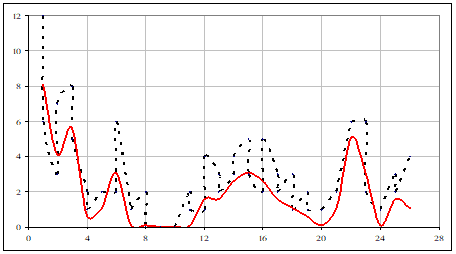
A model of information distribution in the network was developed using wavelet analysis. The peak of interest in the news is the second day of the event, the information remains relevant for five days if it is really important news. In General, interest in the news disappears on the eleventh day.
We have given the results of applying wavelet transformations. The x – axis shows the points of the time interval, and The y – axis shows the number of Vkontakte groups that published the news and joined the discussion. The dashed line shows the source signal, i.e. statistical data, and the red color shows information cleared of noise.
|
|
|
Similar transformations were applied to statistics on the number of views and reposts of information. The obtained data is processed in the Statistica package in order to predict the duration of interest
in the information, see Fig. The blue color in the figure shows the curve for changing the number of views, the red color shows the interpolating polynomial, and the dashed line shows the predicted number of views in the following hours. As you can see, interest in the news will continue, but its level will significantly decrease. Local minima correspond to night time. The maximum number of views falls on the second day, and interest begins to wane in the following days.

|
|
|
Conclusions
During the master's work, the existing models describing social networks were studied, statistics were collected that prove the popularity of networks, the need and feasibility of their research.
We have developed models for clustering Vkontakte communities that allow us to predict the migration of subscribers to groups/publics.
Using time-based forecasting methods, an algorithm for predicting the number of participants in groups was developed.
Since the modeling of social processes has many different goals and objectives, an important aspect of the work performed is the creation of a model for the dissemination of information in the network based on a large number of statistical data collected by the author.the terms of relevance and popularity of news distributed on the network are estimated.
To perform these tasks, the author created and analyzed an extensive statistical database, which included data from global Internet statistics on users, their personal characteristics, the rate of user penetration into the Internet, the number of messages published by the authors in social networks, the level of feedback from the network (likes, reposts, comments) on the information received.
Statistical data was collected by the author for three years, in addition to publicly available sources, a tool such as online surveys was used. The results are published.
The results of the work allow us to develop and justify mechanisms for effective information management and promotion of information in social networks.
Source list
- Barnes, J. A. Class and committees in a Norwegian Island parish// HumanRelations.- 1954. V.7.-P 39-58.
- DIGITAL 2019: THE RUSSIAN FEDERATION [Электронный ресурс]: / DataReportal. Режим доступа: http://www.journ.msu.ru/downloаds/smi_intеrnеt.pdf.
- Свинцовский А.А. Теоретические аспекты моделирования социальных сетей. Информационное общество, 2013, вып. 6, с. 16-21.
- Прогнозирование временных рядов в пакете Statistica : методические указания / сост. Л.И. Дубровская. – Томск : Томский государственный университет, 2012. – 36 с.
- Кластерный анализ и сегментация. [Электронный ресурс]/ Режим доступа: http://www.tidydata.ru/segmentation.
- Федорченко С.Н. Глобальное исследование политизации социальных сетей // Обозреватель - Observer, 2016. №8(319). С. 57-67.
- 13 малоизвестных аналитических инструментов для сообществ «ВКонтакте». Нетология. [Электронный ресурс]/ Режим доступа: https://netology.ru/blog/13-maloizvestnykh-instrumentov-dlya-raboty-s-soobshchestvami-vkontakte.
- Манипуляция обществом или истинный размер пяти процентов. Режим доступа: https://alex-leshy.livejournal.com/480772.html.
- Губанов Д.А., Новиков Д.А., Чхартишвили А.Г. Социальные сети: модели информационного влияния, управления и противоборства. 3-е изд., перераб. и дополн. М.: МЦНМО, 2018. – 224 с.
- Губанов Д.А., Новиков Д.А., Чхартишвили А.Г. Модели влияния в социальных сетях // Управление большими системами. 2009. № 27. С. 205-281.