Annotation
Anokhina I.Yu., Roshchina E.V., Kushnirenko Ye.N INFORMATION IMPACT MODELING IN SOCIAL NETWORKS. Modeling informational impact in social networks. The article discusses the modeling of conflicts, disputes, discussions in social networks. A logistic model was constructed with a high degree of accuracy, which allows to estimate the impact of the participants personal characteristics in the discussions on the dispute outcome, which was considered as a game of two community members groups with alternative opinions.
The problem formulation
A distinctive feature of modern society is its constant modernization. This necessitates the study of various social processes, not only for the purpose of their analysis, but also for the purpose of forecasting. Social networks have become an important tool for public opinion impacting. These may be an economic nature affairs, for example, product advertising, brand promotion, market penetration, or arising in the political and social spheres.
Information showdowns
are increasingly being conducted online. For example, in order to remain popular in politics it’s not enough to appear on the TV screen only, so every politician has his own groups and accounts in social networks.
To win the information battle, teams of specialists are involved. For example, trolls are complete units of the information war. They lead discussions, operate on facts.
As Warren Dixon’s studies (Containment Control for a Social Network with State-Dependent Connectivity
) showed, mathematical modeling can be applied to social networks to control the user groups behavior and manipulate public awareness in the interests of the state [1].
As a rule, the most pressing topics at the moment are discussed on social networks. By researching them, you can predict the reaction of the community to certain events, decisions, laws.
Based on the foregoing, the task was set to analyze various options for discussing problems in social networks and to develop an optimal version of the behavior model in the discussion process.
The paper examines the aspects of theoretic-game models of information warfare, in which players (the most active participants in the discussions) impact on social network elements, i.e. group visitors are held an interested in to be the winner in the dispute.
The authors considered several options for discussing topics that caused lively debate in the network. The questions concerned both household topics and religious, political, historical ones.
Each argument was seen as a game between groups with antagonistic opinions [2]. In each group, one / two leaders and a support group was elected. Then the outcome of the game was analyzed. The winner was who received the maximum number of likes and comments in support of his opinion and some of the doubters became his supporter.
Table 1 shows an example of the source data, which were used for modeling afterwards. In the column education
, the letter B indicates persons with higher education. The parameter attitude
was indicated as 0, in case of disagreement with the opinion expressed, and 1 otherwise.
Table 1. Source data for modeling
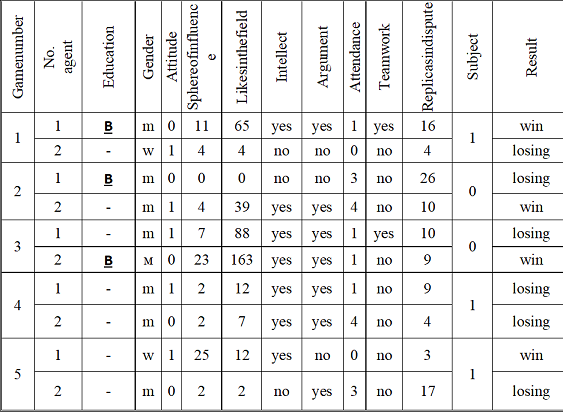
The sphere of impact was understood as the number of people who agree with the agent, for example, for game No. 1, the number of people who agree with the opinion of agent 1 was 11, and the support of the opinion expressed was estimated by the total number of likes for the replicas. In addition, the level of intelligence and argumentation in the dispute was assessed using the expert’s assessment
.
In addition, indicators such as the presence frequency
of the agent in the group were evaluated. Users who visit the group less than once every 2-3 days, marked 0 as rarely visitor; 1 – approximately once every two to three days, 2 – every other day, 3 – daily.
Teamwork was evaluated. The number of replicas in the dispute was taken into account. The dispute topic was divided into two subtopics, household topics, and religious. Political topics included truly political debates, as well as issues related to the interpretation of historical events. Such topics were marked 0.
While watching the game, discussions lasting from 20 hours to three days were usually considered.
At the first stage of modeling, a factor analysis was carried out to determine which of the factors listed above play a significant role in the results of the discussion. Table 2 shows the results of calculating factor loads. Note that the dispersion proportion is 90% that indicates the model accuracy.
Three factors were identified. The first factor establishes the relationship between gender and the chosen topic. As a rule, women inclined to everyday topics and often win in discussions.
The second factor includes the level of education and attitude to the chosen topic.
The third factor includes the level of intelligence and the degree of argumentation in the dispute.
The influence of the remaining parameters was considered as insignificant.
The last row of Table 2 (Prp.Totl) indicates the dispersion proportion explained by each factor [3, 4].
Table 2. The results of factor analysis
| Factor 1 | Factor 2 | Factor 3 | |
| Education | -0,21 | 0,85 | -0,25 |
| Gender | 0,78 | 0,11 | 0,48 |
| Attitude | -0,18 | -0,87 | -0,26 |
| Intellect | -0,08 | -0,45 | 0,60 |
| Argument | 0,05 | 0,05 | 0,93 |
| Subject | -0,91 | 0,08 | 0,15 |
| Prp.Totl | 0,22 | 0,25 | 0,23 |
Since the task was to predict the outcome of the dispute depending on the participants personal characteristics, the data were converted and used to calculate the parameters of the logistic regression. Logistic regression allows you to evaluate the relationship between binary variables that take two values: 0 and 1.
For calculations, a model is used:
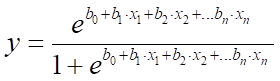 (1)
(1)
where b0, b1 ... bn are the logistic regression coefficients, n is the number of independent variables.
Processing was carried out in the Nonlinear Estimate module of the Statistica package.
Figure 1 shows the results of calculating the regression parameters. The p-level of the hypothesis is indicated on the panel of the dialog for displaying results. p-level less than 10%, what allows the use simulation results.

Figure 1 – Parameters of logistic regression
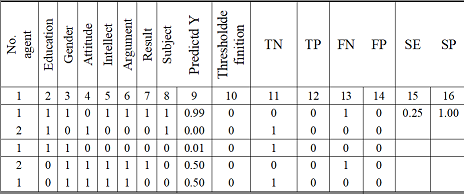
To assess the quality of the constructed model, it is necessary to evaluate the parameter Classification of cases. Figure 2 shows a table with the number of observations that were correctly and incorrectly classified in accordance with the obtained model.
When constructing the ROC-curve along the Y axis, the sensitivity of SE is plotted, and along the X axis are the values of the FPR parameter.
The analysis data are shown in table 3.
Table 3. Results of ROC analysis
To assess the quality of the constructed model, the ROC analysis curve is constructed. It is shown in Fig. 1. On the Cheddock scale, the model quality can be considered excellent.

Figure 2. ROC analysis curve
Conclusion
As studies have shown, the intelligence, dispute argumentativeness and education level has the greatest impact on the results of the game. A large number of friends, like trolls have, isn’t essential. It is also irrelevant whether the debater is a regular in the community or his visits are irregular. Women prefer everyday topics and when discussing political topics they rarely pretend to be leaders.
Literature
1.Air Force research: How to use social media to control people like drones
– Режимдоступа: ARS Technica.
2. Шведовский В. А. Социолого-математические модели в исследовании социальных процессовАвторефератдиссертации на соискание учёной степени доктора социологических наук. – М. Российский государственный социальный университет.: , 2011. – 43 с.
3. Годин, А. М. Статистика: учебник / А. М. Годин. – Москва: Дашков и К°, 2012.
4. Боровков, А.А. Математическая статистика: Учебник / А.А. Боровков. - СПб.: Лань, 2010. - 704 c.
5. Буре, В.М. Теория вероятностей и математическая статистика: Учебник / В.М. Буре, Е.М. Парилина. - СПб.: Лань, 2013.
6. Кобзарь, А.И. Прикладная математическая статистика. Для инженеров и научных работников / А.И. Кобзарь. - М.: ФИЗМАТЛИТ, 2012. - 816 c.
7. Анализ математических моделей Базель II / Ф.Т. Алескеров и др. - М.: Физматлит, 2014. - 288 c.