Novel genetic algorithm for scheduling of appliances
Author: Ugonna R. Anuebunwa, Haile–Selassie Rajamani, Prashant Pillai, Oghenovo Okpako
Source: IEEE PES Power Africa Conference, Livingstone–Zambia, 2016 – p.57–61
Abstract
The introduction of smart metering has brought more detailed information on the actual load profile of a house. With the ability to measure, comes the desire to control the load profile. Furthermore, advances in renewable energy have made the consumer to become supplier, known as Prosumer, who therefore also becomes interested in the detail of his load, and also his energy production. With the lowering cost of smart plugs and other automation units, it has become possible to schedule electrical appliances. This makes it possible to adjust the load profiles of houses. However, without a market in the demand side, the use of load profile modification techniques are unlikely to be adapted by consumers on the long term. In this research, we will be presenting work on scheduling of energy appliances to modify the load profiles within a market environment. The paper will review the literature on algorithms used in scheduling of appliances in residential areas. Whilst many algorithms presented in the literature show that scheduling of appliances is feasible, many issues arise with respect to user interaction, and hence adaptation. Furthermore, the criteria used to evaluate the algorithms is often related only to reducing energy consumption, and hence CO2. Whilst this a key factor, it may not necessarily meet the demands of the consumer. In this paper we will be presenting work on a novel genetic algorithm that will optimize the load profile while taking into account user participation indices. A novel measure of the comfort of the customer, derived from the standard deviation of the load profile, is proposed in order to encourage the customer to participate more actively in demand response programs. Different scenarios will also be tested.
Index Terms
Demand Side Response, Scheduling, Genetic algorithm, load profiles, smart homes, Smart metering
I.INTRODUCTION
Due to the rising demand for electricity and the need to reduce CO2 emission from fossil fuel sources, the need to devise efficient energy optimization has been highlighted in research on smart grids. This is to reduce the strain on energy demand, especially during peak demand, by encouraging consumers to shift their loads whenever they have the opportunity to do so. There are usually incentives attached to such changes in energy consumption behavior and as a result, dynamic pricing has been one of the most effective approaches implemented. Several load scheduling techniques which optimizes energy consumption to maximize profits are usually designed to reallocate certain loads whose usage can be moved around in time, from high energy times to times of the day when energy prices are lower [1– 8]. Several factors are considered before a decision to shift loads can be made. In this paper, the use of Genetic algorithm (GA) in searching for the optimal load profile that offers the maximum profit available and at the optimal times of the day, is studied. Accepting the optimized load profile is at the customer’s discretion as he would have the ability to override any undesired allocation offered by the scheduler.
A Genetic algorithm is a search algorithm based on Darwin’s mechanics of natural genetics and natural selection [9] [10]. It is in the class of evolutionary algorithm which uses mechanisms inspired by biological evolution such as selection, mutation, crossover (mating) and reproduction to produce optimal (superior) outcomes from an initial random processes [9]. GA was developed by John Holland and his team [10]. The major drawback of using GA is its slow convergence speed, but they are still one of the most widely used type of evolutionary algorithm. Its application can be found in several fields, and can provide one of the best scheduling techniques for finding optimal solutions to search problems[10].
The aim of this paper is to be able to show how GA can be used to create an optimal load profile from a forecasted load profile, while meeting certain constraints. The use of thresholds in determining when load scheduling can be permitted is a common approach in several scheduling routines. In this paper, threshold techniques are not used, and a novel way of scheduling using GA and measures of comfort is presented.
II.RELATED WORK
Several authors have written papers on how to implement and optimize various problems using different algorithmic techniques, and a number of them are used for mathematical analysis. These techniques include: Branch and Bound Algorithm, simplex method, Genetic Algorithm, Particle Swarm Optimization, Simulated Annealing, etc. These are available for solving various scheduling problems and are useful especially in determining the optimal distribution of load and cost requirements for scheduling using various constraints that are applicable.
The authors in [11] simulated a multi–criteria scheduling in the grid, based on Accelerated Genetic Algorithm. The need to improve and accelerate the computational and convergence speed of GA optimization was the aim in order to be able to solve large search space problems such as job scheduling in the grid. Due to the improved speed of convergence, such search problems can be implemented online. This was achieved by pruning the initial search space such that only realistic solutions were included at the initial random population. This pruning was achieved by adding heuristic algorithms to form chromosomes of the initial population and as the phase starts, a Minimum–Minimum, Maximum–Minimum and a Shortest Queue chromosome are created. Result obtained showed that convergence was faster while using Accelerated GA than conventional GA.
The authors in [12] applied GA in demand side management scheme whereby the aim was to minimize the peak–to–average ratio of the load profile in order to increase the need for the utilization of spinning reserves, thereby increasing the efficiency of the smart grid. Residential, commercial and industrial loads were considered and result showed that GA can be used to minimize these loads so that the use of the spinning reserve was made feasible, which in turn reduces overall energy cost.
The authors in [13] applied GA in appliance scheduling in order to effect an active demand response participation. The experiment was conducted based on the Nigerian energy market and the aim of the optimization sequence was to obtain a set of scheduled hourly energy consumption values for each load whereby the total energy cost is minimal. In order words, loads will be shifted based on the factor of price, whereby more loads will be drafted to times of the day when energy costs are minimal. Results showed a reduced energy cost for an hourly–based energy price profile.
The authors in [14] implemented a hybrid algorithm for energy management in smart grid using a combination of GA and particle swarm optimization. A need for this hybrid is to enable the scheduler to harness the positive attributes of both methods of load scheduling to enhance performance. Results showed a reduced energy consumption as well as reduced energy cost. A major drawback in using GA and several other optimization techniques in search problems is speed. This is why it may not be the best methods to use in real time applications. However, apart from the work done by the authors in [11], the authors in [15] also demonstrated how a unit commitment problem (also an optimization problem) can be solved using fuzzy logic which improved the speed of convergence.
Finally having considered the related work, we will be introducing the proposed method used in applying GA to optimize user’s load profile. Although speed of convergence was not considered a priority, desired results were obtained.
III.PROPOSED METHOD
Consider a household inhabited by a certain number of residents. Also consider that their day to day schedule varies from individual to individual, and from time to time. Information about their energy consumption behavior can be found on the load profile of the household. In order to understand the variation of energy consumption levels in such a way as to know how much change in energy we could implement, it is proposed that the standard deviation information of the load profile be used. In this way, we can devise a means whereby the optimization scheduler can identify and differentiate schedulable loads from non–schedulable ones, thereby eliminating having to guess what these loads would be.
Mathematically, a population standard deviation is calculated from the expression:
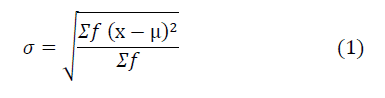
Where:
σ = Standard Deviation
µ = mean
f = Frequency of samples taken
x = Energy samples
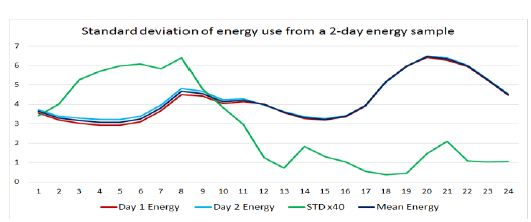
Figure 1. Standard deviation of 2 samples of Load profiles
Fig.1 shows a 2–day sample of historical load profiles of energy consumed by all the appliances in a household and the calculated standard deviation as obtained from [16].
A. GA Application to Load Profile Scheduling
In applying GA for load profile optimization, the population of the chromosomes are given by the time–slot intervals taken over a 24 hour period in a day and the value of load at each time. This means that for time slots taken hourly, there would be a corresponding population of 24 chromosomes in a day, as well as a population of 48 and 96 chromosomes for time slots taken every half–hourly and quarter–hourly, respectively. The fitness of each chromosome is evaluated by considering all the factors (Input variables) whose relationship with one another produces a finite value that represents the strength of each chromosome. The goal is to optimize the fitness value. A weak fitness value reduces the chances of accepting the proposed load profile for the day which invariably leads the optimizer to search for better optimal values. Also, the constraints are given as the limits of the forecasted load profile.
B. Fitness function derivation for chromosomes
The fitness function is key to designing an appropriate algorithm that generates a realistic load profile which the consumer can afford to accept. Derivation of the fitness function is based on the effect of the input variables which are assigned specific weights depending on their effect on the fitness function. The input variables are obtained from:
- The forecasted load profile which serves as a model for the quantity to be optimized.
- Randomly–generated load profile which serves as the initial population.
- Occupancy level to define when residents are at home.
- Standard deviation of load profile which tells very busy loads for less busy ones in any given time.
- Dynamic pricing of energy supply.
Table 1 shows the formulation of the fitness function with various weightings amongst the input variables. The way the fitness function is formulated as well as the weightings can affect results obtained. This therefore places the customer at the center of these outcomes whose desire is to promote their best interests.
Table 1: Fitness Function Application
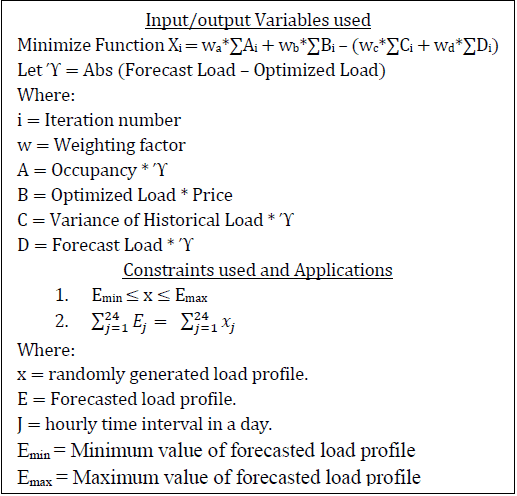
The physical translations of the input variables are given as:
Ύ = Effect of change in energy use on a house.
A = Energy change that effects minimal impact on occupants.
B = Change that effects energy cost reduction.
C = Change that occurs at least discomfort time.
D = Effect of change in forecast load profile.
Ύ gives the effect of the actual load change in each house. However if there is nobody in house, then the change has no effect on the residents. Hence in order to account for the impact of the change on the residents, it is proposed that Ύ is multiplied by the occupancy to give A. A is therefore a better measure than Ύ, and a low impact of change is favorable to the consumer.
Whilst impact is critical, cost has been found to be a major incentive to adoption of demand response programs. As such, the cost is also calculated and is given as B. A low cost is also considered favorable to the consumer.
C is the product of Ύ and variance of the historical load profile, which is specific for every household. With reference to Fig.1, we can observe that there is a relatively high deviation in appliance use from 1:00am till about 11:00am which shows that appliance use at those times are more favorable to be scheduled than appliance use at other times of the day. A high variance (standard deviation squared) means that the user is happy to change the load, while a low variance means that the user normally does not change his behavior at that time. A key novelty of this work is the measure of C which is proposed as a measure of the “User Comfort”. The values of the standard deviation in Fig.1 are all squared in order to amplify the HIGH’s and diminish the LOW’s before it is applied in C. This idea of measuring user comfort is critical to automated real systems. A high value of C is considered favorable.
D represents the effect of considering the forecasted load profile as well as the change in energy use on load optimization. The response will be beneficial if it is robust by permitting an active response in modifying its original value when the appropriate need presents itself. D is therefore used to determine how effectively a forecasted load profile should be used to generate the optimized load profile. A high value is considered favorable to the consumer.
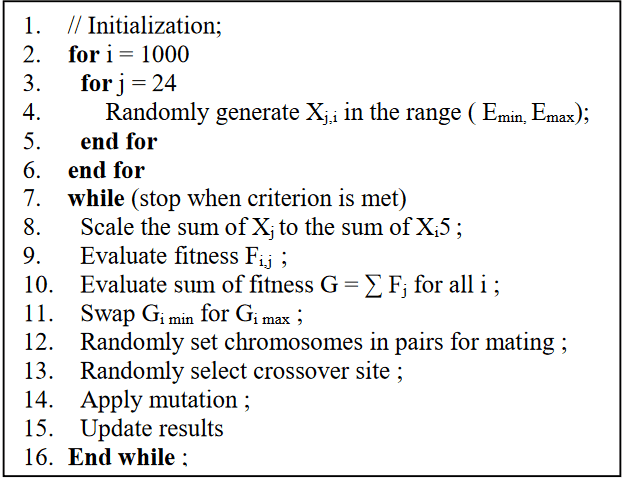
Finally in the proposed fitness function, the key elements are the cost benefit and the user comfort. We can also observe that in minimizing the fitness function, A and B have positive influence on the function while C and D are negative, hence the arithmetic signs used. Furthermore, each element can have a biased level of importance with respect to the other due to a perceived importance attached to them by the user. This is implemented by using the weightings. Table 2 shows the pseudo codes for the genetic algorithm applied to simulate a convergence of all the variables used after several iterations.
Table 2: Pseudo codes for Genetic Algorithm Procedure
In this paper, day ahead real time pricing scheme is being used although this is not implemented in the UK but in the US. It is assumed that such a pricing scheme could be used to engage the public consumer in a more responsive way to shifting load. The price was obtained from reference [17].
An initial population of a thousand samples of randomly generated load profiles bound by the constraint C are generated. The fitness value at any given time interval of each chromosome is calculated from the fitness function and the chromosome with the strongest fitness value is substituted with the chromosome with the weakest fitness value. The crossover point before mating and the choice of partner to be chosen are both randomly selected. The weightings are all initially set at the same value of 1, which means they all have the same impact.
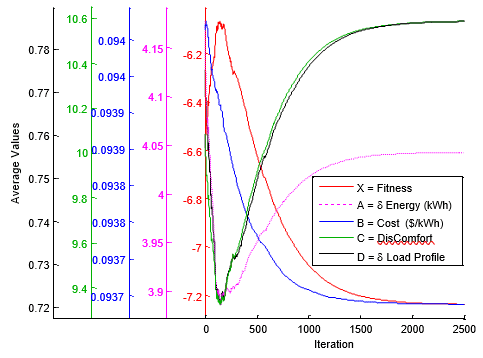
Figure 2. Graph of Convergence of variables with iteration.
With the fitness function as defined in Table 1, we were able to generate the graph of Fig.2. The effects of input variables A and B were positively considered while C and D were negatively considered. This lead to the minimization of the fitness function and the cost, but it left the change in energy at a mid–point between the minimum and maximum values. This is as expected because A is acting as a penalty to reducing cost since an attempt to minimize cost will tend to force the change in energy to increase.
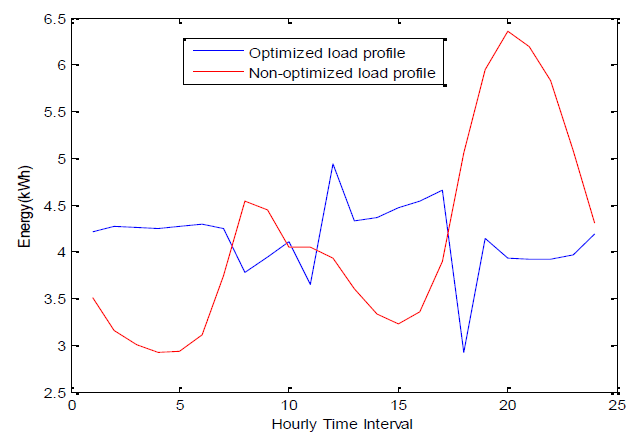
Figure 3. Optimized and non–optimized load profile.
Also, C and D converged to a maximum. This is expected because in reducing the cost, we expect to see a considerable change in the forecast load profile and this will most likely lead to an increase in discomfort level. Fig.2 therefore presents the average values of both the input and output variables used, as they converge after 2500 iterations.
Fig. 3 shows the optimized and non–optimized load profiles through the day. One can observe how the optimized load profile dipped at two periods in the day when prices shown in fig.4 are both high, but momentarily rose at 19:00 hrs. These are as a result of all the input variables involved, especially due to the corresponding two peaks in variance that permitted scheduling to take place very effectively at 12:00 and 18:00 hours. The dip at 18:00 was further enhanced by the very low occupancy (see fig. 4), but it rose sharply at 19:00 hours due to very low variance. The peak to average ratio is lower and most optimized loads are at early hours of morning and afternoon.
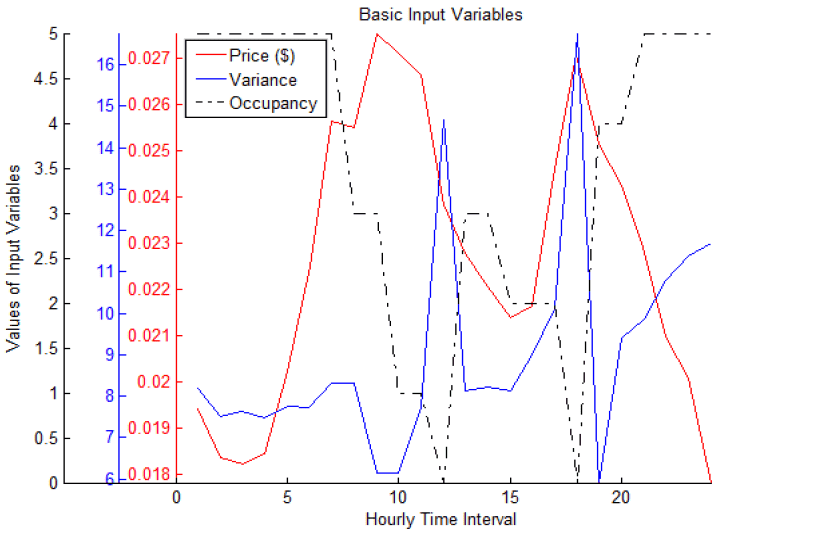
Figure 4. Basic Input variables used.
Fig.5 shows the relationship between the cost and discomfort experienced due to load scheduling. It can be observed that these variables are inversely related at most times since as one is increasing, the other is decreasing, and vice versa. It is not a surprising result because fig.2 also indicates this relationship. This shows that it is a sacrifice of comfort to reduce cost.
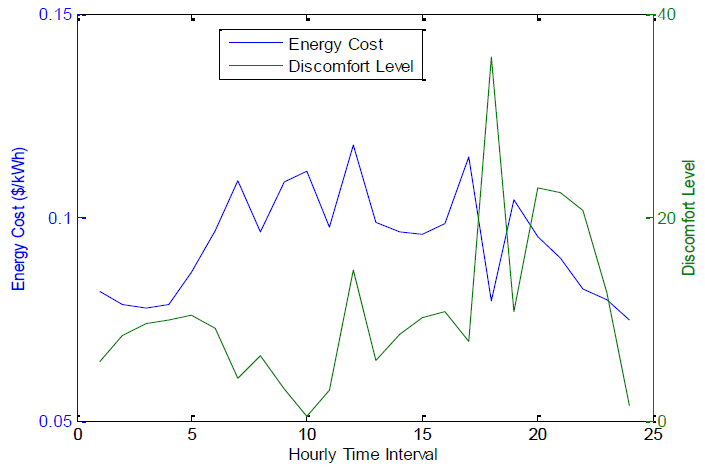
Figure 5. Cost and discomfort levels as output.
Fig.6 shows the costs for optimized and non–optimized load profile. The result shows about 1.7% in financial savings mainly due to the shift of some loads away from times of high energy cost in the day to times of lower energy cost. The choice of using weighted input is expected to improve this result.
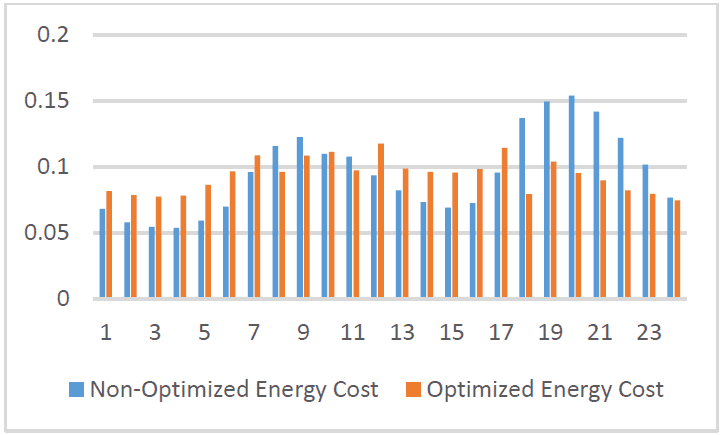
Figure 6. Graph of optimized and non–optimized energy cost in a day.
The weightings are also of importance in order to obtain the highest possible goal as some customers could consider financial savings above comfort, or vice versa, etc. But this is where varying the weightings could be pivotal because if more emphasis was laid on the cost, a higher savings can be expected, but it could be at the detriment of say, the comfort, etc. Therefore, if the appropriate weightings are applied, we shall expect to see the effect of these weightings on the optimal fitness function. But the optimization based on the use of varied weightings is outside the scope of this paper, so will not be covered here.
Finally, the optimal load profile shows a reduction of the peak load. This will in turn help in reducing peak loads and therefore improves grid efficiency. Also, an optimal solution shows a load profile that can reduce cost, among other effects of the input variables of interest.
V.CONCLUSIONS
The paper demonstrates the use of genetic algorithms to schedule the load of typical house. A major contribution amongst others is the use of a “user comfort” measure in the fitness fiction that help monitor and automate scheduling mechanisms that account for the actual user behavior. The issue of occupancy was also accounted for in the algorithm. The results show that the user comfort will change depending on how the fitness function is formulated depending on whether the aim was to minimize or to maximize variables of interest. Apart from investigating the effect of the weightings on the algorithm, this algorithm has still to be evaluated for different household types such that improved version of this algorithm could be developed in order to enable an online real–time implementation.
ACKNOWLEDGEMENT
This work was supported by the British Council and the UK Department of Business Innovation and Skills under GII funding for the SITARA project.
REFERENCES
- Pengwei and L. Ning,
Appliance Commitment for Household Load Scheduling
, IEEE transactions on smart grid, vol. 2, no. 2, pp. 411–419, 2011. - Tuohy, P. Meibom, E. Denny, and M. O'Malley,
Unit Commitment for Systems With Significant Wind Penetration
, vol. 24, no. 2, pp. 592–601, 2009. - W. Chengshan, Z. Yue, W. Jidong, and P. Peiyuan,
A novel Traversal–and–Pruning algorithm for household load scheduling
, Applied Energy, vol. 102, no. pp. 1430–1438, 2013. - H. R. Li and Y. L. Gao,
Improved particle swarm optimization algorithm for mixed integer nonlinear programming problems
, Key Engineering Materials, vol. 467, no. pp. 359–364, 2011. - A. Weizhong and Y. Xigang,
Improved simulated annealing algorithm for synthesis of heat integrated distillation sequences
, Journal of Chemical Industry and Engineering (China), vol. 56, no. 3, pp. 506–510, 2005. - C. Phani, Y. Peng, and N. Arye,
A Distributed Algorithm of Appliance Scheduling for Home Energy Management System
, IEEE Transactions on Smart Grid, vol. 5, no. 1, pp. 282–290, 2014. - S. Karnouskos, O. Terzidis, and P. Karnouskos,
An advanced metering infrastructure for future energy networks
, in New Technologies, Mobility and Security, vol.: Springer, 2007, pp. 597–606. - C. Chen, S. Kishore, and L. V. Snyder,
An innovative RTP– based residential power scheduling scheme for smart grids
, 2011, pp. 5956–5959. - David, Edward, and Goldberg, Genetic Algorithms. Canada: Addison–Wesley Publishing Company, Inc., 1989.
- G. Jones,
Genetic and Evolutionary Algorithms
. University of Sheffield, UK. - K. Z. Gkoutioudi and H. D. Karatza, Multi–Criteria Job Scheduling in Grid Using an Accelerated Genetic Algorithm Journal of Grid Computing June 2012, Volume 10, Issue 2, pp 311–323.
- M. Awais, N. Javaid, N. Shaheen, Z. Iqbal, G. Rehman, K. Muhammad, and I. Ahmad,
An Efficient Genetic Algorithm Based Demand Side Management Scheme for Smart Grid
, 2015, pp. 351–356. - O. Oladeji and O. O. Olakanmi,
A genetic algorithm approach to energy consumption scheduling under demand response.
- N. Shaheen, N. Javaid, Z. Iqbal, K. Muhammad, K. Azad, and F. A. Chaudhry,
A Hybrid Algorithm for Energy Management in Smart Grid
, 2015, pp. 58–63. - A. Abu–Jasser,
Solving the Unit Commitment Problem Using Fuzzy Logic
,International Journal of Computer and Electrical Engineering
, vol. 3, no. 6, pp. 824–829, 2011. - O.o.E.E.R.E. (EERE),
Commercial and residential hourly load profiles for all TMY3 Locations in the United States
, 2nd July 2013 ed: OpenEI, 2013. - A. Illinois,
Day Ahead Pricing used for billing RTP and HSS service,
1st May 2015 ed: Ameren, 2015.