
Abstract
Content
- Introduction
- 1 ANALYSIS OF EXISTING SPATIAL INTERPOLATION METHODS
- 1.1 Interpolation and approximation of functions
- 1.2 Statement of the problem
- 2 SELECTION AND JUSTIFICATION OF THE SOFTWARE AND MATHEMATICAL APPARATUS FOR CREATING A GEOMETRIC MODEL OF THE ROCK DUMP
- 3 COMPARISON OF THE RESULTS OF THE ANALYSIS OF INTERPOLATION IN THE SOFTWARE PACKAGE MAPLE
- 3.1 Feature of the software package Maple
- 3.2 Opportunities Maple package for visualizing
- 4 BUILDING A ROCK DUMP MODEL BASED ON THE CALCULATION ERROR ANALYSIS
- CONCLUSION
- References
Introduction
Due to the rapid development of industrial production in the XX century, the extraction of minerals from the earth's interior reached a high level, which led to the accumulation of huge amounts of rock mass in dumps.
The composition of the rock mass can include coal-containing overburden (in open-pit coal mining) and mine rocks, i.e. deposits of the mining industry of a technogenic nature, formed during the extraction of minerals. At the moment, there is no necessary information about the annual scale of formation and storage in dumps of such volumes of rock mass.
The study of mine dumps examines the degree of harm they cause, as well as the possibility of using rocks, chemical composition and mechanical properties, which in most cases are unknown. Thus, it became necessary to develop a method for storing mine rocks in dumps, taking into account their lithological and chemical composition, geomechanical parameters in relation to the planned procedure for extracting coal seams. [6]
Rock dumps are subject to research, as they cause high environmental harm and danger to cities and localities. In addition, dumps occupy significant land areas that may be in demand in the future with a sufficient level of development of equipment and technology.
Dump rocks are of interest as a source of secondary mineral raw materials. The rock contains minerals and the older the dumps, the richer they are in minerals, since the development of technologies allows you to develop non-standard mineral reserves.
The mine is currently operating as a new structural division. After a certain period of time, when the coal company is liquidated, a number of questions will arise regarding the employment of people and the improvement of the territory on the surface of the mine. Thus, there is a need to prepare the mine as an enterprise with a new economic orientation, namely, how to solve the issue with personnel and, of course, how to use secondary products of mining production-rock dumps. [1]
Thus, the scientific justification of the parameters of rational planning for the formation of dumps for the purpose of subsequent (possible) use as a man-made Deposit is an urgent scientific and technical task.
1 ANALYSIS OF EXISTING SPATIAL INTERPOLATION METHODS
1.1 Interpolation and approximation of functions
Interpolation is a method of finding intermediate values of a quantity from an existing discrete set of known values.
Interpolation allows you to solve various problems of numerical analysis, such as differentiation and integration of functions, search for zeros and extremes, and so on.
The main purpose of interpolation is to find the values of a table-defined function at points within a given interval where this function is not specified. The initial table data can be either experimental values or values found by calculation using complex dependencies.
Approximation is understood as replacing the original dependence with a fairly simple or easily calculated function.
The main task of approximation is to construct an approximate (approximating) function that most closely passes near these points or near a given continuous function.
Piecewise linear interpolation is based on calculating additional points from a linear relationship. Graphically, this implies a simple connection of many points by line segments. [8]
Spline interpolation is based on drawing a curve through a set of points so that the first and second derivatives of the curve are continuous at each point. Such a curve is formed by forming a series of cubic polynomials that pass through sets of three adjacent points. The cubic polynomials will fit together to form a single curve. The line describing the spline function resembles the shape of a flexible ruler, which is fixed at the nodal points.
To describe the behavior of spatially distributed phenomena, we use the concept of a spatial variable, which is a numeric variable Z = Z(X, Y), which takes a value at any point in the study area; X, Y - coordinates of a point in space (on a plane).
The values of these variables are usually known only at certain points in the study area (Fig. 1 (a)). These points are called sample points (measurement points, observation points, posts, sample points). [9]

where (X0, Y0) are the coordinates of an arbitrary point in the study area, Z0 is the unknown value of the studied variable Z at this point –and an interpolation estimate of the unknown value of Z0 obtained from sample data (Z1, Z2,..., Zn). [10]
Various spatial interpolation methods are used to estimate the value of the z variable at a point where it is not measured. There are two main approaches to interpolation: deterministic and geostatistical. Deterministic interpolation methods provide an approximation of an unknown variable by a parametric function whose shape is set either explicitly (for example, a polynomial) or implicitly (the minimum curvature condition).
To represent the results of spatial interpolation, a rectangular regular grid is used, in the nodes of which the interpolation estimate of the studied variable is calculated. Thus, the nodes of this grid are considered as a point (X0, Y0). This representation is called the spatial variable model (figure 1 (b)).
The distance between the grid nodes is set less than the size of the spatial phenomenon being studied, and the grid itself completely covers the study area.
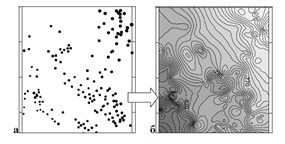
Figure 1.2 - Sample data (a) and spatial model (b)
1.2 Statement of the problem
Thus, in the course of studying the existing methods of spatial interpolation analysis, the following tasks were formulated:
- to form a model for constructing a rock dump;
- in accordance with the SURFER software package, select a method for constructing a spatial model of the rock dump and analyze this method;
- based on the analysis of interpolation of available methods from the list of the SURFER software package, select the most significant ones and evaluate their value based on expert evaluation;
- based on the built developed model, suggest and solve the problem to show the main aspects of working with it;
- based on the research of various sources, suggest possible solutions for building spatial models of rock dumps using existing software packages, including GIS technologies.
2 SELECTION AND JUSTIFICATION OF THE SOFTWARE AND MATHEMATICAL APPARATUS FOR CREATING A GEOMETRIC MODEL OF THE ROCK DUMP
Automation of geological surveying is inextricably linked with the use of computer technologies. Computer technologies include: collection and processing of source data, their analysis, establishment of correlations and dependencies, synthesis of qualitatively new data on this basis, and so on. With each subsequent stage of solving a specific problem, the question arises of choosing the most effective means of information processing. High priority is given to "standard" packages and programs that are not always really effective.
To solve such problems, mathematical and software of geographic information systems such as ArcView, MapInfo, AutoCad, Easy Trace, etc. are used.
The SURFER program is quite common, quite cheap and easy to learn, and has also become a standard for other programs, as evidenced by the inclusion of the SURFER file format in programs from other manufacturers. SURFER was developed in 1983 by the American company Golden Software, the Company is based on the development of scientific graphics packages.
SURFER provides construction and visual design of two-dimensional maps, which are described by a function of the form z=f (x, y). The functions of this package include:
- designing a digital surface model;
- additional operations with digital models;
- visual display of the surface.
Setting the map construction problem involves calculating the function values at any point in the mapping area from the original data set.
To make the transition to values in a regular grid, the following tasks are solved:
- building a continuous surface that allows you to find out the parameter values at any point on the map;
- representation of this data in the form of a mathematical digital model that allows solving other meteorological problems.
As the mathematical basis of the SURFER package, there are eight interpolation algorithms: Kriging, curvature minimization, inverse distances, polynomial regression, radial base functions, method, and triangulation. These algorithms allow you to solve a wide range of problems. For example, triangulation is used to construct a three - dimensional surface based on the exact values of geodetic survey data, and the polynomial regression algorithm is used to analyze the surface trend. A regular grid is calculated for data set files X, Y, and Z of any size, and the grid itself has dimensions of 10,000 nodes. You can construct surfaces for functions that are explicitly defined.
The main display elements are the following types of maps: contour Map; three-dimensional surface image (3D Surface Map); source data map (Post Map, Classed Post Map); base Map.
All maps are edited using the built-in tools of the SURFER package.
Since the rock dump is a spatial object and can be modeled using various types of geological indicators, the SURFER software package was chosen to implement the lithological characteristics of the dump and to create three-dimensional images of the dump tiers.
To build a spatial model of a rock dump, a set of points is used that are located on the surface of the rock dump with x, Y, Z coordinates, which are determined as a result of surveying rock dumps. Having a text file with a set of such points, using the methods of the SURFER package, a spatial model of the rock dump is built. SURFER uses its own GRD files to store values. You can work with files to visualize the surface.
Graphically, the surface is represented in two ways: as an isoline map or a three-dimensional image of the surface. SURFER's work is based on the following principles of their construction:
- getting an image by applying several transparent and opaque graphic layers;
- loading ready-made images that can be obtained in other applications;
- use special drawing tools and enter text information and formulas to create new images, as well as to edit old images.
To ensure environmental safety, rational use of the rock dump, as well as its further reclamation, involves the creation of a dynamic model of the rock dump. The use of this model makes it possible to analyze a rock dump that has already been operated, i.e. to show changes in its surface during operation, as well as to draw up a project for the formation of a rock dump for new development of mineral deposits.
3 COMPARISON OF THE RESULTS OF THE ANALYSIS OF INTERPOLATION IN THE SOFTWARE PACKAGE MAPLE
3.1 Feature of the software package Maple
Maple is a software package that provides analytical computing on a computer. It contains more than two thousand commands that allow you to solve algebraic and geometric problems, problems of mathematical analysis, differential equations, mathematical physics, statistics.
Visually, the Maple interface is similar to a typical Windows window, consisting of a title Bar, Main menu, toolbar, Work field, and status Bar, as well as a Ruler and scroll Bars.
Working in Maple is based on session mode, that is, the user enters suggestions (commands, expressions, procedures), and Maple accepts them conditionally and processes them. The working field of the program consists of three parts:
- the input area includes command lines. The command line always starts with the character >;
- the output area includes the results of processing the entered commands in the form of analytical expressions, graphical objects, or error messages;
- the text comments area includes any text information explaining the procedures performed.
3.2 Opportunities Maple package for visualizing
1) The Method Of BSplineCurve.
This method is intended for constructing b-spline curves. It can be used in two forms:
BSplineCurve(xydata, v, opts)
BSplineCurve(xdata, ydata, v, opts),
где
xydata – defined in the form [[x1, y1], [x2, y2],…, [xn, yn]]
xdata - defined in the form [x1, x2,…, xn]
ydata - defined in the form [y1, y2,…, yn]
v – name of the independent variable
opts – optional parameter
Figure 1.3-Graph of the BSplineCurve function
>m:=[[100,100],[200,-100],[-200,100],[100,200],[200,-200],[200,200],[-200,-200],[-200,-400],[-400,-200],[100,400],[-300,200],[300,300],[400,-200],[-400,-400],[-300,400],[400,-300],[200,-400],[300,400],[-500,300]];
> with(CurveFitting);
> f:=BSplineCurve(m, u);
> plot(f,u);
> plot(f,coords=polar);
>plot3d(-200/3+400*(x-6)^2-800/3*(x-6)^3,x=-400..400,y=-400..400);
2) The Method Of LeastSquares.
This method is intended for implementation of approximation by the method of least squares. It can be used in two forms:
LeastSquares (xydata, v, opts)
LeastSquares (xdata, ydata, v, opts),
где
xydata – defined in the form [[x1, y1], [x2, y2],…, [xn, yn]]
xdata - defined in the form [x1, x2,…, xn]
ydata - defined in the form [y1, y2,…, yn]
v – name of the independent variable
opts – optional parameter
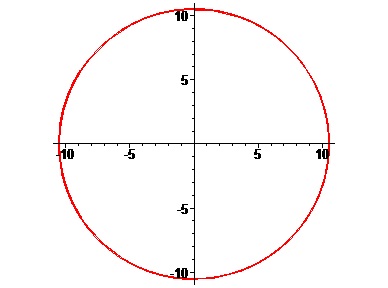
Figure 1.4-Graph of the LeastSquares function
> f:=LeastSquares(m, u);
> plot(f,u);
4 BUILDING A ROCK DUMP MODEL BASED ON THE CALCULATION ERROR ANALYSIS
The contour map of the rock dump was built on the basis of an array of source data. As an interpolation method, the most optimal method for constructing a rock dump was chosen, which was obtained during the error calculation analysis (Table 2.1).
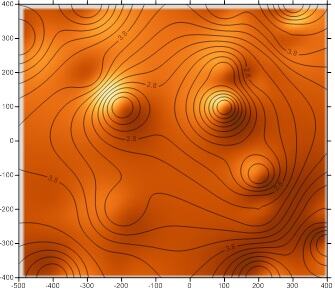
Figure 1.5 – outline map with shaded relief
Similarly, with the contour map, an array of source data and the optimal method for constructing a rock dump were used for construction. Use the Map>New>3D Surface menu item to create a 3D map of the rock dump.
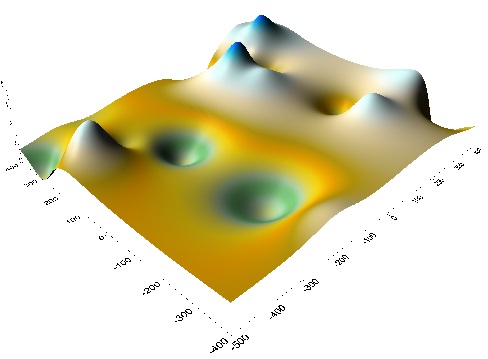
Figure 1.6 - 3D map in color
CONCLUSION
During the course of the thesis, contour maps were constructed based on the developed model using all the methods of spatial interpolation using the SURFER software package, as well as an analysis of the methods used.
In the process of interpolation analysis, calculations were performed, according to which the most significant methods were identified and their values were evaluated based on expert evaluation.
Based on the constructed maps and error analysis, the optimal method for constructing a spatial model of the rock dump was chosen, such as the inverse distance method, which most accurately describes the surface of the dump.
Thus, this method can be used as a basis for building a rock dump.
References
- Прокопенко Е.В. К вопросу о геометризации терриконов угольных шахт/Борщевский С.В., Прокопенко Е.В., Торубалко Д.Т//Проблемы недропользования:междунар. форум-конкурс мол.уч-ных., 21-23 апр. 2010 г. – Санкт-Петербург, 2010. – С.169-171.
- Прокопенко Е.В. Определение опасных экологических очагов породных отвалов/Борщевский С.В. Прокопенко Е.В., Масло С.В., Платоненко М.В.//Перспективы развития Восточного Донбасса/Шахтинский ин-т (филиал) ЮРГТУ (НПИ). – Новочеркасск: ЮРГТУ, 2010. – С.228-233.
- Мальцев К.А., Мухарамова С.С. Построение моделей пространственных переменных (с применением пакета Surfer): Учебное пособие. – Казань: Казанский университет, 2014. – С.103.
- Миронов А.И. Об экологических проблемах при закрытии шахт и путях их решений/Миронов А.И., Ткачук Н.В Уголь Украины. 2000. - С. 739.
- Прокопенко Е.В., Юрко Ю.С. Выбор и обоснование программно-математического аппарата для создания геометрической модели породного отвала. Материалы студенческой секции X Международной научно-технической конференции «Информатика, управляющие системы, математическое и компьютерное моделирование» (ИУСМКМ - 2019). – Донецк: ДОННТУ, 2019. – С.47–50.
- Прокопенко Е.В. Определение качественного состава пород по пластам для размещения в отвалах с применением линейного программирования/Борщевский С.В., Прокопенко Е.В., Гончаренко В.В.//Перспективы развития горного дела и подземного строительства. Сб. научн. трудов. Вып 2. – Киев: Предприятие УВОИ «Помощь», 2010. - С.185-188.
- Грядущий Б.А. Угольные месторождения Украины как источник углеводородного топлива/Грядущий Б.А., Майдуков Г.Л., Пивняк Г.Г. - Уголь Украины. - 2008. - С.3-7.
- Прокопенко Е.В. Создание хронолитологической модели для формирования породного отвала/Борщевский С.В., Прокопенко Е.В., Литвинова Д.С.//Материалы 5-й международной научно-практической конференции молодых ученых, аспирантов и студентов по направлению «Перспективы освоения подземного пространства» (7-8 апреля, НГУ, Днепропетровск), 2011. - С.20-23.
- Прокопенко Е.В. Комплексный подход к формированию породных отвалов в угледобывающих регионах/Борщевский С.В., Масло С.В./Материалы IV научной конференции «Агошковские чтения», 12 ноября 2011 г. - Чита: ЗабГК, 2011. - С.85-93.