
Abstract
Содержание
- Introduction
- 1. Relevance of the topic
- 2. Purpose and objectives of the study , planned results
- 3. Review of research and development
- 4. The main results of the study
- Conclusion
- References
Introduction
The availability of resource potential is the basis for the functioning and development of any enterprise . At the same time, only its rational use in the conditions of adverse influence of external environments allows modern enterprises to ensure their competitiveness in the market , to ensure profitability and meet the needs of users . Appropriate and systematic evaluation efficiency of resource potential management allows to identify shortcomings in a timely manner and to determine the possibilities of further more effective involvement of resource potential in the activities of enterprises .
Globalization has become one of the most important characteristics of starts of the modern world economy , in terms of which economic development and foreign trade activities closely interrelated . Occupying a central place in the system of global management of multinational corporations reveals all growing influence on international economic relations , development of national and world economy are the main generators of diversification of modern international business .
The aim of the research is to study the theoretical and methodological foundations of the formation of the strategy of development of transnational corporations in the conditions of modern globalization . To achieve this goal , the study identifies the following interrelated tasks : to clarify the economic essence of transnational corporations and determine their role in the modern world economy ; to study modern theories of genesis and evolution of transnational corporations ; to analyze modern methodological approaches to the formation of development strategy of transnational corporations . The object of study - multinational corporations .
theoretical and conceptual bases of transnationalization and activities of transnational corporations got their mappings tion in studies of well-known foreign and otecheskyh students as Aharoni I. Baade D., Bartlett , K., D. Bergman, Vernon R. Danynh J., Len skyy E. IN. , Perlmuter H., Shchetinin VD, Young S, etc. The information base of the research were scientific works of domestic and foreign students , official data of the international rating Fortune Global 500.
To characterize the financial situation in the short -term use indicators of payment capacity , results of mailing them on the data of the financial statements of Bayer AG (Annex A) according to the method introduced in application of D, shown in the table 1.
Table 1 - coefficients , which characterize a paid capacity Bayer AG
|
Indicator |
Reporting dates |
|||
|
12/31/2015 |
12/31/2016 |
12/31/2017 |
12/31/2018 |
|
|
1. The coefficient of absolute liquidity |
0.133 th most common |
0.311 |
0.677 th most common |
0.226 |
|
2. The ratio of current liquidity |
0.174 th most common |
0.349 th most common |
0.870 |
0.236 |
|
3. Indicator of security of liabilities of enterprises with its assets |
1105 |
1,170 th most common |
1534 |
1329 |
|
4. The degree of solvency of the current liability |
4165 |
5994 |
4 602 |
7010 |
The highest level of solvency (tab. 1), as well as the level of financial stability , Bayer AG on zvav as at the End of 2017 g These normative values accepted for the following invitation : the probability of that all creditors of the enterprise while providing for requirements regarding nemedlennoho coordination Obligation obligations .
D ynamika indicator of the degree of solvency for on precise commitments in 2016 r . soprovozhdalos reduction serednomesyachnoyi revenue by 24.2% (3840 mln. euros in 2015 r . to 2912 mln. euros in 2016 .), the presentation of this index in r 2018 . observed on the background growth serednomesyachnoyi revenue by 13.1% (3299 mln. euros in r 2018 . to 2918 mln. euros in 2017 ). (Fig. 1).
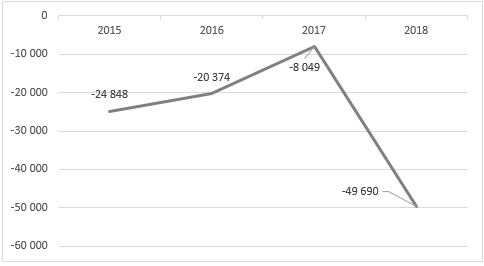
Figure.1 - Serednomesyachna whirlpool chka Bayer AG , mln. Grn . Euro
Thus, the payment ability of the group continues its fall , it is impossible to increase the volume of sales. The reason for this krokuyetsya in significant growth of current liabilities (Fig. 2)
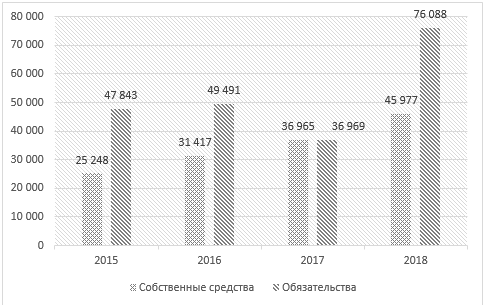
Figure 2 - dropping obligations Bayer AG , mln. Grn . Euro
Thus, current liabilities in 2018 was increased to 9,696,000,000. UAH. EUR in comparison with the level of 2017 r . , Which amounted to 72.2%, while the growth of average monthly revenue for the same period amounted to only 13.1%.
Reduced business activity regular reflection on the duration of turnover as the total amount of funds , invested in economic activities of Bayer AG , and certain of its components (tab. 2).
Table 2 - Duration of turnover of Bayer AG
|
Indicator |
Reporting periods |
2018/2015 |
||||
|
2015 year |
2016 year |
2017 year |
2018 year |
days |
% |
|
|
Duration turnover funds , introduced in assets , days |
496 |
729 |
664 |
989 |
493 |
99.5 |
|
Duration turnover of funds , invested in negotiable instruments , days |
98 |
137 |
80 |
119 |
21 |
21.8 |
|
Duration of turnover of own funds , days |
189 |
318 |
314 |
286 |
98 |
51.9 |
|
Duration of turnover zaemnyh funds , days |
169 |
278 |
326 |
359 |
190 |
112.0 |
Thus, if in 2015 , the funds , invested in assets , completed its turnover by 496 day, in 2018 , the - already for 989 days , ie in 2018 g to turn invested in assets means Bayer AG needed to be almost 3 against , the little work more than in 2015 , the at the same time the length of turnover of current assets increased only by 21.8%, which gives reason to anticipate expanding material and technical ichnoyi base of Bayer AG in 2018 year
Otrazylys data of negative statements and indicators of profitability , which characterize the yield function onuvannya group (tab. 3).
Table 3 - Factors , that characterize profitability of Bayer AG
|
Indicator |
Reporting periods |
2018-2015 |
||||
|
2015 year |
2016 year |
2017 year |
2018 year |
ko?f . |
% |
|
|
1. Profitability of sales |
0.461 |
0.562 th most common |
0.572 th most common |
0.483 |
0.022 th most common |
4.8 |
|
2. Profitability of enterprises (net profitability ) |
0.076 |
0.110 |
0.178 th most common |
0.036 th most common |
-0.04 |
-52.6 |
|
3. Return on equity |
0.163 th most common |
0.144 th most common |
0.198 th most common |
0.037 th most common |
-0.126 |
-77.3 |
|
4. Return on total capital |
0.056 |
0.055 |
0.098 |
0.013 th most common |
-0.043 |
-76.8 |
|
5. Return vneoborotnoho capital |
0.082 |
0.087 |
0.163 th most common |
0.018 |
-0.064 |
-78.0 |
|
6. Return on working capital |
0.173 th most common |
0.149 th most common |
0.244 th most common |
0.055 |
-0.118 |
-68.2 |
|
7. Return on permanent capital |
0.072 |
0.071 |
0.121 |
0.017 th most common |
-0.055 |
-76.4 |
|
8. Return on borrowed capital |
0.086 |
0.092 |
0.198 th most common |
0.022 th most common |
-0.064 |
-74.4 |
Listed in table. 6 indicators were disclosed according to the financial statements . profitability Bayer AG declined for all accounting for off profitability of sales increased to 46.1% in the 20 15 year . to 48.3% in 2018 year . For this reduction to other indicators of profitability for the 2015-2018 biennium . was about anyway and kolebalos of 52.6% (net return ) to 78.0% ( profitability vneoborotnoho capital ).
Conclusions
Connected to the results of evaluation of the effects vnosti strategies of BayerAG, could mark a significant reduction in financial condition for all components, which manifested in the reduction of financial stability , suhublennya problem with the presence of its own working capital, significant payments payments (in disabling the absolute payment capacity ), reduction of business . concern.
List of links
- Shinkareva LI Financial state of enterprises and methods of its assessment / L.I. ?????????, ?.?. Sadochkov // Izvestiya TulGU . Economic and legal sciences. - 2015. - -1 4-1. - P. 291-296.
- Demko II Comparison of domestic and foreign experience in the analysis of the financial condition of companies / II Demko // Economics and Banks . - 2013. - ? 2. - P. 21-27.
- Popova Yu.A. Financial and economic analysis as a tool to prevent crisis in the enterprise / Yu.A. Popova // Business Strategies . - 2018. - ? 4 (48). - P. 3-8.
- 2017 Top- 20 global companies Agchem ( Results of sales 2012-2 017 years .) Electronic resource ] / AgroPages . - Mode of access : http: //news.agr o pages.com/News/NewsDetail---28032.htm
- Top 20 2017 - Agrow [Electronic resource]. - Access mode: https://agrow.agribusinessintelligence.informa.com/
- Top 20 2018 – Agrow [Electronic resource]. - Access mode: https://agrow.agribusinessintelligence.informa.com/