
Nikolay Bezdetniy
Institute of Computer Science and Technology
Faculty of Intelligent Systems and Programming
Department of Software Engineering
named after L. P. Feldman
Specialty Software Engineering
Developing a model and simulation of virus epidemic spread using the Unity game engine
Scientific adviser: Head of the Department, Doctor of Technical Sciences, Associate Professor Sergey Zori
Abstract
Content
- Introduction
- 1. Domain analysis
- 1.1 Basic concepts
- 1.2 Modeling process
- 1.3 Concepts and classification
- 1.4 Overview of existing methods, technologies, models and tools
- 1.4.1 Mathematical modeling
- 1.4.2 Computer modeling
- 1.5 Analysis of the main advantages and disadvantages
- 2. Statement of the design problem
- Conclusion
- List of sources
Introduction
Viruses are particles, microparasites, functioning on the border of living organisms and chemical compounds. They have the ability to create crystalline structures, which is characteristic of inanimate matter, and on the other hand, they can multiply and spread disease. Getting into the cells of the human mucous membranes, they begin to multiply and destroy the cells of the body, which leads to the formation of inflammatory processes and, as a result, lead to problematic symptoms [1].
Examples of known viral human diseases include the common cold, flu, chickenpox and herpes simplex. Many serious diseases, such as Ebola, AIDS, avian flu and pneumonia, are also caused by viruses.
Epidemiology is a part of medical science that studies the transmission and control of viral infections among humans. It is used to stop the spread of infection in the population during an outbreak of a viral disease. Are being undertaken control measures that are based on knowledge of how the virus spreads. If an outbreak leads to a high number of cases in a population or region, then it is called an epidemic. If the outbreaks are widespread, they're talking about a pandemic [2].
The topic of this work, related to the development of computer simulation and the study of modern technologies for its implementation, is relevant, since the problem of viral morbidity and the occurrence of epidemics requires prompt solutions and actively researched all over the world, including – and using mathematical apparatus and computers.
Mathematical computer modeling is used to study the mechanisms of the spread of the disease. Such models make it possible to predict and evaluate the dynamics of disease transmission. This allows you to analyze and control the situation, related to the spread of the virus, as well as to anticipate serious consequences and take appropriate measures to eliminate them.
The SIR model [3] was chosen as the basis for the basic model of the simulation process. The improvement of this computer model is aimed at increasing the informativeness and clarity of the simulation process through the introduction of three-dimensional visual the simulation component and the adjustable parameters affecting the model, which subsequently also allows you to flexibly obtain the final results by varying the structures, algorithms and parameters of the model.
The powerful cross-platform Unity engine, the modern object-oriented programming language C#, as well as a package for creating three-dimensional computer graphics Blender were chosen as tools for simulation development.
In terms of development for the future, it is possible to improve the presented model (introduction of additional parameters, increase the accuracy of behavior, etc.).
1. Domain analysis
1.1 Basic concepts
Modeling is the process of presenting a model, which includes its construction and operation. This model is similar to a real system that helps the analyst predict the impact of changes in the system. In other words, modeling creates a model that represents a system that includes their properties. This is the act of building a model [4].
System simulation is the work of a model in terms of time or space, which helps to analyze the performance of an existing or proposed system. In other words, simulation is the process of using a model to study the performance of the system. It is the act of using a model to model [4].
An object is an entity that exists in the real world to study the behavior of a model. The basic model is a hypothetical explanation of the properties of an object and its behavior, which operates throughout the model.
The experimental frame is used to study a system in the real world, such as experimental conditions, aspects, goals, etc. The basic experimental frame consists of two sets of variables – the input variables of the frame and output frame variables that correspond to the system or model. The input variable Frame is responsible for mapping inputs applied to the system or model. The output variable Frame is responsible for matching output values with a system or model.
Validation is the process of comparing two or more elements to ensure their accuracy. Validation can be performed by comparing the consistency of the simulation program and the focused model to ensure their performance.
Validation is the process of comparing two results. Verification is performed by comparing the measurements of the experiment with the simulation results in the context of the experimental frame. The model is invalid if the results do not match.
Visualization is any way of creating images, diagrams or animations for a communication message. Visualization with the help of images was an effective way of communication exchange of both abstract and concrete ideas. entities from the very beginning of human history.
1.2 Modeling process
The modeling process includes three elements:
- subject (researcher);
- the object of the study;
- a model that defines (reflects) the relationship of the cognizing subject and the cognizable object.
The first stage of building the model assumes some knowledge about the original object. The cognitive capabilities of the model are determined by the fact that the model displays (reproduces, simulates) any essential features of the original
object. The question of the necessary and sufficient degree of similarity between the original and the model requires a specific analysis. Obviously, the model loses its meaning both in the case of identity with the original (then
it ceases to be a model), and in the case of excessive in all significant respects, differences from the original. Thus, the study of some sides of the simulated object is carried out at the cost of refusing to study other sides. Therefore,
any model replaces the original only in a strictly limited meaning. It follows from this that several specialized
models can be built for one object, focusing on certain aspects of the object under study or characterizing the
object with varying degrees of details.
At the second stage, the model acts as an independent object of research. One of the forms of such research is the conduct of model
experiments, in which the conditions of the functioning of the model are consciously changed and
systematized data about her behavior
. The end result of this stage is a set (totality) of knowledge about the model.
At the third stage, knowledge is transferred from the model to the original – the formation of a set of knowledge. At the same time, there is a transition from the language
of the model to the language
of the original.
The process of transferring knowledge is carried out according to certain rules. Knowledge about the model should be adjusted taking into account those properties of the original object that were not reflected or were changed during
the construction of the model.
The fourth stage is a practical verification of the knowledge obtained with the help of models and their use to build a generalizing theory of an object, its transformation or management.
Modeling is a cyclic process. This means that the first four-stage cycle can be followed by a second, third, etc. At the same time, knowledge about the object under study is expanded and refined, and the initial model is gradually improved. The shortcomings found after the first simulation cycle, due to little knowledge of the object or errors in the construction of the model, can be corrected in subsequent cycles. [5].
Now it is difficult to specify an area of human activity where modeling would not be applied. Developed, for example, models of car production, wheat cultivation, the functioning of individual human organs, the consequences of nuclear wars. In the future, different models can be created for each system, and modeling should be carried out before the implementation of each technical or organizational project.
1.3 Concepts and classification
Due to the ambiguity of the concept model
in science and technology, there is no single classification of modeling types: classification can be carried out by the nature of models, by the nature of the objects being modeled, by
the areas of modeling application (in engineering, physical sciences, cybernetics, etc.) [5].
Currently, the following basic types of modeling are distinguished by modeling technology and application areas:
- Information modeling;
- Computer modeling;
- Mathematical modeling;
- Biological modeling;
- Molecular modeling;
- Logical modeling;
- Pedagogical modeling;
- Psychological modeling;
- Statistical modeling;
- Structural modeling;
- Physical modeling;
- Economic and mathematical modeling;
- Evolutionary modeling;
- Full-scale modeling.
1.4 Overview of existing methods, technologies, models and tools
1.4.1 Mathematical modeling
Mathematical methods for studying diseases were first applied in 1760 by Daniel Bernoulli. With their help, he evaluated the effectiveness of various methods of vaccination against smallpox. In 1840, William Farr described data on smallpox
mortality in Great Britain, the curve of the normal distribution. Later, this method was developed by John Brownlee, who published an article in 1906 Statistical approach to immune defense: epidemic theory
[6],
where he compared epidemiological data series based on Pearson distribution. Two other scientists of that time, Hammer and Ros, were among the first to apply a mathematical description of the spread of diseases and were able to solve
the problems of finding out mechanisms for the regular resumption of the measles epidemic and the establishment of a relationship between the number of mosquitoes and the occurrence of malaria [7].
One of the most valuable works devoted to epidemic modeling is the work of W.O.Kermack and A.G.McKendrick A Contribution to the Mathematical Theory of Epidemics
. The Kermack-McKendrick concept is a hypothesis about the spread of
infectious diseases among the population. In 1927, they published their theory in the article [8], which became the source of the SIR model. In this model, three groups of the population are distinguished: healthy
or susceptible (from the English. susceptible) individuals who can become infected by contact with infected (from the English. infected), as well as recovered who have stopped spreading the disease (from the English. recovered). This
model has not lost its relevance so far and is well suited for modeling.
The book Mathematical Models in Biology [9] discusses in detail the SIR model, as well as its additions and modifications: SI, SIS, SIRS. The peculiarity of these models is that a person after an illness can re-enter to a group of susceptible individuals and be infected again. Another modification of SAR shows a model where a person can be infected, but is at the stage of the incubation period.
Herbert W. Heathcote, in his article [10], analyzed many mathematical models of the spread of infectious diseases among the population and applied them to specific diseases. Special attention is paid to the MSEIR model, which takes into account fertility and mortality. In it, the population is divided into 5 groups: with passive immunity, sensitive, latent, infected and immune.
In 2020, at the University of Basel, Richard Neurom's team modified the SAR model to take into account the specifics of the new coronavirus pandemic. The modified model includes the concept of the so-called epidemic transition. In other words, the simulation behaves quite differently depending on the Ro variable. Each infected person can infect several healthy ones. Ro shows the average number of people that one infected person can infect during their diseases. If the Ro is less than one, the epidemic gradually subsides, and if it is more, it grows exponentially. How Ro works depends on the specific virus, the percentage of the population that develops immunity to the virus, as well as on measures, which the population takes to contain the epidemic [11].
As an illustrative example of a mathematical model in continuous time, we can cite the classical Kermak-McKendrick model. To begin with, the variables and parameters of the model are defined.
Table 1. Model variables and parameters
|
Symbol |
Meaning |
|
S(t) |
the number of susceptible individuals at time t |
|
I(t) |
the number of infected individuals at time t |
|
R(t) |
the number of individuals who have been ill at time t |
|
B |
intensity coefficient of individual contacts with subsequent infection |
|
v |
recovery rate of infected individuals |
The population is considered fixed, because the sum of the numbers of all groups gives a constant value of N. Further , the model can be expressed by ordinary differential equations:
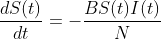
(1)
(2)
(3)
Initial conditions at time t = 0

(4)
The right-hand side of equation (1) describes a decrease in the population of susceptible individuals due to the infection of susceptible individuals by infected individuals. The first term of the right side of equation (2) describes the increase in the infected population the second term of the right part of equation (2) describes the decrease in the population of infected individuals due to the recovery or death of individuals. The right side of equation (3) describes an increase in the population of immune individuals due to the recovery or death of infected [12]. Such a transition can be described in the form of a diagram (Fig. 1.).

Figure 1. The general scheme of an individual's transition from class to class (animation: 11 frames, 10 repetition cycles, 89 kilobytes)
It is worth noting that the right-hand sides of the equations (1), (2), (3) the sum is zero, so the total population size remains unchanged. This is an important property of this model. To preserve it, recovered individuals also fall into the class of the immune and the dead. This is a logical technique, since in both of these cases the individual cannot infect the rest of the population [12]. The parameter of the intensity of infection of susceptible, also called the strength of infection, has the following view:

(5)
1.4.2 Computer modeling
With regard to the current situation in the world, various mathematical models can be found on the Internet, based both on the above-mentioned methods and on radically new principles and techniques. But often, the authors take an existing method or a model and begin to develop it at their discretion. For example, 3 groups of people from the SIR model are taken as the basis of their model and calculate the situation, not using equations and mathematics, but visually model and program behavior people and the process of spreading the virus among them. This interpretation of the model into interactive systems is easier to understand. They clearly show all possible dangers and help to better understand what can happen. And by entering various instantly adjustable parameters and factors, they describe how to influence and manage the situation. That is, there is a process of forecasting and controlling the consequences.
One such example is a simulation from an article [13] by journalist Harry Stevens in The Washington Post Why outbreaks like coronavirus
spread exponentially, and
how to
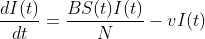
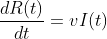
. Base This model consists in visually showing a closed space through which small balls can move in a random direction. That is, an abstraction of a city with a population is presented. Each ball has a color in
depending on his current condition, blue is healthy, brown is sick and pink is recovered. At the same time, the simulation of infection occurs as in real life: when a healthy ball comes into contact with a sick person, the first one
can get infected, and then recover after a while (Fig. 2).flatten the curve
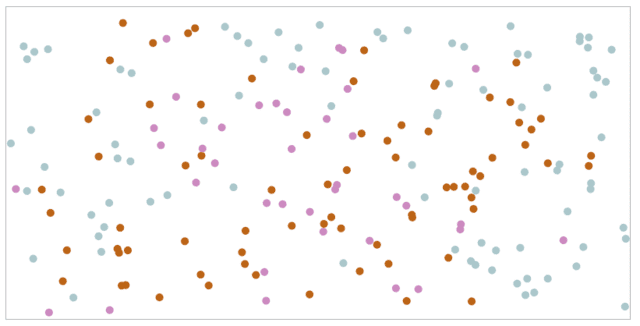
Figure 2. Visual representation of the model
By entering various factors and conditions that changed the behavior of the balls or imposed restrictions, the author showed 4 models described using graphs. Each of them describes options for the possible spread of the virus, depending on the measures taken (Fig. 3). It should be noted that in this model there is no such indicator as mortality, which may be the result of infection.
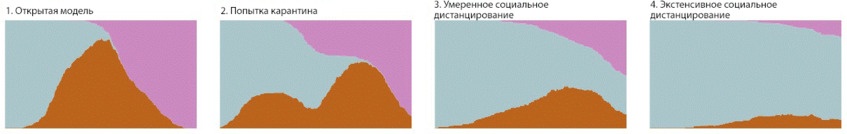
Figure 3. Possible model development options
Another article [14] tells about the first-year students of the FCN who created a similar simulation of the spread of coronavirus. In the simulation, it is possible to trace how the observance of the self-isolation
regime and hygiene rules by residents of the city it affects the dynamics of morbidity reflected in the graphs. It contains 4 adjustable parameters that affect the behavior of people
, and the dynamics of the epidemic is displayed
on graphs. The basis of the model is minimalist a map of the city where the balls are already walking, not in a random direction, but along the streets, from one house to another. That is, they have a given route defined (Fig. 4).
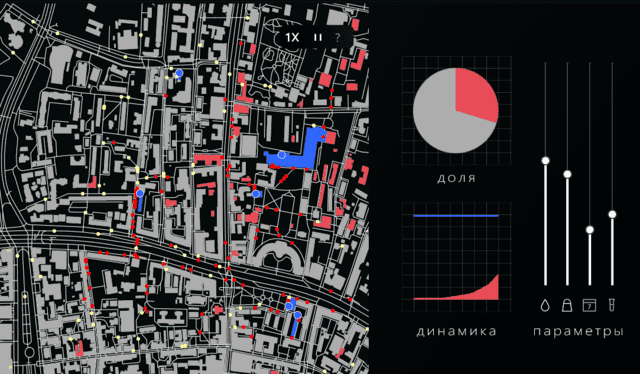
Figure 4. Visual representation of a model close to real behavior
It is also worth noting that there are special buildings on the map. The blue color indicates buildings that model public places where a large number of people are usually present. Compared to the last considered abstract by the model, this model is already more close to reality and stimulates natural human behavior.
1.5 Analysis of the main advantages and disadvantages
The main advantage of each of the methods considered is that, regardless of the complexity and implementation of the model, we get some kind of data set that can later be processed, for example, projected on graphs or predicted the behavior of the situation and methods of its solution. Separately, we can single out visual models that are not inferior in accuracy to mathematical ones, and in terms of clarity, they reveal and show the whole situation better.
However, as mentioned above, the main disadvantage of some of the models and techniques considered is the lack of visual implementation, visual simulation of real life
.
Modeling a situation with the help of mathematics (models based on equations, formulas) may not take into account a large number of external factors, which sometimes leads to erroneous results and an incorrect decision to resolve the situation. As for visual modeling (simulation), here the existing models are either reduced to an abstract minimum (the city is a closed contour, the population of the city is circles that move in different directions, etc.), or they lack factors and conditions that repeat real life.
As a solution to this problem, it is proposed to perform, on the basis of the selected and upgraded model from the point of view of its adequacy, a visual simulation in three-dimensional space using the Unity engine and programming language C#. This will allow you to simulate and visually simulate the situation of the spread of the virus epidemic, taking into account many changeable factors.
2. Statement of the design problem
The purpose of the work is to develop a model of the spread of the virus epidemic and its visual simulation using the Unity engine. To achieve this goal, it is necessary to solve the following tasks:
- Analysis of current models of the spread of the virus epidemic, identification of their advantages and disadvantages;
- Analyze real factors to bring models closer to greater adequacy;
- Taking into account the performed analysis, to develop a basic multifactorial model of the spread of the virus epidemic with increased adequacy to reality;
- Perform verification of the developed model based on real statistical data;
- Develop a strategy for visual simulation of the spread of the virus epidemic based on the proposed model and means of its implementation based on the Unity game engine;
- To design the application and its software modules for modeling and visual simulation of the spread of the virus epidemic and implement its prototype;
- Perform simulation analysis and comparison with real data, determine the characteristics and advantages and disadvantages of the proposed model and the developed visual simulation tools.
The Unity game engine will be used as the main means and tool for developing the simulation. The simulation logic, implemented through writing scripts, will be implemented in the Visual Studio development environment, using modern object-oriented programming language C#. The visual component of the simulation, various models and other attributes will be developed using a package for creating three-dimensional computer graphics Blender, but displayed it will be directly in the engine itself.
Due to the specification of the selected development tool, the project will consist of several scenes for various purposes: a start menu with initial parameters, a scene of the simulation process and adjustment of model parameters, a scene with output data and graphs. The analyst can set certain conditions, and then proceed to the simulation process, accelerating or suspending it at any time to view the current data in digital or graphical form.
Conclusion
When considering the existing methods, technologies and tools for developing a model and simulating the spread of the virus epidemic, their advantages and disadvantages were identified, the basic principles and methods of mathematical and computer modeling were analyzed. modeling, as well as a general statement of the task was performed, a goal was set and a list of tasks for its implementation was compiled.
The main tasks for the implementation of the project of simulation of the spread of the epidemic of the virus are set, the basic means of its development are justified and selected, the main working parts for the implementation of the logic of the application are determined.
List of sources
- Что такое вирус [Электронный ресурс] – Режим доступа: https://neosine.pl/ru/viruses-1/what-is-a-virus/ – Загл. с экрана.
- Вирусы [Электронный ресурс] – Режим доступа: https://ru.wikipedia.org/wiki/Вирусы – Загл. с экрана.
- SIR и разновидности [Электронный ресурс] – Режим доступа: https://www.anylogic.ru/blog/sir-i-raznovidnosti-modeli-covid-epidemii-v-rossii/ – Загл. с экрана
- Моделирование и симуляция – Краткое руководство [Электронный ресурс] - Режим доступа: https://coder-lessons.com/tutorials /akademicheskii/modelirovanie-i-simuliatsiia/modelirovanie-i-simuliatsiia-kratkoe-rukovodstvo – Загл. с экрана.
- Моделирование [Электронный ресурс] – Режим доступа: https://ru.wikipedia.org/wiki/Моделирование – Загл. с экрана.
- Brownlee, John. "Statistical studies in immunity: the theory of an epidemic." Proceedings of the Royal Society of Edinburgh (1906): 484–521.
- Леоненко В.Н. Математическая эпидемиология. Учебно–методическое пособие по выполнению лабораторных работ. Учебно–методическое пособие. – СПб: Университет ИТМО, 2018. – 38 с.
- Kermack, W. O.; McKendrick, A. G. A Contribution to the Mathematical Theory of Epidemics, 1927. Vol. 1 15, No. A771, P. 700–72 1.
- Edelstein–Keshet L. Mathematical Models in Biology. Society for Industrial and Applied Mathematics, 2005.
- Herbert W. Hethcote. The Mathematics of Infectious Diseases // SIAM Review, 2000. Vol. 42, Iss. 4, P. 599-653.
- Моделирование распространения вируса [Электронный ресурс] – Режим доступа: https://nfp2b.ru/2020/04/06 /modelirovanie-rasprostraneniya-virusa/ – Загл. с экрана.
- Математическая модель эпидемии лихорадки Эбола [Электронный ресурс] – Режим доступа: https://nauchkor.ru/uploads /documents/ 587d36545f1be77c40d58cd2.pdf – Загл. с экрана.
- Почему такие вспышки, как коронавирус, распространяются по нарастающей, и как ослабить их рост [Электронный ресурс] – Режим доступа: https://www.washingtonpost.com /graphics /2020/world/corona-simulator/ – Загл. с экрана.
- Первокурсники ФКН создали симуляцию распространения коронавируса [Электронный ресурс] – Режим доступа: https://www.hse.ru/our/ news/359308614.html – Загл. с экрана.