Диссертация
Библиотека
Перечень ссылок
Отчет о поиске
ИЛЬТНЕР АЛЕКСАНДР ЯКОВЛЕВИЧ
Библиотека
по теме магистерской работы:
"Обоснование параметров измерителя содержания углерода в выхлопных
газах автотранспорта методом иммитационного моделирования".
Руководитель - Хламов
М.Г.
Simulation
of soot formation and aggregation in high temperature condition
Proceedings of 2000 International Joint Power Generation Conference Miami
Beach, Florida, July 23-26, 2000.
http://asme.pinetec.com/ijpgc2000/data/pdfs/15085.pdf
Proceedings of
2000 International Joint Power Generation Conference
Miami Beach, Florida, July 23-26, 2000
IJPGC2000-15085
SIMULATION OF SOOT FORMATION AND AGGREGATION IN HIGH
TEMPERATURE CONDITION
Yutaka HISAEDA Department of Chemical Engineering, Tohoku University,
07 Aoba, Aramaki, Aoba-ku, Sendai 980-8579 Japan.
Tel: +81-22-217-7252 Fax: +81-22-217-6165. E-mail: yutaka@tranpo.che.tohoku.acjp
Shinji HAYASHI Nippon Steel Chemical Co., Ltd., 46-80 Nakabaru Sakinohama,
Tobata-ku, Kitakyushu 804-0002 Japan.
Tel: +81-93-884-1726 Fax: +81-93-884-1923. E-mail: hayasisn@nsce.cojp
Tsuyoshi YAMAMOTO Department of Chemical Engineering, Tohoku University,07
Aoba, Aramaki, Aoba-ku, Sendal 980-8579 Japan
Tel: +81-22-217-7252 Fax: +81-22-217-6165 E-mail: yamamoto@tranpo.che.tohoku.ac.jp
Hideyuki AOKI Department of Chemical Engineering, Tohoku University,
07 Aoba, Aramaki, Aoba-ku, Sendai 980-8579 Japan
Tel: +81-22-217-7252 Fax: +81-22-217-6165 E-mail: aoki@tranpo.che.tohoku.ac.jp
Takatoshi Miura Department of Chemical Engineering, Tohoku University,
07 Aoba, Aramaki, Aoba-ku, Sendai 980-8579 Japan
Tel: +81-22-217-7250 Fax: +81-22-217-7250 E-mail: miura@tranpo.che.tohoku.acjp
ABSTRACT
We carried out the experiment to form the soot by the pyrolysis of 1 mol% benzene (in 99 mol% nitrogen) in an aluminum tube, which was kept at 1573K, with variations of residence time (from 0.05 to 0.5 sec). The classification was carried out in order to obtain an overall characterization of the soot formation process. We also investigated the peripheral fractal dimension (Dperi) of the soot aggregates. The reaction kinetics model includes four kinds of reactions (pyrolysis of benzene, nucleation, particle growth and coagulation). In addition, a cluster-cluster aggregation model called Aggregate Mean free Path (AMP) model was developed to simulate the aggregation in the furnace. The model simulated the aggregation between soot particles and aggregates by using the mean free paths of particles and aggregates. Dmi obtained by simulation was 1.52, which was very close to the experimental value of 1.47.
KEYWORDS: soot, aerosol, pyrolysis, particle coagulation, fractal dimension
INTRODUCTION
Carbon black has been produced as soot by the incomplete combustion of heavy oils, and it is mainly applied to tires of automobiles. The aggregate shape of carbon black is essential to the development of high-performance tires, because the fuel efficiency of tires is influenced by an energy loss generated at the interface between rubber and carbon black. Since the aggregation mechanism of carbon black has not been clarified, basic study about the aggregation mechanism is now in demand. Prado and Lahaye (1981) have conducted basic studies using tube furnaces. However few researchers have focused on the mechanism of aggregation. Soot formation in combustion has been extensively studied by reaction kinetics such as the PAH model, which is the most prevailing procedure. Ivie and Forney (1988) proposed a simple model based on reaction kinetics in order to analyze the carbon black furnace.
The simulation methods of cluster-cluster aggregation have been studied since the 1980's (Meakin, 1984) and have been applied to aqueous gold colloids (Weitz et al., 1986). Simulations of the shape for soot aggregates have been carried out by the Diffusion Limited Aggregation (DLA) model (Richter et al., 1984) and cluster-cluster aggregation model using Langevin equations (Samson et aL, 1987). The DLA model calculates the aggregation between an immovable center particle and the other particles diffusing from distant points. However, the shape of the simulated aggregate by the three dimensional calculation was not in agreement with the actual soot (Richter et al., 1984). Samson et al. (1987) simulated the Brownian motion of soot particles in an acetylene flame. They adopted a simulation model of cluster-cluster aggregation based on the solutions of the Langevin equations. Although the shapes of the simulated aggregates were in agreement with the experimental data qualitatively, the fractal dimension of the simulated soot was 1.9, while the actual soot had the ffactal dimension of 1.5-1.6. Koylii et aL (1995) also conducted a simulation of cluster-cluster aggregation using Langevin equations. Their procedure included the restriction of the fractal dimension, which was assumed in advance to obtain shape similarity with the actual soot. From these points of view, it is said that the fractal dimensions of aggregates such as soot have not been in agreement between experimental and simulation yet.
Samson et al. (1987) suggested that there were two reasons why the fractal dimension of simulated soot was different from that of experimental data in their research; i) the effects of the partial oxidation reaction in the flame are not considered in the calculation, ii) the initial particle number density in the simulation was assumed to be higher than the actual condition. We considered two additional reasons, which might affect the results, iii) The temperature in the simulation was regarded as a constant at 1500 K in their study, while the actual temperature in the flame was not considered to be constant, iv) The particle counting method was applied for the investigation of the fractal dimension. However, the correct particle number per aggregate of the actual soot aggregate was difficult to obtain because the particle number per aggregate is about 200-600 in the acetylene flame. The error in number counting might have affected the results.
In our former study (Hayashi et al., 1999), the countermeasures for the above reasons were as follows; i) The soot formation experiment is conducted under an inert atmosphere in which no surface oxidation of the soot particle occurs, ii) The particle number density in the simulation is assumed to be the same as in the experiment, iii) The experiment is conducted in an electric furnace in which the temperature is kept constant, iv) Dperi is selected as an index for comparison in order to avoid inaccurate particle number counting data. Dperi is obtained only by the perimeter and area of aggregates without the particle number data. As results of the above four countermeasures, the simulated shape and fractal dimension obtained by the cluster-cluster aggregation model (the particle and Aggregates Mean free Path (AMP) model) were in agreement with those of the experimental data. The calculation was conducted assuming that the temperature is constant in AMP model. In this study, soot formation experiments are conducted by the pyrolysis of benzene in an inert atmosphere. The reaction kinetics is applied to clarify the whole process of the soot formation in the tube furnace.
NOMENCLATURE
a - distance between particles [m]
A - area [m 2]
C - constant
c - mean thermal velocity [ms -1]
dp - particle diameter [m]
D - diffusion coefficient of aggregate [m2s -1]
Df - fractal dimension [-]
Dperi - peripheral fractal dimension [-]
fxy - Brownian coagulation function between particles in size x andy [m3 s -1]
gi - function of particle radius and mean free path for i particle [-]
Gx - growth species containing x carbon
k - Boltzmann constant [J K-1]
Kn - Knudsen number [-]
m - mass of particle of aggregate [kg]
N - number of particles per aggregate [part]
Na average number of particles per aggregate [part]
Ny - nucleating species containingy carbon
P - perimeter [m]
Pi - particle containing i carbon atoms
Re - Reynolds number [-]
ta - aggregation time [s]
T - temperature [K]
Greek Symbols
![]() - mean free path [m]
- mean free path [m]
Subscripts
a - aggregate
g - gas
p - particle
i - particle i
EXPERIMENTAL METHODS
Benzene pyrolysis is carried out in the apparatus shown in Figure 1.
An aluminum tube (I.D. ![]() 4 mm, O.D.
4 mm, O.D. ![]() 6 mm and length
1500 mm) is used as a reactor tube. 1 mol% of Benzene (purity>99.59
%) diluted by nitrogen gas (purity>99.9999 %) is supplied to the tube
(Hayashi et aL, 1999).
6 mm and length
1500 mm) is used as a reactor tube. 1 mol% of Benzene (purity>99.59
%) diluted by nitrogen gas (purity>99.9999 %) is supplied to the tube
(Hayashi et aL, 1999).
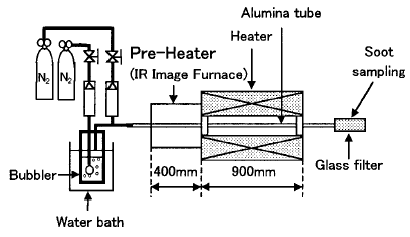
Figure 1 Experimental apparatus
The gas temperature is measured by the R-type thermocouple with an aluminum tube. The temperature distribution in the furnace is shown in Figure 2. The residence time is defined as the time length dunng the gas mixture passes the region of the lmifonn temperature (1573 ± 10 K) region (length 150ram). Three conditions of residence time (0.05-1.0sec) are selected by controlling the flow rate of the nitrogen gas. All the experiments are conducted in laminar conditions (Re=5-80). A glass filter collects the reaction products at the end of the aluminum tube. The electron micrographs of the soot are obtained from the transmission electron microscope.
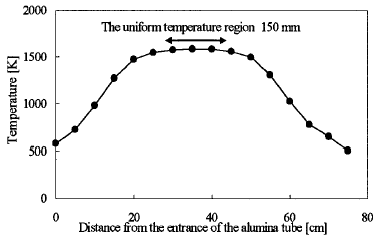
Figure 2 Temperature profile in the aluminum tube
THE IMAGE ANALYSIS METHOD OF AGGREGATES
In order to evaluate complexity of the shape of aggregates, the peripheral fractal dimension (Dperi) proposed by Gerspacher and O'Farrell (1991) is applied. Dperi is expressed by Eq. (1).
![]() (1)
(1)
where P is the perimeter of an aggregate and A is the area
of the aggregate. The logarithmic expression of Eq. (1) is
2 log 10 P = Dperi
log 10A + C (2)
Dver~ is obtained as a slope when P and A are plotted in the logarithmic form shown in Eq. (2). A perfect circle would give a value of Dperi=1. Dperi becomes larger than one if the shape is fractal.
The reasons why Dperi is selected as an index for evaluation are as follows; i) In the case of using the particle counting method, the undercounting of 20% had occurred near the center of the aggregates (Samson et al., 1987). Counting the particle number per aggregate is not necessary for using Dperi. ii) A projected image of the simulated aggregate and an electron micrograph of the soot obtained from the experiment can be compared by the same image analyzer. So this method is considered to be better for comparison between the simulated aggregates and soot than the particle counting method, iii) Gerspacher and O'Farrel (1991) and Herd et al. (1992) showed that commercial carbon blacks have variousvalues of Dperi. These facts indicate that Dperi is effective as an index to evaluate the fractal property of soot.
Magnification of 150,000 is applied to the measurement of the particle diameter and magnification of 85,000 is applied to the measurement of the aggregate structure. Diameters of 1,000 particles are measured to obtain the average particle diameter of one sample. Shape parameters are obtained using 100 aggregates for one sample, area A and perimeter P are measured. The average particle number per aggregate Na is counted using 100 aggregates for one sample.
ANALYSIS BY REACTION KINETICS
In order to obtain information about the particle formation and coagulation
preceding the aggregation in the furnace, the numerical analysis based
on the work of Ivie and Forney (1988) has been applied (Hayashi et al.,
1999). This model includes four kinds of reactions, which are pyrolysis,
nucleation, surface growth and coagulation. Although the model is simple
and does not include so many chemical reactions such as the PAH model,
it is considered that the model is detailed enough to obtain the whole
image of the soot particle formation and to discuss the following aggregation
mechanism in the furnace. We only intend to discuss the results of the
aggregation reactions in the time scale of sub or
few seconds, and the aggregation is considered not to be affected so much
by chemical reactions happening under milliseconds. The reactions involved
are as follows;
Pvrolvsis
The first step is the generation of the soot precursors. It is assumed that a phenyl radical and a biphenyl radical are the precursors.
C6H 6 —> C6H 5 +H, (3)
C6H 6 +C6H 5 <=> C12H10 +H. (4)
Nucleation
Acetylene was regarded as the initial block of soot particles in Jensen's model (Jensen, 1974), because Jensen's model was focused on methane pyrolysis. Due to the availability of phenyl radicals and biphenyl molecules during the benzene pyrolysis, these species are assumed to grow up to the initial nuclei. The nucleation reaction is expressed as follows:
N y +nG x —>Pz (5)
Ny: nucleatig species containing y carbon atoms (C6H5 or C12H10),
Gx: growth species containing x carbon atoms (C2H2, C2H3 or C4H3),
Pz: particle containing z = 14 carbon atoms
n=(z-y)/x.
Surface Growth
The nuclei colliding with the growth species leads to surface growth. The nuclei grows up to the particles by this reaction. There are two methods, the moment method and the discrete method, those can predict size distributions of aerosols (Xiong and Pratsinis, 1991). In the moment method, the size distribution of particles is calculated by assuming the initial size distribution called the self-preserving distribution. In the discrete method, particles are classified to a certain number of discrete size classes. The changes of the size distributions are calculated by the coagulation rates between the size classes. The latter method was applied because it needs no assumption of the initial size distribution that can not be measured and it provides the whole profile of soot generation, which is the main object of this study. The surface growth reactions are expressed as follows:
Px + n(C2H2,C2H
3 or C4H3) —> Py,
(6)
where Px and Py and represent the particles which belong to the size class x and y. Table 1 shows the 10 discrete particle classes based on Jensen's model (Jensen, 1974).
Table 1 Characteristics of discrete particle size classes
| Class | Num. of C atoms [-1 [nm] |
Dia. | Class | Num. of C atoms [-] [nm] |
Dia. |
| a | 14 | 0.63 | f | 1.27x10⁶ | 30.0 |
| b | 50 | 0.97 | g | 2.00x10⁶ | 35.0 |
| c | 443 | 2.0 | h | 2.55x10⁶ | 38.0 |
| d | 11200 | 6.0 | i | 3.42x10⁶ | 42.0 |
| e | 66553 | 11.0 | j | 4.19x10⁶ | 45.0 |
Coaoulation
Once particles are formed, collisions between two different particles
will occur with the growing of particle size. These coagulation equations
are similar to the molecular species equations and can be thought as a
chemical reaction. The description is as follows;
Py + nPx —>Pz
(7)
where Px represents the particle containing x carbon atoms.
The equations describing the growth and coagulation symbolized by Eq.
(7) is
d [ Pz ]/dt = fxy [ Px
]z [ Py ]/n ,
(8)
where fxy represents the Brownian coagulation rate
constant for the particles in the size class x and y. As shown in Table
1, each of the particles belongs to 10 classes of different sizes, fxy,
is dependent on the Knudsen number Kn (=2 ![]() g/dp)
which is represented by a mean free path of gas
g/dp)
which is represented by a mean free path of gas ![]() g
and a particle diameter dp. In the case of transition regime (0.01 =<Kn=
< 10), fxy is obtained from Eq. (9) (Fuchs, 1989):
g
and a particle diameter dp. In the case of transition regime (0.01 =<Kn=
< 10), fxy is obtained from Eq. (9) (Fuchs, 1989):
![]() , (9)
, (9)
gij =(gi2 +gj2)0.5
(10)
![]() , (11)
, (11)
![]() , (12)
, (12)
where dei, Di and ci
represent the diameter, the diffusion coefficient and the mean thermal
velocity of particle i, respectively, cij is
the geometric mean of the mean thermal velocity of ci
and cj. ci is represented by Eq. (13)
as:
![]() , (13)
, (13)
The 19 chemical species and 194 elementary reactions were considered. The adopted reaction rates parameters were the same as work of Ivie and Forney (1988). Gear's method was used to solve the simultaneous differential equations. The temperature profile shown in Fig. 2 was approximated by the equation of the sixth order and the equation was taken into consideration.
SIMULATION METHOD OF AMP MODEL
We carried out the cluster-cluster aggregate simulation based on the
work of Hayashi et al. (1999). The diffusion coefficient D of the
particle or the aggregate is expressed by Eq. (14) (Friedlander, 1977).
This is the Stokes-Einstein expression for the diffusion coefficient.
![]() , (14)
, (14)
where k is Boltzmann constant, T is the temperature,
f is the corrected Stokes friction coefficient given by Eq. (15).
![]() , (15)
, (15)
where µ is the viscosity of gas, deq is the equivalent volume
diameter of an aggregate, C is the slip correction factor given
by Eq. (16). In the case of a single particle, dp is applied instead of
d,q. So the following expressions will be focused on an
aggregate.
![]() , (16)
, (16)
whereas, A2 and A3 are constants, dee is obtained by Eq. (17).
deq = n l / 3 d p , (17)
where dp is the primary particle's diameter of the aggregate and n is
the particle number per aggregate. I in Eq. (16) is the mean free
path of the gas molecule given by Eq. (18).
k=0.86n 1/3,
(19)
In the case of a single particle, k=1. The aggregate diffusion
coefficient D is obtained by Eqs. (14)-(19). The aggregate mean free path
d is obtained from D by Eq. (20).
![]() , (20)
, (20)
where the mean thermal velocity is expressed by Eq. (21) according to
the Einstein's Brownian motion theory (Einstein, 1905). m is obtained
by Eq. (22),
![]() , (21)
, (21)
![]() , (22)
, (22)
where ![]() is the
density of the soot. The aggregate mean free path
is the
density of the soot. The aggregate mean free path ![]() is
obtained by Eq. (20) incorporated with Eq. (21) and (22).
is
obtained by Eq. (20) incorporated with Eq. (21) and (22).
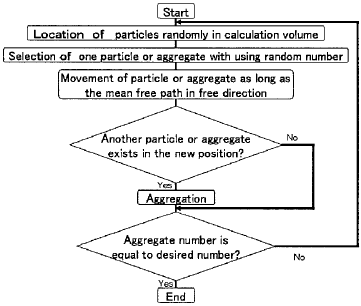
Figure 3 Flowchart of AMP Model
By calculating Eqs. (14)-(22), the following information is obtained;
the mean free path of nitrogen molecule l is 496 nm at 1573 K. The mean
free path of a single particle of 50nm in diameter is 99.7 nm. The Kn
is 19.8 and this value means that the particle exists in the condition
of the free molecular regime (Kn>10) at 1573 K. In the present
simulation, the large mobility of an aggregate must be considered. Then,
a new simulation model is developed for the large mobility of soot particles
in high temperature gas in which particles and aggregates undergo random
walks according to the length of the mean free path obtained by Eq. (21).
The flowchart of simulation is shown in Figure 3. In this calculation,
sticking coefficient is regarded as 1.
RESULTS AND DISCUSSION
Exoerimental Results
Figure 4 shows the particle diameter and the Dperi in the
case of the residence time 0.5sec. Panicle diameter increased with the
residence time. On the other hand, Dperi was almost uniform.
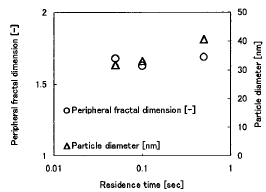
Figure 4 The profiles of the Dperi and the particle diameter
with the residence time
Calculated Results of Reaction Kinetics durino Benzene Pvrolvsis Figure
5 shows the change of the particle diameter in the case of residence time
0.5see. At the beginning of the uniform temperature region, particle growth
occurs. It is verified from experiment that soot adheres to the interior
wail of aiuminum tube.
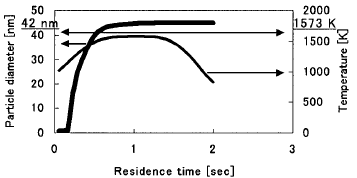
Figure 5 Prediceted change of particle diameter with residence
time 0.5see
Figure 6 shows the panicle number concentration of each particle at
1473, 1373 and 1273K. In 1473K, the domain particle is small particle.
However, as the temperature decreases, the distribution of the particle
number concentration is going to be broad. Figure 7 shows the profile
of fxy (Brownian coagulation function) between size
a-j particles at 1373K. fxy between the different size
particles is larger than one between the same size particles.
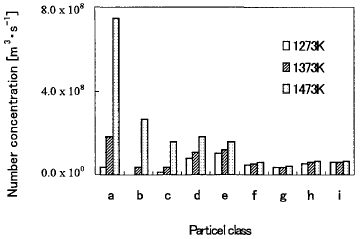
Figure 6 Number concentration of particles at 1473, 1373 and 1273K
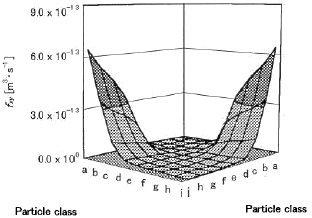
Figure 7 Brownian coagulation function between size a-j
at 1373K
Comoarison between the soot obtained by experiment and the aooreoate simulated by AMP model
The experimental and calculated result for residence time 0.5secis taken
as the object of AMP Model. In residence time 0.5see, the particles mean
diameter is about 42nm in experiment (see Fig. 4) and the particle diameter
grows up to 42nm at 1573K in calculation (see Fig. 5). Table 2 shows the
comparison between the soot (measured) and the aggregate (predicted).
Table 2 indicates that the aggregate simulated by AMP model is more complex
in the shape and Dperi than the soot obtained by experiment.
In AMP model, it is assumed that the considered particles have uniform
size (the particles mean diameter is 42nm). However, as shown in Fig.
5, with temperature decreasing, the distribution of the particle number
concentration is going to be broad, i. e. various size particles exist.
In addition, since fxy, between different size particles
is large (see Fig. 7), it is supposed that a soot includes various size
particles. Dperi of the soot 1.52 is thus larger than
one of the aggregate 1.47.
Table 2 Comparison between the soot (measured) and the aggregate (predicted)
| measured | predicted | |
| Diameter [nm] | 42 | 42 |
| Particle number per aggregate [part] | 38 | 38 |
| Dperi [-] | 1.52 | 1.47 |
CONCLUSIONS
Experiments and numerical simulations were carried out to analyze the soot aggregation mechanism of benzene pyrolysis in a tube furnace. Following conclusions are obtained.
- With residence time, particles mean diameter increase. On the other hand, Dp,ri is uniform.
- fxy (Brownian coagulation function) between different size panicles is larger than one between same size particles.
- Dperi of soot is larger than one of aggregate.
- It is supposed that a soot is consisted of various size particles.
REFERENCES
- Einstein, A, 1905,Ann D Physik, 1_7, p. 549.
- Friedlander, S. K., 1977, Smoke Dust and IIaze: Fundamentals of Aerosol Behavior, Wiley, New York, p. 24.
- Fuchs, N. A., 1989, The Mechanics of Aerosols, Dover, New York. Gerspacher, M and O'Farrell, C. P., 1991, Elastmetrics, 123, p. 35.
- Hayashi, S., Hisaeda, Y., Asakuma, Y., Aoki, H., Miura, T., Yano, H. and Sawa, Y., 1999, Combust. Flame, 117(4), pp. 851-860.
- Herd, C. R., McDonald, G. C. and Hess, W. M., 1992, Rubb. Chem. Tech., .65, pp. 107-129.
- Ivie, J. J. and Forney, L. J., 1988, AIChE J., 34, pp. 1813- 1820.
- Jensen, D. E., 1974, Proc. R. Soc. Lond. A., 338, pp. 375-396.
- Koylii, U. O., Faeth, G. M., Farias, T. L. and Carvalho, M. G., 1995, Combust. Flame, 100, pp. 621-633.
- Meakin, P., 1984, J. Colloid. Int. Sci., 102, pp. 505-512.
- Prado, G. and Lahaye, J., 1981, Particulate Carbon, Plenum Press, New York, pp. 143-175.
- Richter, R., Sander, L. M. and Cheng, Z., 1984, J. Colloid. lnt. Sci., 100, pp. 203-209.
- Samson, R. J., Mulholland, G. W. and Gentry, J. W., 1987, Langmuir, 3, pp. 272-281.
- Stober, W., 1971, J. Aerosol Sci., 2.I1.o.,..4, pp. 453-458.
- Weitz, D. A., Huang, J. S., Lin, M. Y. and Sung, J., 1986,
- Phys. Rev. Lett., 5_7., pp. 2037-2040.
- Xiong, Y. and Pratsinis, S. E., 1991, d. Aerosol Sci., 22, pp. 637-655.
Simulation of soot formation and aggregation in high temperature condition. - Proceedings of 2000 International Joint Power Generation Conference Miami Beach, Florida, July 23-26, 2000. http://asme.pinetec.com/ijpgc2000/data/pdfs/15085.pdf