Ian D. Bishop, Chris Karadaglis
COMBINING GIS BASED ENVIRONMENTAL MODELING AND VISUALIZATION: ANOTHER WINDOW ON TH E MODELING PROCESS
ABSTRACT
Geographic Information Systems (GIS) have become increasingly valuable tools in environmental impact modeling and have been used in the evaluation of development prop osals in many ways. These may relate to specific environmental processes or to more intangible effects such as aesthetic or recreational values. A hitherto quite distinct activity has been the development of GIS driven visualization including realistic vi sual simulation. Typically these processes have been undertaken on separate platforms, by different people and in non-interactive time frames. The increasing availability of very high performance graphics engines offers new opportunities for combining int eractive environmental modeling with interactive visualization within immersive decision support environments. This paper describes the development of such a system combining GIS based modeling of environmental impact with high performance visual simulati on in a multi-channel graphics environment. Specifically it reports work with the Silicon Graphics Reality Engine as a common platform for GIS based visual effects modeling and visualization. This combination of the analytical approach with more subjectiv e visual assessment offers the best of both worlds in terms of information transfer and decision reliability. Techniques for testing the effectiveness of decision support are introduced.
INTRODUCTION
Environ mental change comes in two forms - planned and unplanned. We make determinations as to the direction of urban development or forest management practice but we have less opportunity to prescribe the extent of die-back, fires or salinity effects. In these c ases we can hypothesise and model the spatial progress of environmental change. We can, in some cases, predict the effects of changing management policy using computational models.
Computational models are commonly used in forestry, hydr ology, air pollution research, urban development prediction, and control of fire, salinity and traffic. Those models which use spatial data as part of their input are increasingly being linked to geographic information systems (GIS) - see many examples in Goodchild et al (1993). The numerical output of computer models can be extremely voluminous. In the case of forest management, for example, management decisions can affect timber production, water catchment properties, recreational values, aesthetic valu es, energy usage or employment opportunities. Natural resources management typically requires prediction of environmental changes over long time periods. The changes are also typically dependent on management decisions and constraints applied to the resou rce continuously through the management period. The complexity of the decision environment is further compounded by distribution of management options over large areas which vary substantially in their local characteristics, their proximity to sensitive a reas, the available access or their public visibility.
It has been strongly argued (McCormick et al, 1987) that visualization technology, meaning computer generated graphics and audio, is of unparalleled importance in dealing with such o utput. Persuasive anecdotal evidence exists that visualization has made important scientific insights possible, and it is asserted that the more interactive a visualization is, and the more data it can unambiguously present at once, the more useful it may be.
To date visualization of natural resources data has very often involved high levels of conceptual abstraction, or separation of data into accessible sub-groups. A classic example is the abstraction inherent in map generation by a geographic information system. The GIS also separates data into themes representing different aspects of the environment. Abstraction is not inherently bad, but achieving less abstract mappings is desirable, because it is likely to yield more universally understandable visualizations (Haber & McNabb, 1990). One style of visualization which is inherently less abstract is called the "natural scene paradigm" (Robertson, 1991). This involves creating a visual simulation that is highly evocative of real views of real situations.
As decision-making become increasingly an exercise in public consultation and compromise, decision support requires that all aspects of a project be clearly understood by the public. Bishop (1994) argues that th e non-scientific audience for computer generated information want abstraction minimised, information content maximised and the whole package digestible and non-threatening. This suggests the use of a visual realism approach which shows the information con sumer (decision-maker or public) what will/may happen under a variety of conditions and permit the consumer to explore the alternative environments using their natural sensory perceptions. Those not trained in interpretation of abstract information should be able to work at a more intuitive level. This calls for an interactive approach to the visualization process.
As we are increasingly inclined to undertake spatial and dynamic process modeling with a GIS as the underlying source of mode l data, it seems natural that the GIS should also be the source of data for visual simulation.
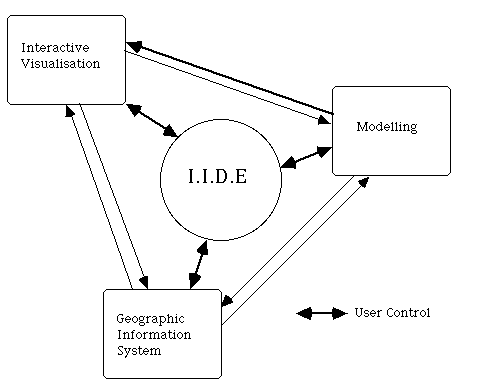
This suggests that decision support be considered as a two part process. It cannot be described as a two stage process because i deally the two components - modeling and visualization - operate together in an interactive computational environment. The modeling feeds the visualization, which influences the human operator who changes the modeling parameters (Figure 1).
The objective in linking the modeling process to one or more visualization procedures is achievement of high levels of information presentation together with high levels of interactivity showing change of time and the results of management decisions. U ntil very recently it was not possible to achieve simultaneous success with both these objectives. One had to choose between information content and interactivity. More powerful workstations, faster graphics and a more systematic approach to the process o f visualization are bringing the goal much nearer. However in the example described here the visualization is interactive but the modeling is not. The model - which is written within a GIS and which defines the visual impact of a highway proposal - is run , for a set of decision options, prior to initiation of the visualization. In the longer term, a more direct link between the modeling and visualization, such that adjustment of controls on the visualization screen would activate a new model run which in turn would generate new imagery, is anticipated.
A parallel study (Bishop & Karadaglis, 1996) concentrated on visual realism in the visualisation process. This study uses more abstract means to present the output of the modeling proce ss.
Figure 1. In an fully interactive immersive system all linkages are bi-directional. The key linkage being developed in this work is the feed from modeling to visualization.
< p>VISUAL EFFECTS MODEL
The model has variables associated with each of three entities: the observer; the introduced object and the environment (Figure 2).
The Observer
The observer is any person with a line of sight to any object and who is potentially affected by the its visibility. It is assumed that the impact of the structures on any location depends upon both the expectations of each o bserver and the number of observers. In the model, existing roads can be used to give an approximation of the frequency of use. Estimates would be improved by traffic counts. Estimated scenic beauty - generated from an additional GIS based model (Bishop, in press; Bishop & Hulse, 1994) - can be used as a surrogate for probable user sensitivity on the assumption that the more attractive an area the more sensitive the user is likely to be to visual intrusion. From these two mappings cell sensitivity va lues are generated and normalised for the area.
The Object
Although the model will work with a single object most of the development has been based on analysis of linear features. Two special cases ar e electricity transmission lines and highways.
A transmission line has four major visual elements: the easement, the towers, the conducting wires and access tracks (Hadrian et al, 1988). Of these the towers are usually the most prominent feature. A transmission structure can be characterised according to its nominated location, a specific height and one of a restricted range of shapes. In the case of elements such as roads or pipelines there is no discrete element about which to compute i mpact values (except perhaps in the case of major interchange structures), the model therefore uses points along the feature - either turning points or points at regular intervals.
The visual effect of an introduced element is assumed to be highest when the observer is very close to the object and has a direct line of sight. The visual effect then decreases with distance. The current implementation of the model uses a linear distance-impact decay function although there is evidence (Hull & Bishop, 1988) that the impact is proportional to (1/distance).
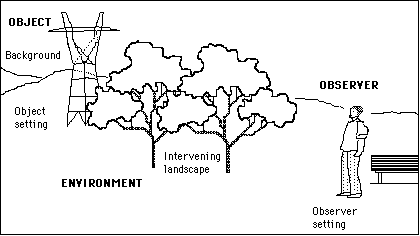
Figure 2. Major components of the model (after Hadrian et al, 1988)
The Environment
The environment is considered as a combination of landform and land cover. Topography and vegetation are the particular surface features included in the visual analysis.
The nature of the environment determines whether line of sight exists between the object and the observer (viewability), and whether the landscape between the object and the observer provides any significant visual absorption of the object. Vi ewability is derived from surface of the land, the height of surface features and the degree of visual penetration they permit. Different vegetation types permit different amounts of visual penetration. Height is kept as a grid value while screening perce ntage can be set interactively to conform to the vegetation types and patterns of the study environment.
In addition to providing screening of the object, the landscape between the object and the observer has a capacity to absorb the obje ct and still maintain its inherent visual character and quality (Yeomans, 1979). Landscapes, such as open water, which have very limited absorption capability have a default value of 1. More complex landscapes are assigned higher values by the user. Event ually a knowledge-based system will provide assistance to the user in setting parameters such as screening percentages and visual absorption ratios.
GIS IMPLEMENTATION
Modeling based on spatial data within a GIS can be undertaken as a stand-alone operation with data being transferred between the GIS and the modeling software via import and export facilities. This approach has the advantage that the modeling process itself may be very fast and efficient running in compiled and optimised code. While the modeling itself may be very fast the process of data transfer between the GIS and the model may be slow and awkward. The alternative chosen (Bishop & Robey, 1994) was for the m odel to run within the GIS package being written as a series of GIS commands: in the language of ARC/INFO as an AML (Arc Macro Language). Chou (1995) and Abel (1994) provide a more complete classification and comparison of the procedures for linkage of GI S with environmental modeling.
The process was divided into a separate modules for:
* object specification
* model operation
* analysis and mapping of results.
The original procedures for analysis and mapping (Bishop & Robey, 1994) are not described here because they are being replaced by the developing visualization system.
Object Specification
In the case of a transmission line the indivi dual tower positions and heights are kept in a file. The user may specify that some or all of the towers are to be included in the modeling. A choice can also be made whether to generate individual impact maps or a composite impact assessment.
Highway impact analysis is based on a road - or network of roads - defined as lines in an ARC/INFO coverage. The user chooses to base the analysis on either the nodes and vertices defining the roads - a quick but not very accurate approach - or on all the points along a road as derived by first doing a LINEGRID conversion followed by a GRIDLINE conversion. This creates a coverage in which there are points all along the road at intervals roughly equal to the grid size. Analysis then takes considerab ly longer but is also more complete.
Model Operation
Based on uniform reduction with distance, the visual effect is initially radially symmetrical about a tower or highway point. The COSTDISTAN CE function is used to determine the distance over which the effect of a single structure is felt to be significant. However, the intervening landscape's capacity to screen and to absorb visual effects results in different observers, at equal distances fr om a tower, being affected differently. Thus, a grid of visual absorption is incorporated into the COSTDISTANCE function as the 'cost-grid' to act as an impedance to the visual impact.
Once the initial distance-decay associated with visua l impact has been modelled a viewshed analysis (VISIBILITY) is done determining line of sight between a point midway up the tower and each cell falling within a specified distance range of the tower, taking into account screening height and percentage.
The impact of a line is taken as the sum of the impacts of the individual towers - or the sample points along the road in the case of a highway (Figure 3).
THE VISUALIZATION TOOLKIT
The visua lization component of the work is based on IRIS Performer Toolkit (Rolf & Helman, 1994) running on an SGI Crimson based Reality Engine. Performer provides a host of C and C++ based commands which can be called from user developed programs. These comma nds provide for the loading of various data formats, interactive movement of the view position and of objects within the modelled environment and development of GUI 'widgets' for control of other aspects of the visual presentation. The loaded data is spat ially segmented to provide for optimum redraw speed making maximum use of the Reality Engine graphics pipeline. The Reality Engine provides for hardware based polygon texture mapping with no time penalty relative to simple surface shading. Performer, with Reality Engine, has been used in the urban planning context (Liggett & Jepson, 1995) and in battlefield simulations but we are not aware of its previous application to regional or natural resources planning.
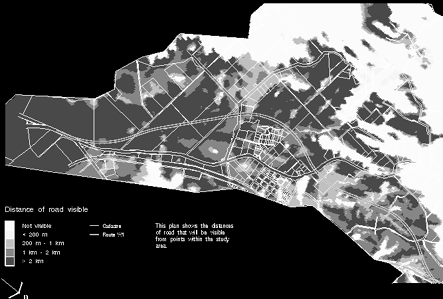
Figure 3. Conventional GIS generated map output from visual impact model
DEVELOPMENT OF INTEGRATED SYSTEM
The conceptual ideal is for three independent systems to be closely coupled thro ugh transparent interfaces and communication protocols: transformers, constructors and accessors (Abel et al, 1994). In practice, however, compromises to this ideal were necessary. The comparative slowness of the modeling process, the proprietary nature o f the GIS data structures and the flexibility provided by working in C in conjunction with the Performer toolkit mean that the development work described here is essentially focussed on the visualization component. The model outputs are written into the G IS as attributes to the analytical polygons and the GIS then exports these results and the height field in raster format.
The visualization procedures described and illustrated in this paper were designed initially to work in a forest ma nagement context (Bishop & Karadaglis, 1996). In that instance the visualization sought to represent in a visually realistic way changes in forest conditions over time. In adapting those procedures to work with visual effects data and to represent th e output in a more abstract manner we are to some degree under-using the capabilities of the system.
Visualization Data
The data to be visualised consist of the following :
* An ARC/INFO fi le containing sampled elevation data for the Black Forest Section of the Calder Highway, Victoria realignment. The file also contains the number of rows and columns, as well as the extent of the data. The 3 dimensional DTM is constructed using this data.
* The results of simple viewshed and more complex visual impact modeling in ARC/INFO format, sampled at the same resolution as the DTM. These files are referred to as visual effects files (VEFs). One VEF exists for each sample point of each rout e under each set of modeling assumptions (i.e. each model run).
* Definitions of the various variables which correspond to the decision variables of the model runs. The variable information is defined in a Variable Definition File (VDF).
* Definitions of the various thumbnail textures (or colors in this example) which are used to change the appearance of the original DTM model. An internal variable ('vis_imp') is calculated for each cell based on the VEFs, and the value of this variable d etermines which color or texture is applied in that cell.
* An overall - existing conditions - aerial image of the terrain. This texture which is mapped onto the DTM surface could be a satellite image or aerial photograph or some mapped informati on (e.g. the cadastral boundaries or the stream network). This information blends with the colors representing visual impacts. The user may also switch between an aerial photograph and mapped information or switch off this texture altogether.
Rules for visualising the data :
Model runs can be the combination of several user defined variables (specified in the VDF). For each permutation of the values of the user defined variables, there exi sts a model run, and a corresponding set of VEFs. The set of VEFs represents the results of visual impact studies for all points along the route.
The initialisation process involves reading in all VEFs. Specifying the large number of VEF filenames is not necessary due to the VDF loader, which uses data from this file to automatically create a set of filenames to load. In addition, the VDF contains information which builds GUI widgets (e.g. defining maximum impact distances or rates of vis ual absorption) which can be used to select the particular model to view while the simulation is running.
Once all VEF data is loaded, the simulation begins. Two GUI sliders, 'Route Start Point' and 'Route End Point' are used to specify t he segment of the route. Once a segment is defined, the cumulative visual impact effects for each point in the segment are calculated, and colors or thumbnails are assigned to each cell. These cells are then rendered and the simulation continues.
Program description :
The application program, "ide", was built on top of an IRIS Performer demonstration program, "perfly". Customization to our application involves initialising and reading in al l the VEFs and building an appropriate scene graph, which is then rendered at a fixed frame rate.
The elevation ARC/INFO file (*.e00), the Thumbnail Definition File (TDF), and the Variable Definition File (VDF) are specified through the c ommand line as follows:
ide calder.e00 calder.tdf calder.vdf
The full structure of the TDF and VDF files is explained in Bishop & Karadaglis (1996).
These files are loaded during th e initialisation phase, their cumulative effect is computed and the impact on the landscape at each grid cell is calculated. If found to cause mappable visual impact, an appropriate color or texture thumbnail is selected and rendered at that position.
Program Initialisation :
The initialisation sequence includes:
* Load the VDF and TDF files, and build a list of VEF filenames.
* Load the elevation ARC/INFO file, and bui ld the default DTM.
* Load all VEF ARC/INFO files, and calculate the cumulative effects of the highway for each cell for each variable value permutation.
* Examine the TDF and map the colors or thumbnail textures to the appr opriate cells which are visually affected by the highway.
* Using vertex and surface normals from the default DTM, and texture scaling coordinates from the TDF file, build a DTM model for each variable value permutation.
* At tach each visual effects model to a switch node, using an internal index value which can later be used to select the required DTM to be rendered.
* Initialise the environment model. This includes defining the sun as an infinite light source, and s etting the horizon colours.
* Initialise and build the GUI interface, including any new variable widgets that are defined in the VDF.
Real time visualization :
Once initialised, the "ide" application enters the real time component. The default DTM is displayed. Motion is accomplished by choosing a motion model and using the mouse. The following motion models (from "perfly") are currently available :
* "fly" : Allows changes in heading and pitch using the mouse. Acceleration is possible using the mouse buttons. No changes in roll are allowed.
* "drive" : uses terrain following to determine the pitch and roll relative to the direction o f the surface immediately below the viewpoint. A constant height above the terrain is maintained. Heading and acceleration changes are accomplished using the mouse.
* "track" : permits no viewpoint motion but allows the user to change the positio n and orientation of the DTM in all 3 axis.
The viewpoint can be repositioned at any time to just outside the bounding sphere of the DTM, or to its centre, using GUI buttons.
Selecting a visual impact result to display is accomplished through either using the menu for user defined variable ("distance" is specified by start point and end point sliders, all others are implemented as menus), or by using a keyboard shortcut. Once a user defined variable widget has been sele cted, an internal index is used to switch to the correct visual effects map for visualization.
Zoom is possible by changing the Field of View slider in the GUI. The DTM can be scaled in the Z direction to accentuate changes in the shape of the terrain. Surface normals are currently not updated in this mode.
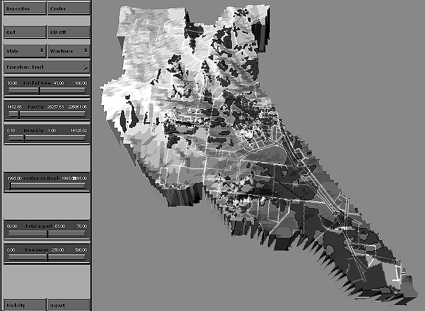
Figure 4. View of model output on three dimensional model of area. The mouse moves the 3D model in real time for rotation or fly-overs. The controls at the left allow the user to select the road segment to be impact mapped or to change other modeling parameters (e.g. assumptions about maximum impact distances or rates of visual absorption).
CONC LUSION
There are a number of readily accessible enhancements to the visualization system developed to date. These include:
* Add Level of Detail switching (a performer node which selects between high resoluti on and low resolution models of the same region based on the distance of the viewpoint from the centre of the model). This will improve the rendering performance of the application since it will allow larger DTMs with effectively the same resolution to be rendered.
* Add window plot interfaces to display the status of additional user definable variables, such as total visual impact. These windows may be implemented using overlays, or by using custom textured polygons (billboards) which ar e moved to ensure they remain visible regardless of the viewpoint position.
* Allow for subsampling of the ARC/INFO files, to either reduce the total number of polygons, or to create a lower resolution scene graph for the collision detect ion library (to improve collision performance).
* Add the ability to sequence through the DTMs rather than switch using the GUI or keyboard. This could be used to animate the visual impact through the construction period for one particula r model, even while the viewpoint is in motion. The application to other modeling projects that project change over time is even more apparent.
* Add stereo graphics to a create more immersive decision environment (Ribarsky et al, 1994). Head-mounted displays and motion tracking provide the opportunity to create a decision environment in virtual reality. A single decision-maker may move through the virtual environment through head or hand movements, while controlling the time or the decis ion variables using a virtual interface. Using multi-channel output several protagonists could be immersed simultaneously ensuring that each is seeing the same visualised effects of changes in model parameters arrived at collectively.
* C reate new motion models which can be defined as splines through user selectable points. Animate the DTMs through time steps while moving.
* Add stress management by building lower resolution DTMs and configuring Performer to drop to a low er resolution model if the graphics load exceeds a particular value. This is particularly important for fixed frame rate, immersive applications (to minimise simulation discomfort).
When the programs which comprise the system have been d eveloped further it will then be appropriate to undertake some rigorous testing of the visualization platform. It has been implicit in this work that enhanced means of presentation of the output of GIS based modeling will enhance understanding of the resu lts and lead to better environmental decision making. This assumption needs to be tested and the value of development in this direction demonstrated. Two approaches to systems evaluation are foreshadowed: information transfer and decision convergence.
In each application specific context there will be some potential users who have an advanced knowledge of the applications domain and others who do not. We plan to test both expert and non-expert decision-makers through exposure to the visu alization environment. During this exposure they will undertake a series of tasks to determine the accuracy of their assessment of complex relationships. Subjects will be asked to estimate parameter values at indicated locations within the data, and to co mpare values at two or more different locations. The accuracy and variation of these responses will be compared with actual values, as a function of the visualization parameters. We will have both "look here" situations, where users areas are indicated b y a marker in the display, and "look where" situations, where users are asked to find the location by description.
We will also test directly the decision support capacity of the systems. This will be achieved using a small group of exper ts within the particular applications area and determining their level of agreement on some planning or management decision based on the different visualization paradigms. The experts might be asked, for example, to select the route for a highway bypass a round a town. If given no information at all a high variance in the position of the chosen routes can be anticipated. As the level of available information - including social, economic, engineering and aesthetic model outputs and visual simulations of dri ving along the routes - increases the chosen routes should converge and the variance decrease.
Our analysis will also make use of measurable aspects of task completion such as overall time, or recurrence of certain actions. The interacti ve patterns of users with the modeling/visualization systems will be monitored by the computer itself and recorded in explicit log files. At the same time the users actions and reactions will also be recorded on video-tape to support the analysis. The res ults of the information transfer and decision agreement experiments will provide a clear indication of the value of the visualization paradigms.
ACKNOWLEDGMENTS
This visualization development was funded by the Australian Research Council. The visual modeling process was developed as part of a larger body of research supported by VicRoads. The data sets were provided by VicRoads in conjunction with a visual impact study undertaken by the Gerner Consulting Gr oup.
REFERENCES
Abel, D. J., Kilby, P. J., & Davis, J. R. (1994). The systems integragion problem. International Journal of GIS, 8, N1, 1-12.
Bishop, I. D., & Karadagl is, C. (1996). Use of interactive immersive visualization techniques for natural resources management. In Visual Data Exploration and Analysis III (Electronic Imaging '96), . San José, CA: The Society for Imaging Science and Technology.
Bishop, I. D. (1994). The role of visual realism in communicating and understanding spatial change and process. In D. Unwin & H. Hearnshaw (Eds.), Visualization in Geographic Information Systems London: Bellhaven Press.
Bishop, I. D. (in press). Comparing regression and neural net based approaches to modeling of scenic beauty. Landscape and Urban Planning.
Bishop, I. D., & Flaherty, E. (1990). Using video imagery as texture maps for model driven visual simulation . In Proceeding of Resource Technology '90, (pp. 58-67). Washington, D.C.
Bishop, I. D., & Hull, R. B. IV (1991). Integrating technologies for visual resource management. Journal of Environmental Management, 32, 295-312.
Bishop, I. D., & Hulse, D. W. (1994). Predicting scenic beauty using mapping data and geographic information systems. Landscape and Urban Planning, 30(1-2), 59-70.
Bishop, I. D., & Robey, M. (1994). Implementing an e nvironmental impact model within a geographic information system. In AURISA'94, (pp. 281-291). Sydney: Australasian Urban and Regional Information Systems Association.
Chou, H. C. (1995). Integrating Environmental Models and GIS. In Int ernational Symposium on Geographic Information System and Environmental Protection, . Taipei, Taiwan: Environment Protection Administration, Republic of China.
Goodchild, M. F., Parks, B. O., & Steyaert, L. T. (Eds.). (1993). Environme ntal Modeling with GIS. Oxford: Oxford University Press.
Haber, R.B. and McNabb, D.A. (1990) Visualization Idioms: A Conceptual Model for Scientific Visualization Systems, in Visualization in Scientific Computing, Nielson, G.M. and Sh river, B., editors, IEEE Computer Society Press, Los Alamitos, Calif.
Hadrian, D. R., Bishop, I. D., & Mitcheltree, R. (1988). Automated mapping of visual impacts in utility corridors. Landscape and Urban Planning, 16, 261-283.
Hull, R. B. I., & Bishop, I. D. (1988). Scenic impacts of elctricity transmission towers: the influence of landscape type and ovserver distance. Journal of Environmental Management, 27, 99-108.
Liggett, R.S. and Jepson, W. (1995) Use of real time visual simulation technology for urban planning/design decision making, Proceedings 4th International Conference on Computers in Urban Planning and Urban Management (v1, 51-64), Melbourne.
McCormick, B.H., DeFanti T .A. and Brown M.D. (eds) (1987) Visualization in scientific computing. Computer Graphics 21(6), ACM SIGGRAPH.
Perkins, N.H. (1992) "Three questions on the use of photo-realisitic simulations as real world surrogates", Landscape and Urban Pla nning, 21, 265-267.
Ribarsky, W., Bolter, J., Op den Bosch, A., & van Teylingen, R. (1994). Visualization and Analysis Using Virtual Reality. IEEE Computer Graphics and Applications(January), 10-12.
Robertson P.K. (1991) A m ethodology for choosing data representations, IEEE Computer Graphics and Applications, May, 56-67.
Rolf, J., & Helman, J. (1994). IRIS Performer: a high performance multiprocessing toolkit for real-time 3D graphics. In SIGGRAPH 94, (pp. 381-394). Orlando, FL: ACM SIGGRAPH.
Yeomans, W. C. (1986). Visual impact assessment: changes in natural and rural environment. New York: John Wiley.
AUTHOR INFORMATION
Ian D. Bishop Chris Karadaglis
Director Research Staff
Centre for Geographic Information Systems and Modeling
The University of Melbourne
Parkville, V 3052, AUSTRALIA
Phone 61 3 9344 6944
Fax 61 3 9347 2916
Ian_Bishop@mac.unimelb.edu.au