![]()
INVESTIGATING THE POTENTIAL DESIGN AND APPLICATION ISSUES ASSOCIATED WITH USING VISUALISATION TECHNIQUES IN COASTAL DECISION-MAKING
S.R. Jude, A.P. Jones and I.J. Bateman
Tyndall Centre for Climate Change Research, School of Environmental Sciences, University of East Anglia, Norwich, Norfolk (UK)
Introduction
In recent years there has been an increasing interest in the use of visualisation
techniques to represent the coastal zone (e.g. Raper, 2000). This has been
driven partly by a perception amongst user communities that the application
of technologies such as virtual reality may aid non-expert understanding of
complicated coastal processes. This is particularly the case for processes
that are difficult to represent using traditional 2D Geographical Information
Systems (GIS) (Raper, 2000). As a result, studies have begun to develop and
test novel techniques for the visualisation of coastal data. Many of these
have involved the use of Virtual Reality Geographical Information Systems
(VRGIS); systems that convert traditional 2D GIS data into a three-dimensional
computer-generated simulation of reality.
Whilst there are perceived benefits over traditional two-dimensional GIS associated
with the use of visualisation techniques, concerns have been voiced about
both design and application issues. In particular it has been argued that
not enough research has examined how the technologies may be practically implemented
in decision making environments, and what design issues may be pertinent to
ensure that they are easy to use (Batty et al., 1998). Indeed, very little
research has investigated whether visualisation techniques offer much in the
way benefit to the majority of end users, and we understand rather little
about the manner by which design issues affect user perceptions and understandings
of the actual environments being displayed. All these unknowns need to be
addressed if the techniques are to be successfully used by the coastal management
community, and they form the basis of this research.
Design issues associated with VRGIS and visualisation
techniques
Two key areas have been the focus for previous research into visualisation
design issues. These are the importance of the level of detail provided in
visualisations, and the potential misuse of the technology by those trying
to 'sell' management schemes and interventions by representing a distorted
view of reality (Sheppard, 2001). Of these, most attention has been focussed
towards level of detail and realism issues. This is partly for technical reasons
because higher levels of realism require greater computing power, particularly
in terms of graphical processing. This is especially the case for systems
where the user is provided with the functionality to navigate through the
environment for themselves. Nevertheless, much of the research undertaken
in this area has been inconclusive as to the optimal level of visual realism
required. For example, Bishop (1994) has that argued high levels of visual
realism are needed to make features understandable to users, whilst Sheppard
(2001) has suggested that more abstract, simplified, representations of environments
may be easier to understand.
Clearly there is a paucity of research investigating what are fundamentally
important areas that could determine the potential effectiveness of visualisation
techniques in the management of the coast. Visualisation design elements such
as the provision of animation, interactivity, and user interfaces have received
little attention, but could prove ultimately more important that those that
have been the primary focus for research to date. Furthermore, there has been
very little investigation into how visualisation techniques may be effectively
deployed within organisational structures and current decision-making processes.
Using a case study of the north Norfolk coast in eastern England, this article
reports on a research project that is developing and testing the use of an
integrated VRGIS methodology for the assessment, visualisation, and communication
of the environmental impacts of several proposed real-world management schemes
Methodology
Virtual reality visualisations were produced for a number of proposed flood
defence schemes located along the north Norfolk coast, England. For the purpose
of this paper, examples from a case study site at Holme-Next-the-Sea (Holme)
will be described. The site comprises freshwater grazing marshes that are
a designated nature reserve, along with low-lying agricultural land, both
of which are protected by a natural dune system and an earth flood embankment.
During the early 1990s rapid dune erosion was experienced, prompting concern
for the protection of the site from seawater inundation. Although present-day
erosion rates have reduced, a number of alternative management options remain
under consideration for the site, and the recently published Coastal Habitat
Management Plan (CHaMP) produced for the north Norfolk coast (English Nature
and Environment Agency, 2003) highlights the possibility of flooding much
of the site in the next 10 years. Thus, the locality provides an opportunity
to create and test a range of visualisations that represent a number of possible
management interventions.
Visualisation - Production
Visualisations representing the site as it looks at present, and how it may
look in the future under a number of alternative management interventions
were produced by extending the methodology outlined by Jude et al. (2001).
The management interventions adopted ranged from protecting the reserve through
the construction of new earth flood embankments, to partial or full managed
realignment of the site. Various visualisation types were created to illustrate
the impact that a possible partial realignment scheme would have. They were
all produced using similar viewpoints, enabling any variations in perceptions
and understanding associated with the various techniques to be determined.
A range of different types of visualisation were created so as to enable the
assessment to be made of their design elements, and their influence on user
understanding and satisfaction with the scheme. The software used in the research
included ArcView/ArcGIS 3D Analyst from ESRI and World Construction Set from
3D Nature. These packages were selected because of their low cost, and provision
of functionality to enable the production of alternative visualisation types.
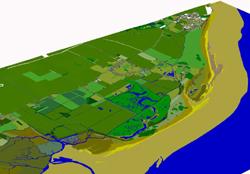
ArcView was used to create both static eyelevel images and user-navigable
interactive 3D scenes, whilst World Construction Set was employed to produce
static eyelevel and animated visualisations. The animated visualisations were
created by rendering an image sequence along a flight path running across
the site, images from which were subsequently complied into an AVI animation
using QuickTime. To enable these to be compared against traditional 2D cartographic
techniques, a range of landcover maps were created using ArcView.
 |
 |
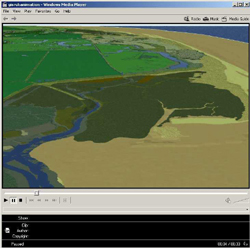 |
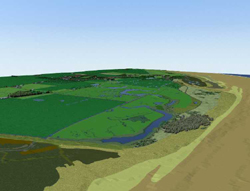
| A. ArcScene interactive | B. World Construction Set | C. World Construction Set animation |
Figure 1. Examples of the types of visualisations created for the research.
Assessing the Visualisations
The visualisations were assessed in three ways. Firstly, individual survey
experiments were undertaken to investigate whether the different methods of
presenting information influenced individuals understanding and perceptions
of the same management scheme. These experiments were also used to identify
any influential design aspects. Secondly, group experiments were conducted
to gain an insight into how the participants felt the visualisations could
be applied in deliberative decision-making. Thirdly, interviews were held
with coastal managers to investigate the broader efficacy of the visualisations
in coastal management processes.
Survey Experiments
In total three survey experiment sessions were conducted. The first session
utilised a data projector to present the visualisations to participants, whilst
the other two involved users downloading visualisations from the Web (Figure
2) or, in the case of the ArcScene visualisations, viewing them using a PC.
The survey experiments were designed so that the visualisations were presented
to participants in a similar manner for each of the three sessions. Thus,
the participants were shown one of the different types of visualisations representing
the site both 'before' and 'after' the management intervention, and were then
posed a number of questions. The aim of the questions was to identify the
degree to which participants understood the scheme and were happy with it.
Further questions were posed about the perceived impacts of the interventions
on habitats, birds, farmland, recreational amenity, and landscape.
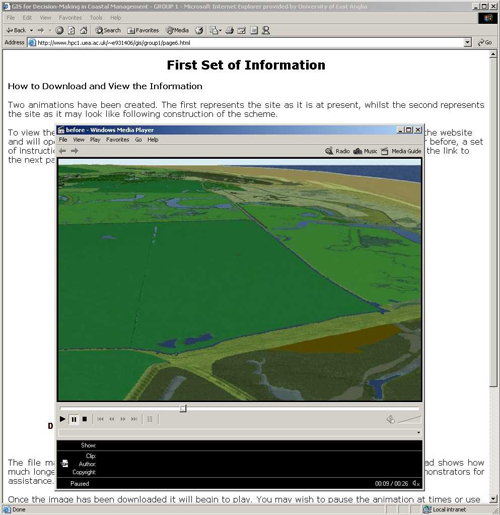
Figure 2. An animation of the Holme study site from one of the Web pages used in the survey experiments.
The survey experiments employed a mixed quantitative
and qualitative methodology with each question requiring the selection of
a quantitative response and the provision of a qualitative reason for the
choice. Thus the outputs from the surveys provided a general insight into
the individual's feeling about the visualisations and their design, along
with a dataset that was amenable to hypothesis testing and statistical analysis.
Overall 195 participated took part in the survey.
To complement the individual surveys, group experiments were used to investigate
a range of design and application issues that were not explored in the individual
survey experiments. The group work used the same participants as the individual
survey experiments, but was run using groups of four to five people to discuss
and provide feedback on each of the issue covered. The issues posed related
to whether the groups felt that they could make informed decisions regarding
the scheme presented, and also covered specific design issues such as the
use of static versus animated images. Further questions related to opinions
concerning possible improvements the levels of visual clarity and realism
in the images, the use of the Web to disseminate them, and the level of information
they provided.
Interviews with Coastal Managers
To assess whether coastal managers felt that the visualisations could be applied
practically in coastal decision-making processes, and to identify problems
that they foresaw when trying to practically employ them, interviews were
held with a number of representatives from organisations involved in managing
the north Norfolk coast. In total five interview sessions were conducted with
six coastal managers, and in each a semi-structured interview design was applied
to allow a flexible approach to issues under discussion. The questions raised
during the interviews related to the potential practical application of the
visualisations, and were chosen to identify the possible benefits and drawbacks
of their use in coastal management. The visualisations demonstrated included
examples of work produced for Holme and another study site at Brancaster (Jude
et al., 2001). They were presented using a laptop computer.
Results and Discussion
The results of the individual surveys, together with the focus groups and
interviews with coastal managers, suggest that the visualisations may be of
use both in the communication of complicated scientific and management information
to members of the public, as well as during the formulation of management
policies. Indeed, the results from the individual surveys showed that 59%
of participants rated the visualisations as being 'good', and 6.2% thought
they were an 'excellent' means of communication. Another encouraging finding
was that both the survey participants and the coastal managers tended to agree
that the visualisations conveyed the information about the scheme in a clearer
manner than traditional means of communication such as the generation of artists'
impressions and the use of traditional management document maps.
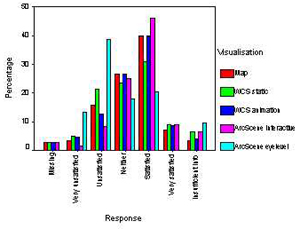
Variations in Understanding and Perception
One of the key findings to arise from the individual survey experiments was
that perception and understanding varied strongly between the impacts being
shown. This was particularly evident with responses to the questions comparing
differences in user satisfaction with information presented between the alternative
visualisation types (Figure 3). Of particular interest are the significantly
lower mean satisfaction ratings associated with the ArcScene eyelevel and
WCS static eyelevel images when compared with the other visualisation types
and the traditional maps. This finding was also reflected in responses to
the questions regarding happiness with the scheme. Here again, the WCS static
visualisations were associated with significantly lower mean ratings than
the other types. These differential satisfaction ratings illustrate how the
mode of communication could influence more general perceptions of the likely
efficacy of schemes, and could therefore introduce unwanted biases if part
of a practical decision-making process. Potential explanations for these findings
were identified from the qualitative responses, and these include a dislike
of the perspective portrayed by the WCS static visualisations, possibly because
the eyelevel viewpoint they accentuated the foreground impacts of the scheme.
 |
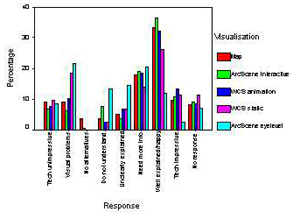 |
Figure 3. The quantitative (left) and qualitative responses (right) to the level of satisfaction questions posed in the survey experiments.
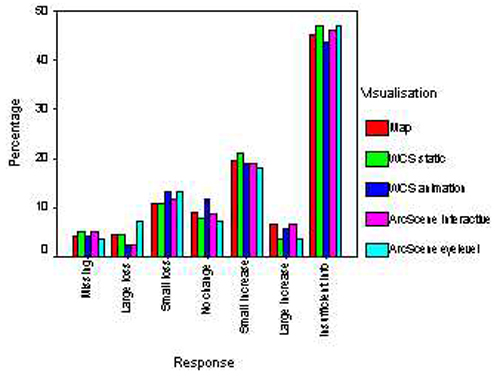
Figure 4. The quantitative response distribution for the question asking participants to identify the impact that the realignment scheme would have on the site's bird populations.
Whilst the response distributions for some questions were found to vary between visualisation types, the results from some were very consistent. For example, the response distributions associated with those impacts that the participants were asked to rate, and for which little information was provided, did not vary strongly. This was especially the case for the more difficult to assess impacts, such as those on birds, the landscape and recreational amenity. For example, the responses shown in Figure 4 overwhelmingly show that insufficient information was presented about the effect of the scheme on bird numbers visiting the site, and that this was true for all of the visualisation types, highlight the need for background information to reinforce the picture portrayed.
Visualisation Design Issues and Potential Solutions
A number of key design issues were highlighted by the results from the individual
and group experiments, and these have potentially significant implications
for those wishing to create visualisations for use in coastal decision-making
processes. Respondents had mixed views on the need for high detail to assist
with the interpretation and understanding of the scheme. Indeed, a number
of participants found the less detailed ArcScene interactive scenes to be
easier to interpret than the more complex WCS static images. A number of possible
explanations exist for this. It is possible that the clearly defined landcover
polygons provided in the ArcScene interactive visualisations made features
easier to distinguish. Thus, it could be that there is no need to provide
rich visual information and detail unless particular features of interest
are annotated or highlighted. Indeed, no matter how high the level of detail
used, it is not clear how the representation of less tangible features such
as recreational access, or levels of biodiversity might be achieved.
Strong opinions were raised regarding the different image viewpoints presented in the surveys. These highlighted a division in opinion between those preferring the static, animated, and interactive forms of visualisations. The findings from the surveys suggested a significant proportion of the participants who were unhappy with the use of eyelevel images felt that they had been chosen to illustrate particular locations where the scheme might be shown in a particularly poor or favourable light. Of course, in reality, decisions about the merits of a management intervention will ultimately be influenced by personal preference and interest in different aspects of the scheme, making the selection of appropriate static viewpoints particularly problematic.
Fly-through animations that present an aerial view of a site using an elevated flightpath are often perceived as being an effective means to represent an environment. However, the findings from this research show a split in opinion exists regarding their use. A common comment from those who did not find the fly-through useful was that people are unlikely to have experienced flying over a site and hence may find it difficult to orientate themselves in the environment or interpret how the landscape may look from the ground. Significantly, those who downloaded the visualisations from the Web were happier with the animations than those who were shown them on a projection system. This is possibly because those downloading the animations from the Web had a higher level of control over them, with the ability to pause and replay the files, and this may have assisted with their interpretation of the scheme.
One of the biggest limitations identified with the animations was the restricted view of the site that they presented. One solution may be to use higher altitude flightpaths in future to include the whole the site and the surrounding area. A more challenging problem to address though is the need to overcome the difficulties that some participants experienced when comparing the 'before' and 'after' sequences. A particular drawback was that they were presented as two separate files, and it was difficult to display both at a suitable size on screen at the same time. To overcome this, both the 'before' and 'after' frames could be combined to create a single animation displaying both fly-throughs side by side. Furthermore, annotation could be added to highlight particular landmarks and features at the site, and the addition of an accompanying audio commentary may also assist.
The survey results suggest that the provision of interactivity is important to users to overcome many of the limitations associated with the static and animated visualisations. Indeed, many users preferred the extra functionality offered by the interactive scenes. Interactivity certainly removes the bias of viewpoint selection as users can select viewing locations for themselves, and learn about a scheme by navigating and exploring the visualisations. However, despite the potential importance of interactivity, a number of problems were identified with its use. Some found that navigating around the 3D scenes was cumbersome, especially when they were attempting to select similar viewpoints that represented the site before and after the implementation of the scheme. Providing the same viewpoints in two windows is a technical challenge that could be overcome by using predefined viewpoints within the scenes, or even dynamically linking the two windows. Nevertheless, despite the fact that interaction was important to many users, a significant finding was the reluctance some to use the system due to their unfamiliarity with the use of computers in this way. This was particularly evident with the coastal managers where only one of the interviewees accepted the invitation to navigate the visualisations for themselves.
Application Issues in Coastal Management
All of the coastal managers felt that the visualisations had a potential role
to play participatory coastal zone management. Furthermore, they were generally
perceived as being easier to understand than traditional maps and management
plans, and it was also felt that members of the public would understand the
information being presented in them. The key area of concern that was expressed
by managers was how well the visualisations reflect and communicate the dynamic
nature of the coastline. However, considerable interest was expressed in the
possibility of developing visualisations that can be edited in real-time by
users for use in meetings to develop and test management interventions. An
additional area of interest was the possibility of creating visualisations
of historical and future coastlines, although this raises the challenge of
developing new means of representing uncertainty. A number of possible forums
in which the visualisations could be used were suggested by the coastal managers.
These included meetings, interactive workshops with stakeholders, information
leaflets, and public exhibitions.
Whilst the research focussed on creating relatively small, project-level visualisations,
a key issue that became apparent from the interviews with coastal managers
is that many organisations often consider much larger coastal-scale issues
than the site specific management options that were used in this research.
However, some of the managers felt it would be difficult to create visualisations
of these because the generic management options outlined in strategic documents
such as Shoreline Management Plants (SMPs) are too vague to use a the basis
for detailed visualisations. Hence a pragmatic view was expressed that the
visualisations would be of greater use during the development and selection
of management interventions for individual sites where detailed management
information is available. Here, the visualisations were perceived as potentially
being a useful aid in clarifying management options and to overcome misunderstandings
about plans when presenting them to members of the public and stakeholders.
Nevertheless, the issue of the cost and resource implications of creating
and using the visualisations was raised by some of the coastal managers. Indeed,
the costs associated with software purchase, data and training mean that some
smaller coastal management organisations, such as local wildlife trusts may
be unable to afford to produce visualisations themselves.
Key Areas of Ongoing and Future Research
A number of areas for further investigation have been identified from the
research. In particular the interviews with coastal managers have led to a
number of suggestions for further development of the visualisations, including
the creation of images and interactive scenes for larger sections of coastline
for use in the development of strategic management policies. Interestingly,
such demands may mean that there is a need to move towards more advanced,
and thus more expensive, software and hardware products to provide the required
functionality. To address these needs, recent research has been investigating
the use of more advanced real-time virtual reality software such TerraVista
from Terrex Inc. that allows both user interactivity and high levels of detail
to be combined through the inclusion of detailed building and vegetation models
(Figure 5). In parallel with the use of more advanced software, steps are
being taken to strengthen the science underlying the methodology used to create
the visualisations by developing links with geomorphological and ecological
models. It is hoped that these linkages will enable the improved quantification
of the impacts associated with the management interventions being presented.
Further laboratory and field-based experiments are ongoing to test the use
of the visualisations in decision making. They involves testing the visualisations
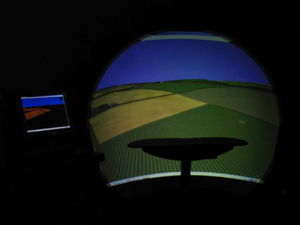
in the field using laptop computers. To accompany this, a portable immersive
viewing system, an Elumens VisionStation (Figure 6), is being evaluated as
a means of presenting the visualisations at meetings with local stakeholder
groups. Finally, a new virtual reality theatre has recently been installed
at the University of East Anglia This system employs a 2m high and 5.5m diameter
wrap-round screen (Figure 6) with stereo projection facilities, coupled to
a high performance image generator system, to provide a feeling of immersion
within the virtual reality environments. This facility will be used for further
experimental research investigating the design issues identified in this study.
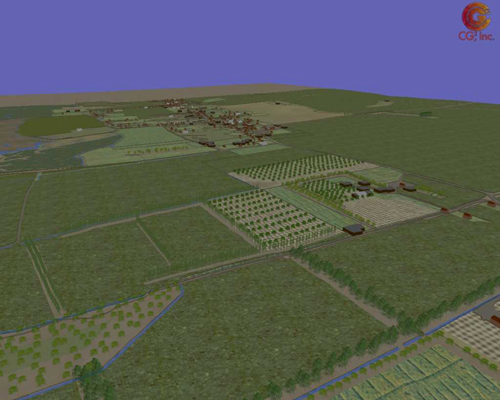
Figure 5. An interactive visualisation created for the Holme study site using TerraVista.
 |
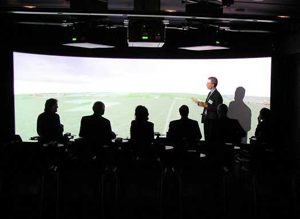 |
Figure 6. The visualisations may be displayed using the portable Elumens VisionStation (left), or a virtual reality theatre (right)
Conclusions
This research highlights the potential role of visualisation techniques as
a tool to assess and visualise future coastal landscapes. It also illustrates
how these technologies may be used in the future to facilitate participatory
coastal zone management via the presentation information in a recognisable
and understandable form to members of the general public. However, a number
of design and application issues require further work if the full expectations
of coastal managers and members of the public are to be met.
Acknowledgements
The research described was initially funded by a Natural Environment Research
Council and Economic and Social Research Council Interdisciplinary PhD Studentship,
whilst ongoing work is funded by the Tyndall Centre for Climate Change Research.
A large number of organisations contributed to the research by providing data
and their time, and in particular we would like to thank the Ordnance Survey
for the provision of a special data licence. We would also like to thank all
of the individuals who participated in the survey experiments and interviews.
References
- Bartlett, D.J. and Wright, D.J. (1999) Epilogue. p.309-315. In Wright, D.J. and Bartlett, D.J. (eds.) Marine and Coastal Geographical Information Systems. Taylor and Francis.
- Batty, M., Dodge, M., Doyle, S. and Smith, A. (1998) Modelling Virtual Environments. p.139-161. In Longley, P.A., Brooks, S.M., McDonnell, R. and Macmillan, B. (eds.) Geocomputation: A Primer. Wiley.
- Bishop, I.D. (1994) The role of visual realism in communicating and understanding spatial change and process. p.60-64 in Hearnshaw, H. and Unwin, D. (eds.) Visualisation in Geographic Information Systems. Wiley.
- English Nature and Environment Agency (2003) North Norfolk Coast Coastal Habitat Management Plan. Final Report.
- Jude, S.R., Jones, A.P. Jones and Andrews, J.E. (2001) Visualisation for Coastal Zone Management: A Case Study of the Norfolk Coast, England. Manuscripts from CoastGIS2001, Nova-Scotia, Canada.
- Lange, E. (1994) Integration of computerized visual simulation and visual assessment in environmental planning. Landscape and Urban Planning. 30. 99-112.
- Raper, J. (2000) Multidimensional Geographic Information Science Taylor and Francis.
- Sheppard, S.R.J. (2001) Guidance for crystal
ball gazers: developing a code of ethics for landscape visualization. Landscape
and Urban Planning. 54. 183-199.