
| RUS | UKR | ENG | ДонНТУ> Портал магистров ДонНТУ |
|
|
| Главная |
Материалы:
Реферат | Библиотека |Каталог библиотеки | Ссылки | Отчет о поиске
Email: kseniya.mos@gmail.com |
| Биография |
| Резюме |
| Публикации |
| Членство в AIESEC |
| Контакты |
At whatever chosen level of detail, a range of individual risks needs to be identified and quantified by the relevant line managers with facilitation by independent risk experts. Each of these risks represents a range of possible outcomes. For instance a broadly defined risk of "computer system failure" would include the possibilities of mainframe computer centre failure caused by both fire and hardware malfunction, and also the risk of LAN failure, or even of a local PC crashing.
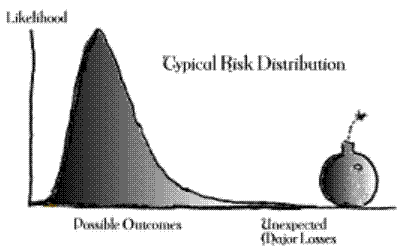
Each of these possibilities has a different impact on the organisation - hence for each risk a theoretical "risk distribution" showing the various impacts and their likelihoods can be envisaged.
This is the same tool used for market and credit risks. In market risks the distribution shape is approximately normal. In credit risk it is sharply skewed to the right or extreme loss end. For operational risk a range of risk distributions are observed for the different types of operational risk. Some competitive business risks have potential upside or "profit possibilities" and a roughly normal shape, most event risks on the other hand have little upside potential and show a form of exponential distribution.
The individual risk distributions can be seen as either the simple range of future outcome possibilities (as per market risk) or as a combination of two underlying distributions: one reflecting the likelihood of a loss event, and the other the severity of loss when one does occurs (this is the approach normally used in credit risk with likelihood of default, and "loss given default" considered separately). The appropriate underlying approach would seem to vary according to the type of operational or business risk being considered. A narrowly defined event risk such as a mainframe computer failure might be considered to be best modelled by a "credit risk" style approach, while a business risk or broadly defined event risk would seem to be best modelled by a "market risk" approach, given there is always some outcome. In practice the credit risk style approach is the more generic with the market risk approach being the special case when the likelihood of a "loss outcome" being one.
In order to gain an operational risk quantification that can be combined with credit and market risk measures, a consistent timeframe is needed for assessing impact without assuming effective remedial management action is possible. Generally a one year period is used - intuitively plausible for most operational and business risks and generally the timeframe used for credit risk.
Similarly there needs to be a consistent specification across the different risk domains of the confidence level to apply to the risk distributions. What percentage of the range of possible outcomes do we expect the risk measure to capture (and the capital holdings to act as buffer for). In this area operational risk also takes its lead from emerging credit risk practices.
Here the confidence interval is typically that associated with the risk of default for financial institutions with the organisation's current or target credit rating. For instance an AA rated bank would logically use a 99.95% confidence interval given that AA banks historically have a 5 basis point (or 0.05%) chance of not being in business in a year's time.
On this basis the risk's impact we need to measure is the one that is greater than or equal to this target percentage of all the possible outcome impacts. In terms of the above diagram it is the point on the horizintal access which places 99.95% (or whatever the organisation's target confidence level is) of the area under the risk distribution curve to its left.
Note that this approach is generic, and applies no matter how narrowly or broadly a risk is defined. It applies equally to a high level broad approach of defining a risk as the risk of loss to a business unit of any kind (other than credit or market risk), or the risk of loss of only certain types as per the Basel January 2001 operational risk proposals.
So these risk distributions are the target. How do we estimate the risk distribution curve?
Here theory meets solid practical experience.
The direct estimation method integrates the definition of the risk and the agreed timeframe and confidence level with the judgments of independent risk assessors and relevant line managers.
The business line managers explore with the independent risk assessors some known or hypothetical extreme loss scenarios in order to quantify their full economic impact and their likelihood of occurrence. Their combined experience is also used to choose or confirm an appropriate shape for the risk distribution. This allows the risk's quantification to be extrapolated beyond the individual scenarios considered to the other confidence levels. In my experience it is possible to associate default risk distribution shapes (say out of half a dozen alternatives) to the different types of risk at the outset.
For instance, a line manager may only be comfortable estimating moderate extreme loss incidents, say that might happen once in every ten years. This estimate can be combined with a default risk distribution shape to calculate the impact at any other confidence level. It also allows calculation of an expected economic loss (the mean of the distribution) or most frequent outcome (the mode).
This estimation method is clearly both an interactive and iterative process. The expertise of the business managers and the independent facilitation and procedural consistency of the risk experts are both essential. The first estiamted risk distribution may not stand close consideration, leading to a revised scenario quantification or a different underlying distribution shape being chosen.
Underlying loss data is critical to support this confirmation processs, but not often available, at least at first. Moreover economic loss is much broader than accounting loss; and "extreme loss" incidents may have occurred in other similar organisations. The use of documented external risk incidents is important both to evoke risk consciousness but also to validate the "extreme loss" impacts estimated. For example, the Hammersmith and Fulham 1991 swaps disaster, with cautious banks still losing up to GBP75m, is a timely reminder to those in new business areas confident that they have eliminated all legal risks.
The independent risk experts are essential for consistency and integrity. They also add value to the process by sharing risk and risk management knowledge gained both externally and elsewhere in the organisation. This is not just a measurement exercise, but an investment in risk management culture.
|
ДонНТУ>
Портал магистров ДонНТУ>
Реферат | Библиотека | Ссылки | Отчет о поиске
Email: kseniya.mos@gmail.com |