| RUS | UKR | ENG | ÄîíÍÒÓ> Ïîðòàë ìàãèñòðîâ ÄîíÍÒÓ |

|
| Ãëàâíàÿ |
Ìàòåðèàëû:
Ðåôåðàò | Áèáëèîòåêà |Êàòàëîã áèáëèîòåêè | Ññûëêè | Îò÷åò î ïîèñêå
Email: kseniya.mos@gmail.com |
| Áèîãðàôèÿ |
| Ðåçþìå |
| Ïóáëèêàöèè |
| ×ëåíñòâî â AIESEC |
| Êîíòàêòû |
1. Introduction
Software development is often plagued with unanticipated problems which cause projects to miss deadlines, exceed budgets, or deliver less than satisfactory products. While these problems cannot be eliminated totally, some of them can be controlled better by taking appropriate preventive action. Risk management is an area of project management that deals with these threats before they occur. Organizations may be able to avoid a large number of problems if they use systematic risk management procedures and techniques early in projects.
Several risk management approaches have been introduced during the past decade [1-5] and while some organizations, especially in the U.S. defense sector [1,6], have defined their own risk management approaches, most organizations do not manage their risks explicitly and systematically [7]. Risk management based on intuition and individual initiative alone is seldom effective and rarely consistent.
When risk management methods are used, they are often simplistic and users have little confidence in the results of their risk analysis results. We believe that the following factors contribute to the low usage of risk management methods in practice:
Given the increasing interest in risk management in the industry, we believe that for risk management methods to be applied more widely, they will need to address the above issues. Furthermore, risk management methods should also provide comprehensive support for risk management in projects, they should provide practical guidelines for application, they should support communications between participants, and they should be credible.
The Riskit method was developed to address the issues listed previously. Its main characteristics can be described by the following principles.
(1) The Riskit method provides precise and unambiguous definitions for risks.
The common definition of risks, either by dictionaries or every day usage, associate several different meanings to risk. It can refer to a possibility of loss [8], the actual loss that would result if the risk occurs [8], a factor or element that is associated with a threat [8], or a person that contributes to the possibility of loss [9]. The dictionary definitions for risk are so broad that it is fair to define risk as anything that is related to the possibility of loss. Clearly, there is some value in having such a broad and encompassing concept to facilitate initial discussion about risk. However, we believe that this wide range of meanings associated to the word "risk" can also prevent adequate precision in more detailed analysis or risks unless this ambiguity is explicitly addressed and removed.
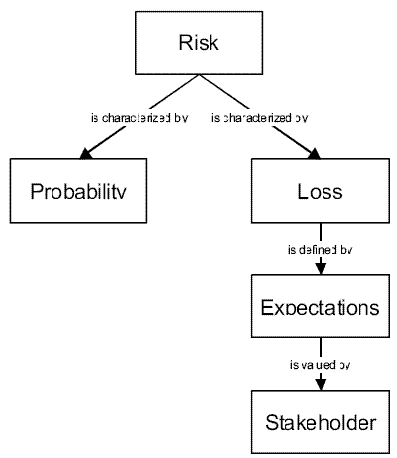
The Riskit method contains means to define risks more precisely and formally. When we use the term risk on its own, we are using it in its general meaning: risk is defined as a possibility of loss, the loss itself, or any characteristic, object or action that is associated with that possibility. As in most risk management approaches, we consider probability and loss the two main attributes of risk. However, our approach explicitly recognizes that the definition of loss depends on expectations, which in turn depend on stakeholders of the project. A loss is defined as an outcome that falls short of what was expected. As different stakeholders value outcomes differently, stakeholders influence the definition of loss in a project. This view is visualized in Figure 1.

Figure 1: Definition of risk in the Riskit method
(2) The Riskit method results in explicit definition of objectives, constraints and other drivers that influence the project.
As we pointed out in Figure 1, risk is a relative concept; its definition depends on expectations that are associated with a situation. In order to analyze risks, it is necessary to formalize the expectations as well as possible. When expectations are recognized and defined, we refer to them as goals. While some goals cannot be stated precisely, at least they should be identified and documented as well as the information available allows. The Riskit method contains an explicit step and supporting templates to assist in the goal definition.
(3) The Riskit method is aimed at modeling and documenting risks qualitatively.
The Riskit method provides conceptual and graphical tools to model different aspects of risks qualitatively, instead of requiring quantitative estimation of risk probability and impact to take place early in the project. Given the difficulty of these estimations - and the often ambiguous interpretations of risks - the margins of error in risk quantification are easily high. By emphasizing the qualitative understanding of risks, there is a better basis for understanding and communicating about risk.
(4) The Riskit method can use both ratio and ordinal scale risk ranking information to prioritize risks reliably.
The estimation problem has been reduced in the Riskit approach. Instead of forcing the quantification of risks using ratio scale metrics - often an unrealistic goal - the Riskit method only attempts to accomplish the necessary quantification of risks for risk management to take place. For risk management purposes it may be enough to identify the biggest risks and propose action to control them, while the exact values of probability and loss may not be needed. The selection of the type of metrics to be used in risk analysis should be based on the objectives of the analysis and the availability of data about risks.
(5) The Riskit method uses the concept of utility loss to rank the loss associated with risk.
Many current risk management approaches are based ranking of risks based on the loss they cause to some specific attributes of the project, such as cost, time delay, or quality metrics. Often a single metric is used. This can be detrimental for two reasons. First, the use of a single metric, or a small number of metrics, can create strong bias away from secondary, yet influential goals that should be considered. Second, research in economics and management science has strongly indicated that decision are made based on the changes in the expected utility (or utility loss) of alternatives. As the utility functions of stakeholders are likely to be non-linear, use of direct loss metrics can lead to wrong estimates and rankings of the risks. Therefore, the Riskit method uses the concept of utility loss to compare and rank losses of risks.
(6) Different stakeholder perspectives are explicitly modeled in the Riskit method.
All projects have more than one stakeholder that is interested in its results. They may have different priorities and levels of expectations. Risk management should be based on the recognition of these stakeholder expectations and priorities. Traditional, direct project metric based approaches cannot easily support the comparison of different stakeholder views and few risk management approaches attempt to address the issue. The Riskit method supports stakeholder views by documenting their expectations explicitly and evaluating the utility loss for each separately.
(7) The Riskit method has an operational definition and training support.
The Riskit method has an operational definition so that it can be applied easily and consistently. This, in fact, is the main contribution of this paper, this paper presents an operational definition of the Riskit process. There is also a Riskit tutorial available and an application guideline paper is being written.
We suggest that by adhering to the principles described above the Riskit method is a comprehensive, operational, theoretically sound and practical method for software risk management.
1. Decomposing Risk: The Riskit Analysis Graph
The Riskit analysis graph is a graphical formalism that is used to define the different aspects of risk more formally. The Riskit analysis graph can be seen both as a conceptual template for defining risks, as well as a well-defined graphical modeling formalism. In both cases, it can be used as a communication tool during risk management. The Riskit analysis graph has been developed based on the ideas presented by Rowe [10,11], but we have evolved Rowe’s notion of risk estimation steps into a well-defined, extended graphical formalism. In the following we will introduce the Riskit analysis graph first by a conceptual definition of its underlying elements, then by an operational definition of the graphical formalism that is used in practice to represent the underlying, conceptual model.
The underlying conceptual model - or meta-model - of the Riskit Analysis Graph components is presented in Figure 2, using the UML notation [12]. This meta-model represents the underlying, conceptual elements and their relationships. Each rectangle in the graph represents a risk element and each arrow describes the possible relationship between risk elements. The relationship arrow is read in the direction of the arrow. For example, the relationship between "risk factor" and "risk event" in Figure 2 should be read as "[a] risk factor influences [the] probability of [a] risk event".

Figure 2: A conceptual view of the elements in the Riskit analysis graph
A risk factor is a characteristic that affects the probability of a negative event (i.e., risk event)
occurring. A risk factor describes the characteristics of an environment. Consequently, in the Riskit
analysis graph a risk factor does not have probability associated with it, it describes a relevant
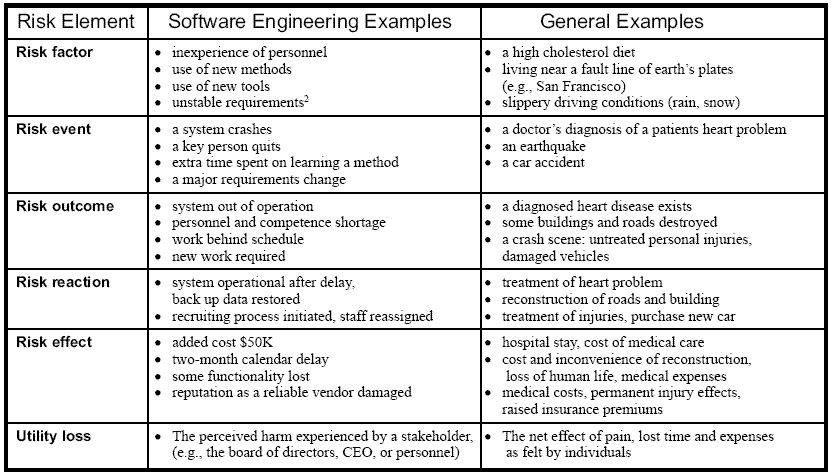
environment characteristic as it is or will be1 . Examples of risk factors are listed in Table 1. Risk factors
that are documented typically increase the probability of risks events occurring, but they may also
reduce them, i.e., they are success factors for a project (e.g., "the development team recently developed
a similar application").
 Table 1: Examples of risk elements
The purpose of risk factors is not to document all possible characteristics that may influence a risk event as there may be an infinite number of such factors. Instead, a risk factor should document main assumptions of project environment and, especially, characteristics that are different from the assumed, “normal” situation. This interpretation of risk factors enables explicit documentation of main assumptions and deviations from these assumptions.
A risk event represents an occurrence of a negative incident – or a discovery of information that reveals negative circumstances. Risk event is a stochastic phenomenon, i.e., it is not known for certain whether it will happen or not. This uncertainty can be characterized by a probability estimate associated to the risk event. Examples of risk events are listed in Table 1. Each risk event can be influenced by many risk factors but a risk event does not have to have a risk factor associated with it. A risk event can also influence the probabilities of other events or even influence risk factors.
The next element in Figure 2 is called risk outcome. It represents the situation in a project after the risk event has occurred but before any corrective action is taken to reduce the effects of a risk event. Examples of outcomes are listed in Table 1. The purpose of the concept of risk outcome is to document the immediate results and situation after the risk occurs. Based on the risk outcome description, different reactions can sometimes be considered more objectively and creatively than directly from a risk event.
When a risk event occurs, the resulting risk outcome is rarely accepted as such. Instead, organizations react to the situation to reduce the negative impact of the risk event. These corrective reactions are an important part of understanding what is the overall impact of the risk event to the project domain. Thus, each risk outcome is associated with one or more risk reactions: a risk reaction describes a possible action that can be taken as a response to risk event and resulting risk outcome. If only one risk reaction is described, it is deterministic: it will be taken if the event occurs. If more than one reaction is described, they represent alternative lines of actions. Risk reactions can influence the probabilities of risk events. If the influence is stochastic, they have a similar relationship as a risk factor has to a risk event: they change the probability of an event. Examples of risk reactions are also listed in Table 1.
The risk effect set represents the final impact of a risk event to the project. In other words, it documents what characteristics of the project were effected, taking into account the impact of reactions. Effects are described through the explicitly stated goals for the project. Examples of different effects on goals are listed in Table 1.
While the risk effect represents the impact the risk had on each project goal, the concept of utility loss captures how severe the overall impact of effects is. The concept of utility loss is based on the utility theory, a concept widely used in economics and decision theory [13,14]. The use of utility theory allows the simultaneous consideration of multiple criteria and consideration of several stakeholders. Furthermore, it is likely to result in more realistic evaluation of the losses as the utility functions of stakeholders are generally believed to be non-linear [15,16] and there may be points of discontinuity in them. We have sometimes used the term "pain" as a synonym for utility loss as the concept of utility may appear too theoretical for practitioners.
The multiplicity (i.e., cardinality) information about risk element associations is included in Figure 2, using the UML class diagram notation and syntax . A symbol in the beginning of an arrow indicates how many outgoing associations are allowed or required. Correspondingly, a symbol at the end of the association arrow indicates how many associations can be linked to an element.
3. The Riskit Process
Riskit is a comprehensive risk management method that is based on sound theoretical principles and thus it avoids many of the limitations and problems that are common to many other risk management approaches. As the Riskit method has been extensively presented in other publications [17,18,18,18,19,19,19,19,20,20,20,20,21,21,21,21], we present here only the highlights and main principles of the method.
The Riskit method has a comprehensive process definition that supports risk management activities throughout the project. The Riskit process is similar to many other risk management process descriptions and the Riskit process definition is not a novel aspect of the method. However, as a whole the Riskit process definition has the following characteristics not always found in risk management approaches:
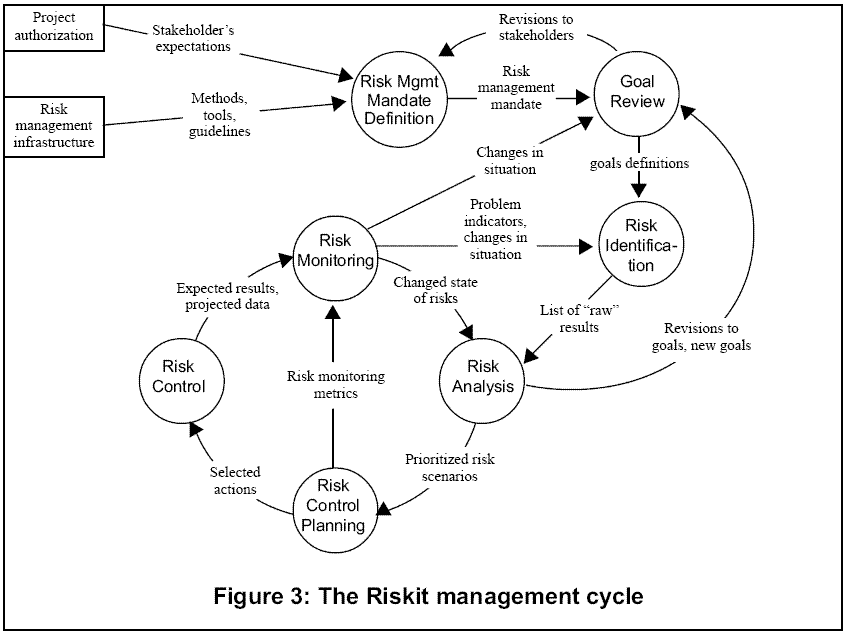
The Riskit process overview is presented in Figure 3 as a dataflow diagram. The main processes are also described in Table 2. More detailed process description is available in a separate report [20].
4. Conclusions
We have conducted several case studies for evaluating the Riskit method [17,19,21]. In particular, Daimler-Benz and Nokia Telecommunications are actively using and developing the method further.
We welcome all feedback and comments on the method and we recommend that method users
contact Riskit method developers so that practical feedback from method use can be used to improve the
method itself.

REFERENCES
[1] B.W. Boehm. Tutorial: Software Risk Management, IEEE Computer Society Press, 1989.
[2] E.M. Hall. Managing Risk: Methods for Software Systems Development, Addison-Wesley Pub Co., 1998.
[3] R.N. Charette. Software Engineering Risk Analysis and Management, New York: McGraw-Hill, 1989.
[4] M.J. Carr, S.L. Konda, I.A. Monarch, F.C. Ulrich, and C.F. Walker. Taxonomy-Based Risk Identification, SEI
Technical Report SEI-93-TR-006, Pittsburgh, PA: Software Engineering Institute, 1993.
[5] D.W. Karolak. Software Engineering Risk Management, Washington, DC: IEEE, 1996.
[6] J.D. Edgar. Controlling Murphy: How to Budget for Program Risk (originally presented in Concepts, summer
1982, pages 60-73). In: Tutorial: Software Risk Management, ed. B.W. Boehm. Washington, D.C.: IEEE
Computer Society Press, 1989. pp. 282-291.
[7] J. Ropponen, Risk Management in Information System Development TR-3, 1993. Computer Science Reports.
University of JyvAskylA, Department of Computer Science and Information Systems. Jyvaskyla.
[8] The American Heritage Dictionary of the English Language, U.S.A.: Microsoft Bookshelf/Houghton Mifflin
Company, 1992.
[9] Merriam-Webster's Collegiate Dictionary, Springfield, MA: Merriam-Webster, 1995.
[10] W.D. Rowe. An Anatomy of Risk, New York: John Wiley & Sons, 1977.
[11] J. Kontio, Software Engineering Risk Management: A Technology Review Report PI_4.1, 1994. A proprietary
Nokia Research Center project deliverable. Nokia Research Center. Helsinki, Finland.
[12] Rational, UML Notation Guide, version 1.1 1997. Rational Inc.
[13] J. Von Neumann and O. Morgenstern. Theory of Games and Economic Behavior, Princeton: Princeton University
Press, 1944.
[14] S. French. Readings in Decision Analysis, London: Chapman and Hall, 1989.
[15] M. Friedman and L.J. Savage, The Utility Analysis of Choices Involving Risk Journal of Political Economy,
vol. 56, pp. 279-304, 1948.
[16] B.W. Boehm. Software Engineering Economics, Englewood Cliffs, N.J.: Prentice Hall, 1981.
[17] H. Englund, A Case Study to Explore Risk Management Methods 1997. Kunglika Tekniska Hogskolan,
Stockholm, Sweden. Masters thesis.
[18] J. Kontio and V.R. Basili, Risk Knowledge Capture in the Riskit Method 1996. Proceedings of the 21st
Software Engineering Workshop. NASA. Greenbelt, Maryland. file name: SEW-21FN.DOC.
[19] J. Kontio, H. Englund, and V.R. Basili, Experiences from an Exploratory Case Study with a Software Risk
Management Method CS-TR-3705, 1996. Computer Science Technical Reports. University of Maryland.
College Park, Maryland.
[20] J. Kontio, The Riskit Method for Software Risk Management, version 1.00 CS-TR-3782 / UMIACS-TR-97-
38, 1997. Computer Science Technical Reports. University of Maryland. College Park, MD.
[21] J. Kontio and V.R. Basili, Empirical Evaluation of a Risk Management Method 1997. Proceedings of the SEI
Conference on Risk Management. Software Engineering Institute. Pittsburgh, PA.
|
ÄîíÍÒÓ>
Ïîðòàë ìàãèñòðîâ ÄîíÍÒÓ>
Ðåôåðàò | Áèáëèîòåêà | Ññûëêè | Îò÷åò î ïîèñêå
Email: kseniya.mos@gmail.com |