Fundamentals of Traffic Modeling
Internet traffic data are ferocious. Their statistical properties are complex and databases are very large. The protocols are complex and introduce feedback into the traffic system. Added to this is the vastness of the Internet network topology. This challenges analysis and modeling. Most Internet traffic data can be thought of as time data: a point process, a marked point process, or a time series. The start times of TCP connection flows for HTTP on an Internet wire are a point process. If we add to each of these start times the file size downloaded from the server to the client, the result is a marked point process. Byte counts of aggregate traffic summed over equally spaced intervals are a time series.
The aggregate HTTP start times on an Internet Wire are a superposition of traffic sources. This is true in general for traffic variables on live Internet wires. For example, aggregate packet processes and aggregate byte counts are a superposition of traffic sources. It is vital to exploit superposition to uncover the characteristics of Internet traffic. In so doing, we exploit the fundamental structure of the traffic. We can operate mathematically, using the theory of superposition of point processes, marked point processes, and time series. We can operate empirically, studying the data and how it changes as the number of sources changes.
The notion of how we define a source for analysis purposes needs more thought and trial with data. We can take sources to be users. However, a network is often a network of sub-networks. So we could take each source in such a case to be the traffic of one sub-network.
But there is another method of approaching superposition that avoids explicit identification of sources. It is rate superposition. Traffic rates are used as a measure of the number of traffic sources. We will illustrate with measurements of HTTP start times on a wire for, say, 1 week. Suppose we divide them up into blocks of length five minutes each. A low base rate, r, is selected, close to the minimum observed rate. Let k be a positive integer. The start times for a block with rate kr were taken to be the superposition of k independent start-time point processes, each with the statistical properties of a process with rate r. Theoretical results are derived based on the superposition theory of point processes. The theoretical results were compared with the empirical results from the analysis of the blocks of start times.
Visualization
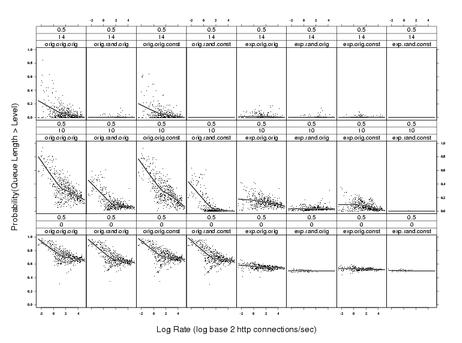
Visualization tools are vital for analyzing a very large traffic database. Analytic visualization tools support model development. One issue is screen real estate. Because Internet databases are large and the structure is complex, we must accept the notion that single displays need to cover tens and perhaps hundreds of pages with many panels on each page. Data visualization is often limited to a display of a set of data that can be placed all at once in our visual field. So it can be shocking at first to contemplate looking at so many pages. But using the structure of trellis display a visualization system available in S/S-PLUS, it is easy to generate many pages. And using a document viewer, it is possible to learn a great deal about Internet traffic data from these multipage, multipanel, or MPMP, displays. Following are some of the visualization tools used in our Internet traffic analysis and published papers.
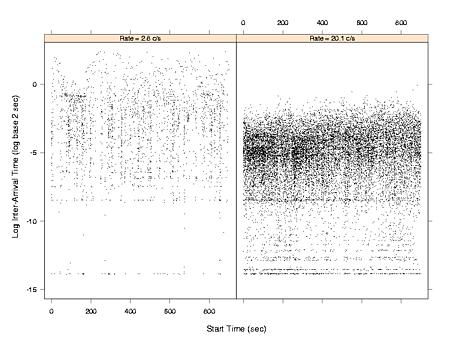
Inter-Arrival Time Plot
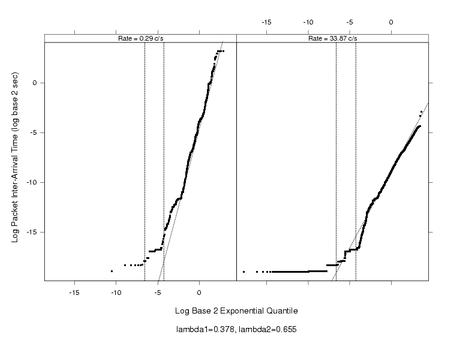
Weibull Quantilot
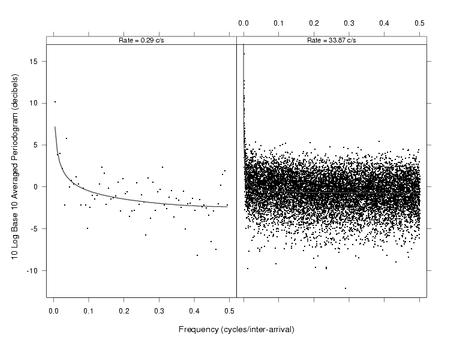
Averaged Periodogram Plot