Comparative Study of Diagnosis Methods for Induction Motors
R. Casimir, E. Boutleux, G. Clerc and F. Chappuis
Abstract — This paper is a comparative synthesis of the different diagnosis methods that are used to detect and localize failures in induction motors. The main methods are based on electrical knowledge model or on signal analysis. The origin and the causes of faults are presented, with their distribution on induction machine components. Signal spectral analyses, which are obtained through different methods, are compared. In faulty cases, parameter variation is also discussed. Finally, the application areas of these methods are synthesized in relation to the different failures.
Induction Motor Failures
Studies of failures distribution on medium power induction machine have given the following results [1]: more than 50% of faults affect the bearings. About 16% of faults are localized on the stator winding. For the rotor and the shaft or the coupling, the distribution is respectively about 5% and 2.5%.
Insufficient lubrication, heavy radial or axial stresses, incorrect positioning during assembly or misalignment can cause bearing fault. Then physical damage would be produced in the rolling-element. Misalignment of bearings can occur in four different ways: shaft misalignment, shaft deflection, tilted outer race and tilted inner race [2].
Bent rotor shafts, operation at critical speeds, incorrect mounting or bearing ageing are causes of rotor eccentricity. There are two kinds of eccentricity: static eccentricity (where the rotor is not in the stator bore center but is still turning upon its own axis) and dynamic eccentricity (when the rotor is in the stator bore center but is not turning upon its own axis).
Stator winding faults may be due to turn-to-turn, turnto-ground or phase-phase short-circuits. Studies published in [1] and [2] show that overheating, insulation breakdown and other electrical faults and malfunction are the main winding fault initiators.The failures that can appear in the rotor side are bars and end-ring breakage as a result of pulsating load or direct starting on the mains.
These main faults generally lead to torque pulsation, speed fluctuation, noise and vibration increase, changes in the supply current frequency components, overheating and electrical parameter variations. Thus induction motor faults monitoring is usually based on the tracking of these indicators. This aim can be obtained by two different approaches. Investigations based on observation algorithms (model-based diagnosis) and investigations based on measured signal analysis.
Model-based diagnosis
The method is based on the estimation of nonmeasurable signals or on the tracking of parameters during
operation. Then these quantities are analyzed in order to obtain faults signatures. This diagnosis procedure, based
on a priori knowledge, is build up thanks to the modeling of asynchronous machine in a three phases reference frame
or in a two-phase equivalent one. Some relevant parameters of these models are used in order to build a signature of the faults. Two types of parameters can be identified:
- Mechanical parameters;
- Electrical parameters.
The tracking of electrical parameters provide both rotor faults and stator short circuits detection [3], [4].
Table I presents the variation of the induction motor model parameters according to the faults. In faulty case, there is a modification of all parameters. But if an inter-turn short circuit occurs in phase a, for instance, Rsa and Lfsa will decrease while (Rsb, Lfsb) and (Rsc, Lfsc) will increase. This is relevant information for fault localization.
TABLE I - VARIATION OF PARAMETERS ACCORDING TO THE FAULTS
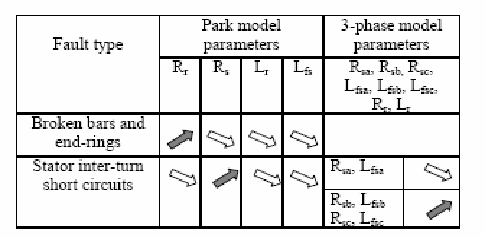
Parameters can be identified off-line with an iterative procedure applied on the input/output signals [5]. They also can be estimated on-line by extended observers such as Kalman filter [6] or high gain observers [7]. Figures 1 and 2 present the evolution of rotor resistances for a sound rotor and for a rotor with four broken bars [7]. In normal operating conditions the parameters involve a nominal value, whereas in faulty case they move towards three different values. Thus the apparent rotor resistance increases with rotor faults as it was shown in table I.
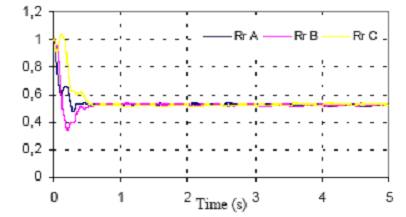
Fig.1. Evolution of rotor resistances (sound rotor)
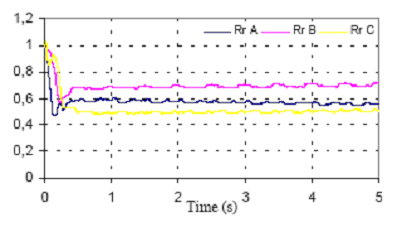
Fig.2. Evolution of rotor resistances (4 broken rotor bars)
However, some machine failures are not reachable with these methods. Thus, the previous methods must be completed by signal analysis.
Signal analysis-based diagnosis
Currents, vibrations, axial field, electromagnetic torque provide very rich information for diagnosis. These signals are usually analyzed in the frequency domain, by spectral analysis in steady state. They can also be analyzed in timefrequency domain by Wigner-Ville transform [8], in transient operation, or by Spectrogram (that is a representation of frequency components versus the time) in adjustable speed drive. However, in this section only the spectral components of signals are presented in function of the specified faults.
A. Stator currents monitoring
Stator currents are easily measured and their spectra give some information on numerous defects [9], [10]. The currents provide information on broken bars or rings, misalignment and static or dynamic eccentricities. Mechanical faults such as bearing failures are also detected on current spectrum.
The variation of the air-gap length, because of static or dynamic eccentricity, leads to variations in the air-gap flux density. As induced stator currents are affected, many of their frequency components can help to identify both static and dynamic eccentricity. These frequencies are given by (1) [11]

where Fs - supply frequency;
Nr - number of rotor bars;
p - number of pole-pairs;
s - per unit slip and;
nw = 1,3,5 …
For static eccentricity, nd = 0. If static eccentricity increases then the magnitude of the lines at corresponding frequencies should also increase. In the case of dynamic eccentricity, nd = 1, and new components should appear in the current spectrum. Misalignment involves the increasing of components at frequencies specified by (2)

Fr is the rotor speed frequency.
Since ball bearings support the rotor, bearing defect will produce radial motion between the rotor and the stator. Then anomalies produced on the air-gap flux density will affect the stator currents. That is why bearing vibration can be found on the stator current spectra. The characteristic frequencies are based upon bearing dimensions shown in
fig 2. They are given by [12]

fi and fo (equation 4) are respectively the inner and outer raceway frequencies. They are produced when each ball passes over a defect. So this phenomenon occurs nb-times during a complete raceway rotation, where nb is the number of balls given by the manufacturer.


Fig.3. Ball bearing dimensions
The expression of characteristic race frequencies can be approximated for most bearing with small number of balls by:

When a bar or a portion of ring is broken, corresponding flux harmonics are produced and they induce harmonics in the stator currents. The stator current is modulated in amplitude by the slip frequency. This modulation increased in the case of rotor faults. The characteristic frequencies (due to the fault) provided by current spectrum analysis are [13]:

As an illustration of the predictable signatures figures 4 and 5 show the stator current spectrum for a 5.5 kW, 50 Hz, 2 pole pair and 1470-rpm induction motor with sound rotor and with four broken bars respectively. The machine was operating at full load. The synchronous detection of the rotation frequency (Fr) allows the calculation of s, the characteristic frequencies values and the associated amplitudes. Figure 6 shows the comparison of sidebands for the sound rotor and the damaged rotor.
The modulation of stator current at twice slip frequency can also be found on the spectrum by analyzing the slot frequencies:
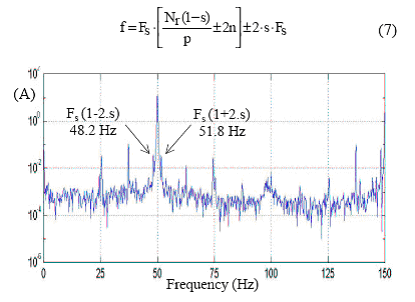
Fig.4. FFT zoom current spectrum– sound rotor
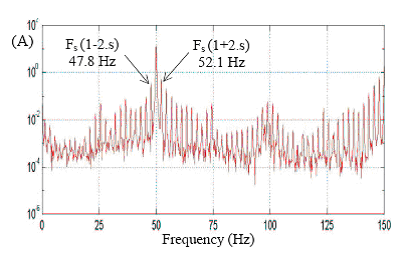
Fig.5. FFT zoom current spectrum – 4 broken bars
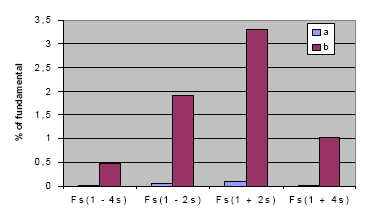
Fig.6. Harmonics amplitudes in % of the fundamental; sound rotor (a), 4 broken bars (b)
B. Vibration monitoring
Vibration monitoring is made possible by sticking accelerometers on the bearings, in the three directions: vertical, radial and axial (figure 7).
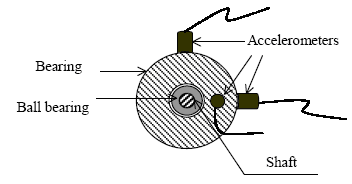
Fig.7. Vibratory measurement on induction motor
Vibration signal spectra allow identifying bearing defects, the squirrel cage faults, static and dynamic eccentricities, bent shaft and misalignment [14]. A full synthesis (table II) on common motor faults and their consequences on vibration spectrum have been presented in [15]. In the paper, authors compare these signatures with those obtained on stator current spectrum. Figures 8 and 9 show a vibration spectrum in axial direction for the induction motor with both sound and damaged rotor. The predicted sidebands (equation 8) have been found for the damaged rotor. Since the machine operated at 1472.4 rpm with the sound rotor and, at 1467.6 rpm with the other, the per unit slip s was equal to 1.84% and 2.14% respectively. It appears that these components increase in the case of fault.
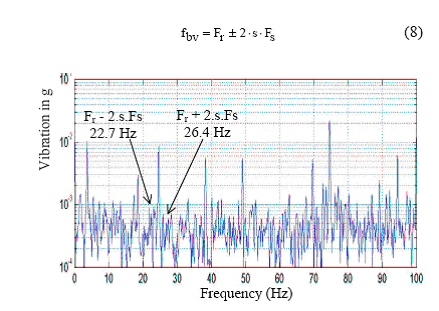
Fig.8. FFT zoom vibration spectrum in axial direction – sound rotor

Fig.9. FFT zoom vibration spectrum in axial direction – 4 broken bars
C. Axial flux monitoring
Axial flux is always present in electrical machines, because of their inherent asymmetries. Axial flux is the result of the stator and rotor current effects on the machine extremities (end-rings, coil heads). It can be visualized by putting a coil outside the motor and in the shaft direction (this allows the measurement of the emf induced by the flux variation). Studies in [16] have been focused on the variation of axial flux frequency components in order to detect stator short circuits. After a theoretical study it appears that when a stator winding of an induction machine has any shorted turns, the flux harmonics of the following frequencies increase in amplitudes.

where k = 1, 3, 5… and n is an integer different from the number of pole pairs.
In [17] authors have identified rotor asymmetries, shaft misalignment, bearing failures and inter-turn short circuits by means of axial flux analysis. Inter-turn short-circuits involves increasing amplitudes at the predictable
frequencies (equation 9). By analyzing axial flux spectrum, the following results have been found:
1) Broken bars: more components at twice slip frequency (2*n*s*Fs) appear and increase around the supply harmonic components.
2) Shaft misalignment: some low alterations on all components of the flux spectrum have been observed.
3) Bearing damage: several components appear between 600 and 900 Hz (note that the supply frequency is equal to 50 Hz). This could be the slot frequencies depicted in equation 7.
TABLE II CHARACTERISTIC VIBRATION FREQUENCIES ACCORDING TO THE FAILURES

D. Electromagnetic torque monitoring
Electromagnetic torque represents the energy transfer between the stator and the rotor. The influence upon airgap flux and the stator currents, due to rupture within the cage, result in the focus of interest on the electromagnetic torque.
The electromagnetic torque can be measured with two of the three line currents and by adding open coils, under each stator phases (so the electromotive forces induced in these coils are obtained). Electromagnetic torque monitoring provides information on rotor faults [18]. In a d,q reference frame fixed with respect to the stator the electromagnetic torque has a general expression:

If three-phase flux and currents are considered without neutral connected, the torque can be written as:

By analyzing electromagnetic torque spectrum, authors in [18] have found many harmonics that varies for a 50Hz 7,5 kW motor operating at no load and in steady state. Table III summarizes the results.
The 700 Hz may be a function of the number of rotor slots. Thus electromagnetic torque should be used to monitor other faults such as eccentricities and broken bars.
TABLE III - ELECTROMAGNETIC TORQUE HARMONICS VARIATION – BROKEN RING

Electrical and mechanical measurement and signal analysis complete the results obtained with the diagnosis based on a priori knowledge. The comparison of the results is made in the following paragraph.
Comparative study
Bars and end-ring breakage, static and dynamic eccentricity, and stator winding’s short-circuits can be detected by model-based diagnostic procedures.
Added to the previous failures, bearing failures can also be diagnosed by signal analysis-based diagnosis procedures.
Conclusion
This paper has presented a comparative study of the main diagnosis methods for induction motors. Two kinds of diagnosis methods have been introduced: the first is based on the estimation of characteristic quantities of the induction motor models, the second deals with the electrical or mechanical signal analysis in the frequency domain. In order to illustrate the predictable signatures, stator current and vibration spectra have been presented. However, the signature list is not exhaustive.
The combination of these methods offers more accuracy and reliability; it will also make possible on-line and offline diagnosis for many faults, which are localized differently in the induction motor. We have presented some signatures, which are used by these methods and have compared the application areas.
References
- O. V. Thorsen, M. Dalva, “A survey of faults on induction motors in offshore oil industry, petrochemical industry, gas terminal, and oil rafineries”. IEEE Transactions on Industry Applications Vol. 31, No. 5, pp.1186-1196 September/October 1995
- O. V. Thorsen, M. Dalva, "Failure identification and analysis for high-voltage induction motor in the petrochemical industry” IEEE Transactions on Industry Applications Vol. 35, No. 4, pp.810-818 July/August 1999
- S. Bachir, S. Tnani, G. Champenois and J.C Trigeassou, "Induction motor modeling of broken bars and fault detection by parameter estimation" in Proc. SDEMPED 2001 pp 145 – 149
- S. Moreau, J. C. Trigeassou, G. Champenois, "Diagnosis of electrical machines: a procedure for electrical fault detection and localization" in Proc. SDEMPED 1999 pp 225 – 229
- E. Schaeffer, E. Le Carpentier, M. E. Za?m. Failure detection in induction machine by means of parametric identification. In Proc. CESA'98, IEEE Conference on Computational Engineering in Systems Applications, 1998
- M Sa?d, M. Benbouzid, A. Benchaib, "Detection of broken bars in induction motors using an extended Kalman filter for rotor resistance sensorless estimation" IEEE Transactions on Energy Conversion Vol 15, No. 1, pp.66-70 March 2000
- T. Boumegoura, G. Clerc, H. Yahoui, G. Grellet, "Rotor resistance estimation by non-linear observer for diagnosis and control systems" European journal of automation, Vol. 34, No. 8, October 2000.
- J. Jianguo, Z. Zhiping, S. Pengshang, W. Xiangheng, "Time frequency spectrum of line current during starting process – A tool for diagnosing failures in induction motor," in Proc. ICEM 1992 pp 1261 - 1265
- M. E. H. Benbouzid, M. Vieira, C. Theys, "Induction motor's faults detection and localization using stator current advanced signal processing techniques" IEEE Transactions on power electronics, Vol. 14, N° 1, january 1999 (pp 14 - 22)
- W. T. Thomson, M. Fenger, "Current signature analysis to detect induction motor faults". IEEE Industry Application Magazine. July/August 2001.
- W. T. Thomson, D. Rankin, D. G Dorell, "On-line current monitoring to diagnose airgap eccentricity in large threephase induction motors – Industrial case history verify the predictions" IEEE Transactions on Energy Conversion Vol 14, No. 4, pp.1372-1378 December 1999
- R. R. Schoen, T. G. Habetler, F. Kamran, R. G. Bartheld, "Motor bearing damage detection using stator current monitoring" IEEE Transaction on Industry Applications, Vol. 31, N° 6, pp 1274 – 1279 November/December 1995
- W. T. Thomson, M. Fenger, “Industrial application of current signature analysis to diagnose faults in 3-phase squirrel cage induction motors” Pulp and Paper Industry Technical Conference, 2000. Conference Record of 2000, pp 205 –211
- W. T. Thomson, “A review of on-line condition monitoring techniques for three-phase – squirrel cage induction motors – past present and future” in Proc SDEMPED 1999, pp 3 – 18
- H. Calis, P. J. Unsworth, "Fault diagnosis in induction motors by motor current signal analysis" in Proc. SDEMPED 1999 pp 237 – 241
- H. H?nao, M. Garcia-Melero, "M?thodes de d?tection de d?fauts dans les machines ? induction par utilisation de la mesure du flux axial" in Proc EF 1999, pp 106 - 111
- H. F. Cabanas, M. Garcia-Melero, "Experimental applications of axial leakage flux to the detection of rotor asymmetries, mechanical anomalies and interturn shortcircuits in working induction motors" Proc ICEM 1998, Vol 1, pp 420 - 425
- F. Thollon, G. Grellet, A. Jammal, “Asynchronous motor cage fault detection through electromagnetic torque measurement” Proc ETEP Vol 3, N° 5, September/October 1993