 ┬Õݾ‗³± Ô ßÞßÙÞ¯‗ÕÛ¾
Enabling Scientific Workflows in Virtual Reality
Oliver Kreylos, Gerald Bawden, Tony Bernardin, Magali I. Billen, Eric S. Cowgill, Ryan D. Gold
Bernd Hamann, Margarete Jadamec, Louise H.Kellogg, Oliver G. Staadt, Dawn Y. Sumner
http://www.informatik.uni-rostock.de/~ostaadt/download/Kreylos_et_al_VRCIA06.pdf
Abstract
To advance research and improve the scientific return on data collection and interpretation efforts in the geosciences, we have developed methods of interactive visualization, with a special focus on
immersive virtual reality (VR) environments. Earth sciences employa strongly visual approach to the measurement and analysis of
geologicdataduetothespatialand temporal scalesoverwhichsuch
data ranges. As observations and simulations increase in size and
complexity, the Earth sciences are challenged to manage and interpret increasing amounts of data. Reaping the full intellectual benefits of immersive VR requires us to tailor exploratory approaches
to scientificproblems. These applicationsbuild on the visualization
methodÆs strengths, using both 3D perception and interaction with
data and models, to take advantage of the skills and training of the
geological scientists exploring their data in the VR environment.
This interactive approach has enabled us to develop a suite of tools
that are adaptable to a range of problems in the geosciences and
beyond.
CR Categories: 1[Fundamentals inVirtual-Reality Continuum]:
Scientific visualization in virtual-reality continuum; 4 [Applications]:Virtual-Reality Continuumin Geology, GeographyandGIS
Keywords: Virtual reality, scientific visualization, workflow, geosciences
1 Introduction
The typical workflow of a geoscientist generates insight through
observation and measurement. To use an example from the work
of one of our group [Gold et al. 2006]: a geologist researching the
behavior of an activefault observes terrain in the field, measures
the position, orientation, offset, and other properties offault lines
and records them in a map, and then generates a model of the local tectonic structure based on those measurements (see Figure 1).
More generally, a geoscientist first detects features, then measures
them, and finally generates a model explaining the features. This
visual approach to science is powerful, as the human brain excels
at visually identifying patters. As EdwardTufte wrote two decades
ago: ôAt their best, graphics are instruments for reasoning about
quantitative information. Often the most effective way to describe,
explore, and summarize a set of numbers û even a very large set û
is to look at pictures of those numbersö [Tufte 1983]. Unlike many
engineering applications in which the exact shape of a structure is
known, geologic structures often have complex three-dimensional
shapes, that additionally may only be sampled at irregularly distributed locations. It is therefore desirable to apply the feature detection skills of a trained geoscientist to problems that are not accessible for ôin situö inspection, such as remote locations, the ocean
floor, the interior of the Earth, or the surface of a different planet.
Moreover, many geologic features exhibit scale invariance [Turcotte 1997]; i. e., phenomena are mathematically similar at vastly
different scales. Although it is not possible to directly observe the
topographyofacrystalsurfaceatthe molecularscale,northe structure of tectonic boundaries at the global scale, the same geoscience
observation and analysis skills apply to datasets collected at these
widely different scales.
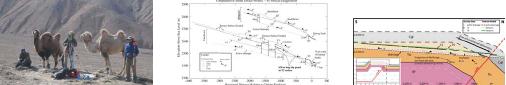
Figure 1 - Scientific workflow of field-based geologic mapping. From left to right: observations made in the field; measurements, recording
elevations acrossafault;and insight,intheformofthe inferred cross-sectionaboveandbelow currentgroundelevationatamapped location.
To improve the return of scientific insight from geoscience data,
we have created (immersive) visualization software and measurement/analysis tools that allow scientists to use real-world skills and
methods inside virtual environments. At the core of this approach
are techniques to display geoscience data at high detail and the
frame rates required for immersive visualization. Our experience
indicates,however, that virtual reality(VR)visualization aloneis
not sufficient to enable the processes scientists employin the real
world. Interaction with, measurements of, and manipulation of the
displayed data are important for feature detection, and they are essential for quantitative analysis. In our example, a scientist must
be able to measure and record the orientation of surfaces (strike
and dip angles) from 3D topography models. For many applications, interaction, such as interactively fitting model parameters to
observations, is also desirable in the model generation stage. Even
if an automatic fitting method is available, observing the response
of a model to parameter changes can lead to new insight into the
modelÆs governing equations.
To summarize: our approach is to create immersive visualizations
of geoscience data, whether the scale of the natural system is millimeters or hundreds of kilometers, in a userÆs near field, i.e.,
within armÆs reach, and to provide users with the tools needed to
touch, manipulate, and measure their data. Our software is aimed
at stereoscopic head-tracked visualization environments with six-
degree-of-freedom (6-DOF) input devices, and it operates effectively in a wide variety of environment types from CAVEs, to display walls and workbenches, to standard desktop PCs (of course
with reduced effectiveness towards the lower end). We discuss
the visualization and interaction challenges posedby contemporary
geoscience applications, our approach to create truly portable VR
software, and the perceived impact of our software on geoscience
research.
1.1 Case Studies
Toillustrateourapproachwith concreteexamples,wehaveselected
three driving geoscience problems.
Geological Mapping Geological mapping is the identification
of structures such as faults, folded layers of rock, and geomorphic features from data collected in the field or from digital elevation data and multi-spectral satellite or photographic imagery [Gold
et al. 2006]. Reconstructions of geologic features are then used to
interpret present and past deformation of the EarthÆs crust as it responds to the forces of plate tectonics and is modified by processes
of erosion and deposition. Ageologist has to make detailed observationsoverlarge areasbyviewingtheregionof interestfrommany
perspectivesandatdifferent scales,bydetailed analysisof focus regions,andbydirect measurementofthe locationand orientationsof
often complex planar and undulatory 3D structures, defined solely
by their intersection with the 3D surface topography.
Displacement Analysis High-resolution laser scanners offer
a new method to accurately measure the deformation of the EarthÆs
surface and of natural or man-made structures due to geological
events such as landslides, floods, or earthquakes [Bawden et al.
2005; Kreylos et al. 2005].Atripod-based terrestrial LiDAR (light
detection and ranging) scanner can measure the 3D position of
points on surfaces at accuracies in the millimeter range, and can
gather surface data sets containing several million points in only
a few hours. Geologists can measure deformations by comparing
two LiDAR scans taken at different times, e. g., before and after
an earthquake. Due to the randomness of sampling and inherent
noise, these comparisons cannot be performed point-by-point. Instead, they require the identification of features common to both
scans, and the measurement of derived properties of these features,
such as plane or cylinder equations or intersection lines or points.
Plate Subduction Simulation Geoscientists employ finite-
element-method (FEM) fluid dynamics simulations to investigate
thefateof tectonic plates entering the EarthÆs mantleinthe vicinity
of subduction zones such as the Aleutian chain [Billen andGurnis
2003]. The observed data used to generate initial configurations
for the simulation are the shape of a subduction zone observed via
ocean floor topography, and the location of the subducting slab in
the EarthÆs mantle reconstructed from the locations of deep earthquakes. To successfully run a simulation, researchers have to convert these line and scattered point data into smooth 3D temperature
and viscosity fields. This setup process involves numerous conversion and filtering steps, and unsatisfactory initial models will lead
to convergencefailure during simulation, thuswasting tremendous
amounts of researcherÆs time and CPU cycles.
2 Related Work
As geoscientists often needto analyze complex3D datafor their research,the3D perceptionofferedby immersive visualization could
be highly beneficial for their workflows. In fact, there are many
previous approaches,withafocusonoilandgasexploration[Evans
et al. 2002].
Lin and Loftin [Lin and Loftin 1998; Lin et al. 1998] presented visualization techniques for 3D seismic data in CAVE [Cruz-Neira
et al. 1993] environments. They focused in particular on interaction techniques such as selection, manipulation, range selection,
and parameter input. Results of a user evaluation of these techniques were presented in [Lin et al. 2000]. They concluded that
VR provides a better 3D visualization environment, but verification and interpretation of 3D seismic data for well planning was
less effective than in desktop environments. This can be attributed
possiblytoalackofdesignandvalidation methodologyfor interactive applications in immersive VR environments as pointed out by
van Dam et al. [van Dam et al. 2000] and Johnson [Johnson 2004].
Gruchalla [Gruchalla 2004] investigated the benefits of immersive
VR for well-path editing. He reported speed and accuracyimprovements of immersive systems over desktop system, based on a study
with 16 participants. Simon [Simon 2005] presented the VRGEO
Demonstrator project for co-located interactiveanalysis of complex
geoscience surfaces and volumes in immersive VR systems.
VR technology has also been used for remote sensing data exploration.DiCarlo[DiCarlo2000]developedaVR toolkitthatallows
users to interact with different 3D representations of the same data
simultaneously in an immersive environment. Chen [Chen 2004]
presentedanon-immersive application thatallows multiple usersto
explore and interact with3D geographical dataof theTibet Plateau
across the internet. Gardner et al. [Gardner et al. 2003] developed
another non-immersive system for analysis of LiDAR data. They
noted that being able to visualize LiDAR data directly in 3D greatly
helped the analysisof complexstructures,but that better analytical
tools for creating, editing, and attributing features needto be developed.
Hardingetal. [Hardingetal.2000]developeda systemfor geoscientific data exploration. They integrated interactive 3D graphics,
haptics, and spatial sound into a multimodal user interface. Recently, Head et al. [Head, III et al. 2005] presented ADVISER, an
immersive visualization system for planetary geoscience applications. This system combines cartographic data and interactive terrain visualization with virtual field tools to, for example, analyze
the north polar-layered terrain on Mars.
In addition to immersive projection environments such as the
CAVE [Cruz-Neira et al. 1993] or the blue-c [Gross et al. 2003],
the GeoWall [Steinwand et al. 2002], with its greatly reducedcost
atthepriceof reduced immersion,hasgained increasing popularity
within the geoscience community.
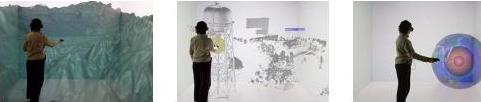
Figure2 - ObservationinVR environment. Left: Observationof the topographicexpressionofvalleys draining into LakeTahoe.Center: ExaminationoftheUCDaviswatertowerandMondaviCenterforthe PerformingArts, measuredbyseveralLiDAR scans.Right: Comparison
of surface features to the distribution of subsurface earthquakes in the EarthÆs crust and mantle.
3 Virtual Reality Workflows
The major goal of our work is to provide researchers with the tools
theyneed to apply the same processes they use in the real world to
new problems in VR environments. In order to reach this goal, we
need to create integrated software to implement three main components:
Real-time Visualization The starting pointof ourworkflowsis
observation.To enable observation, we needtoprovide both real-
time visualizations of large and highly detaileddata sets, and intuitive navigation methods. This combination allows researchers to
inspect their data in the same way they make observations in the
field.Forexample,to detectfaultsina terrain model,a user might
want to walk around in an immersive visualization, crouch to observe a terrain contour, and then pick up the terrain and scale it to
obtain a better detail view. To create convincing visualizations in
head-tracked environments and avoid ôsimulator sickness,ö our algorithms must be able to sustain frame rates upwards of 48Hz per
eye [Kreylos et al. 2001]. This constraint typically requires use of
multiresolution and out-of-core visualization methods.
Direct Manipulation Once users detect a feature by observation, theymust be able to measure or record the feature for further
analysis. Our goal is to provide direct manipulation tools, i.e.,tools
that allowusers to ôtouch their dataö or manipulate data ôat their fingertips.ö This is in contrast to indirect tools such asbuttons, dials
or sliders provided through graphical user interfaces. Forexample,
whendetectingafault lineina terrain model,a user shouldbe able
to directly sketch the line onto the 3D model using a 6-DOF input
device. Our geoscience co-authors believe that this direct interactionisakeyfeatureforeffectiveVR visualization,andis necessary
for the acceptance of VR as a scientific tool. Interaction also poses
an algorithmic challenge, in that it must not interfere with the measurement process.To notbreak ôsuspensionof disbelief,ö an applicationmustshowtheeffectsofan interactionwithinatimeframeof
about0.1s[Kreylosetal.2001].Thisrequirestheuseofincremental visualization techniques such as seeded slices or isosurfaces, and
real-time update of multiresolution data structures.
VR Infrastructure Complex VR applications cannot be developed from scratch; we need a powerful VR toolkit that hides
implementation details from developers, offers a unified programming interface for a wide variety of VR environments, and offers
methods to develop applications that implement a common ôlook
and feel.ö Our main goal was to create a toolkit that supports truly
portable applications, from high-end immersiveVR environments down to standard desktop and portable computers. We found that
most existing VR toolkits [Cruz-Neira et al. 2002; Stu n. d.], while
successfully hiding the display setup of a VR environment û such
as number and position of projected screens, rendering distribution,
and view frustum generation, do not hide the input device environment at a high enough level. Although all contain or use drivers
thathidethe particularinputdevicehardware[Taylor,IIetal.2001;
Reitmayr and Schmalstieg2001], most applications are still written
for particulardevicelayouts(suchasCAVE-stylewand,twodata
gloves, spaceball, joystick, etc.). As a result, an application developed for a two-glove environment will usually work at severly
diminished capacity, if at all, in environments with different input
device setups. Furthermore, while most toolkits offer ôsimulator
modesö to run on standard computers, those are merely intended
for debugging and do not allow scientists to use applications effectively.Wedecided insteadtoprovidean abstractionthatmapsapplication functionality to ôatomic interactionsö that are defined by the
toolkit and implemented by environment-specific plug-ins. These
plug-ins support applications that are truly device-independent, and
in many cases the desktop versions of applications developed for
immersive VR are as usable as applications specifically designed
for the desktop. Additionally, the ability to develop or choose custom plug-ins allows users to adapt the look and feel of all applications to their tastes, e.g.,by choosing theirfavorite navigation or
selection methods. In some aspects, our approach is similar to the
data flow networks describedby Shaw et al. [Shaw et al. 1993].
4 Implementation Challenges
Next, we describe the methods we used to provide real-time visualization and direct manipulation for each of our three case studies,
and elaborate on how our VR toolkit supports portability across a
wide range of environments.
4.1 Real-time Visualization
Our three application scenarios have in common that each requires
scientiststoinspectverylargedatasets.DuetoVRÆsstringentrealtime constraints and thememory limitations of commodity graphics
workstations, this typically requires using out-of-core multiresolution methods for visualization. Furthermore, due to our focus on
interactivity, we must also ensure that the selected methods allow
interactive manipulation of the displayed data.
In the geological mapping example, the source data are topography models (3D heightfields) and draped color images typically
generated from satellite or aerial photography. To make accurate observations, researchers need models with around1û10m resolution andextentsof several hundred kilometers.To enable real-time
visualization of these multi-GB data sets, we employed an out-ofcore multiresolution method based on a quadtree subdivision of a
terrain modelÆs domain. Although other, and arguably more efficient, methods exist (see [Hwa et al. 2004] for an extensive list
of references), the quadtreeÆs simplicity made it easier to integrate
topographyand color imagery, and to allow geologists to interactively create and manipulate geological maps directly on the 3D
terrain model. These mapped lines and polygons are represented as
setsof2Dvectorprimitives (annotated polylines),andare displayed
as 3D geometry draped over the 3D terrain model. As the terrainÆs
displayed level-of-detail changes in response to user navigation, the
2D primitives are converted to 3D geometry on-demand. Rawinput
data are convertedtoaquadtreebyfirstcoveringthe heightfieldÆsor
imageÆsdomain with identical square tiles, and thenbuildingahierarchybottom-upby downsampling four adjacent tiles into a parent
tile half the resolution until the entire domain is covered by a single root tile. The heightfield and image trees are stored in separate
files, and are accessedina top-downfashion during visualization.
WheneveradisplayedtileÆsresolution becomestoolow,its children
are brought in from external storage by a background thread and
displayed as soon as they are available. Two levels of caching (external storage to main memory, and main memory to graphics card
memory) are employed to optimize rendering performance. The decisionwhentosplitanodeisbasedonthe projectedsizeofthenode
(to ensure that model triangle size is on the order of display pixel
size), whether a node intersects the view frustum (to enable frustum culling), and on a nodeÆs distance from anyinteraction cursor
(to enable ôfocus+contextö visualization).
In the displacement analysis example, the source data are unsorted
sets of attributed 3D points generated from merged laser scans.
Measuring displacements of small objects withhigh accuracy requires hundreds of sample points per object; this results in very
large point sets containing several million points. The UC Davis
water tower data set contains about 15Mpoints; another data set of
a landslide contains about 50M points. Point-based visualization
is an active research area [Amenta and Kil 2004; Fleishman et al.
2003; Alexa et al. 2001], but most approaches rely on sampling
density assumptions that are typically not met by LiDAR data. To
avoid introducing bias, we chose not to attempt to reconstruct surfaces from the point data, but instead to visualize the point sets
directly using an out-of-core multiresolution approach based on octrees. These octrees are created in a pre-processing step by first
assigningallpointstoarootnodecoveringtheentirepointsetÆsdomain, and then recursively splitting nodes that contain more than a
preset number of points. Once the entire tree is constructed, lower-
resolution point sets are created for interior nodesbyrandomly sub-
sampling the union of their childrenÆs point sets. The resulting octreeis storedina file and accessedina top-downfashion during
visualization. Whenever the average point distance in a node becomes too large, its children are brought in from external storage
and displayed instead. The caching schemes used to speed up rendering, and the decisions when to split nodes, are very similar to
the terrain rendering algorithm.
The source data in the plate subduction simulation example are
FEM grids produced by fluid dynamics simulations run on a remote computation cluster. Due to the gridsÆ irregular structures, we
have not yet implemented out-of-core or multiresolution methods
fortheir visualization;currently,datasizeislimitedbythememory
sizeof the display computers.Fortunately, the biggest data set produced by the simulations right now contains about 20Mnodes and
fitseasilyinto1GBof memory(leavingenoughroomforextracted
visualizationprimitivessuchas isosurfaces).Wewereabletoleveragepre-existingsoftwareto representthesedata,andthemainwork
has been to add new visualization functionality to the component
framework described in [Kreylos et al. 2001]. Our approach generally follows the methods usedin theVirtualWindtunnel [Bryson
and Levit 1991]. The techniques we use to visualize these 3D data
are color-mapped planar slices, and isosurfaces computing using an
incremental version of the Marching Cubes algorithm [Meyer and
Globus 1993; Lorensen and Cline 1987].
4.2 Direct Manipulation
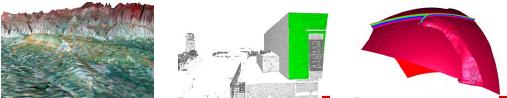
Figure 3 - Measurements in VR environments. Left: Locations of faults, folds, and drainages precisely mapped directly onto the virtual
topographicsurface. Center: Selectedpointset (green)in3DLiDAR scantoextractplane equationoftheMondavi Centerwall,to measure
precise relationships between objects or changes in location over time. Right: Color-mapped vertical slice and isosurface extracted from
simulation data to characterize the geometry and dynamics of the subduction of ocean crust into the EarthÆs mantle.
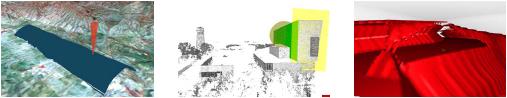
Figure4 - Insightgainedfrom visualizationinVRenvironments. Left:A3Dfoldsurfacecalculatedfromthe virtuallymappeddatainFigure3.
Center:Anextractedplane equation(yellow)comparedtoasecondsurface definedbythe selectedpointset (green). Right: Isosurfaceshowing
aliasing in the simulation viscosity field that prevents the simulation from converging.
The typical process in exploring 3D volume data such as results
from plate subduction simulations is to extract visualization primitives such as slices, isosurfaces, or streamlines (as shown in Figures3and4, right). Proper placementof these primitives can provide insight into the local or global structure of the examined data.
In typical desktop visualization programs, extraction is guided by
indirect interaction (such as entering an isovalue into a text field or
selecting it via a dial or slider). Once extraction is initiated, the
program typically blocks until the complete primitive is extracted
and can be displayed. Depending on primitive type and data size,
this can take several seconds or even minutes. The main problem
with this approach is that primitives only show the structure of the
examineddataveryclosetotheprimitive.To obtaina moreglobal
understanding, users have to extract and display manyprimitives,
which is time consuming and can lead to cluttering. An alternative
approach is to support interactive extraction, where a user selects
the parameters guiding primitiveextraction via direct manipulation,
andthe (partial) resultofextractionis displayed immediately ûtypically within 0.1 s. For example, an isosurface can be specified not
by its isovalue,butbya point on its surface [Kreylos et al. 2001;
Meyer and Globus 1993]. Using a 6-DOF input device, users can
pick a point of interest inside the examined data setÆs domain, and
the program will startextracting the isosurface containing that point
starting at the picked point using seeded isosurface extraction performed by a background thread. After a preset amountof time, the
partialextraction resultis displayed.Ifthe userhasmovedtheinput
device in the meantime, the program immediately starts extracting
a new isosurface; otherwise, it keeps expanding the current surface.Thisapproachallows usersto interactivelydragan isosurface
througha data setÆs domain, therebygaininga more global understanding of a data setÆs structure without introducing clutter. The
same approach can be used to extract slices based on the position
and orientation of an input device, or to drag stream lines through a
vector field.Inourexperience, observingthebehavioroftheseôdynamicprimitivesöoffersquick insight intoa data set during initial
exploration. Although the interaction itself is very straightforward,
implementing incrementalversionsof commonprimitiveextraction
algorithms can be a challenge.
4.3 Portability
The wide range of different VR environment layouts and capabilitiesposes major challenges for developers wishing to create applications that run unchanged on a variety of platforms. The variability can be roughly classified into three somewhat orthogonal
areas: (1) distribution model (single display, single-CPU/multipipe, multi-CPU/multipipe, cluster-based); (2) display model (single screen, multi-screen, head-mounted); and (3) input environment
(mouse/keyboard, desktop devices such as spaceballs or joysticks,
single 6-DOF device, multiple 6-DOF devices). The possible combinations are limitless. For example, IDAV has a cluster-based
head-tracked multi-screen environment with a single 6-DOF input
device and an additional head-mounted display for multi-person
viewing. In order to manage this combinatorial explosion, a developer must rely on VR toolkits with high powers of abstraction.
There are many existing toolkits, and most of them do an excellent
job of hiding variety in areas (1) and (2). However, our emphasis
on interactivitymakes our softwaredependheavilyontheavailable
input environment, and we found existing toolkits to be lacking in
this area. Their input abstraction is limited to hiding low-level differences in input device hardware, but they do not shield an application from the differences between an environment having two
6-DOF input devices and one having, say, a mouse/keyboard and a
joystick. Due to the lack of input environment abstraction in available toolkits,we decidedtobase ourVR softwareon Vrui (VR user
interface), a toolkit that has been under development at IDAVfor
several years.
Vrui follows the typical approaches of hiding distribution and display models. When a VR application is started, it determines the
configuration of the local environment by reading a system-wide
configuration file. The application adapts itself to the distribution
model by starting additional threads in a multi-CPU system, or by
replicating itself onto all cluster nodes in a cluster-based system.
Afterwards it establishes communication between all application
threads or processes, and initializes the application itself. Next, it
creates rendering resources (windows and OpenGL contexts) for all
displays of each thread or process, andfinally enters the main loop
where program state updates in each process are interleaved with
rendercycles for all displays. Thus,by default,Vrui implementsa
ôsplit-firstö model where a distributed application is synchronized
by running identical processes and providing identical input data.
However, applications are free to request private communications
channels to enable ôsplit-middleö models, where an application
splits itself intoa master process and several render processes. This
enables better utilization of computing resources and easy integration of higher-level abstractions likeshared scene graphs. In theory,
Vrui supports ôsplit-lastö approaches by running an application in
single-CPU mode on top of a distributed OpenGL implementation
such as Chromium [Humphreys et al. 2002],but this approach usually cannot compete due to interconnect bandwidth limitations.
The novel component of Vrui is its management of input devices.
At the lowest level, it contains a device driver daemon that bundles any numberofphysical inputdevices intoa single input device stream, and offers this stream to applications connecting locally or remotely via a socket. Vrui currently has its own device
daemon,butit contains interfacesto talkto standard daemons such
as vrpn [Taylor, II et al. 2001]. The difference to other toolkits is
how applications connect to input devices. Usually, an application
requests an input device by name, eg., ôwandö or ôleft glove,ö and
then installs callbacks to be notified of device events or polls the
device in its inner loop, leading to non-portable applications. Vrui,
on the other hand, introduces a middle layer of so-called ôtoolsö
thatmapinputdeviceeventsto higher-level semanticevents such as
ônavigate,ö ôselect,ö or ôdrag.ö From an applicationÆs point of view,
tools offer callbackhooks that can call application functions when,
for example, the user selects a point in space. The trick is that the
mapping from input devices to semantic events is hidden from the
application, and can be prescribed externally through configuration
files, and even be changed by a user during a programÆs run-time.
Thus Vrui can provide tool implementations optimized for the local environment.Forexample, an intuitivenavigation method using
a single 6-DOFinputdeviceistopick spaceby pressingabutton
andthentodragspacebyattachingthenavigation coordinateframe
to the input deviceÆs coordinate system. In a mouse/keyboard environment, on the other hand, an agreed-upon navigation method is to
attach a virtual trackball, a screen-plane panner, and a virtual zoom
slider to several mousebuttons. Using tools, interactions are performed in the optimal way for a given environment. Furthermore,
this approachallows userstopick theirownfavorite methodofperforming particular interactions, and thus to customize the ôlook and
feelö of the VR applications they use.
The tool approach has another importantbenefit: itovercomes the
scarcityofbuttonsavailableontypical6-DOFdevices. Whenusing
direct manipulation, interactions are typically initiated by pressing
abuttononaninputdevice. Complex programsofferalarge palette
of interactions, and these cannot all be mapped to individualbuttons. The alternative of using GUIelements such as menus to select actions is often cumbersome and interferes with usage patterns
where users need to seamlessly switch between several operations.
Using tools, users can assign arbitrary application functions to arbitrarybuttonsanddevicesat run-time.Forexample,ifa user anticipates that she has to perform a long sequence of selection and
navigation interactions,shecanassignanavigationtooltoonebutton and a selection tool to another one, and these assignments can
later be changed to accomodate changing usage patterns. It is importanttonotethatthisflexibilityis entirely handledbythe toolkit,
and completelyinvisibletotheapplication.Asasideeffect,thetool
interfaceoftenleadstoapplicationdesignsthatoffer unintendedbut
useful interactions, such as a user of our plate subduction simulation application being able to drag a dynamic slice and isosurface
at the same time using two input devices.
5 Results
We have evaluated the effectiveness and efficiency of our approaches to enabling scientific workflows for VR by recording the
experiences of our geoscience collaborators and collecting feedback from other users. Due to the specialized applications and
the narrow target user base (geoscientists), we have not yet performeda formaluser study,but anecdotalevidence shows that our
approaches are infact useful. In the following, we list the benefits
that the geoscience co-authors on this paper and other users have
identified when comparing our VR applications to their previously
available approaches.
To determine the impact of using VR methods on geological mapping,wehave performedexperiments whereseveralof our geology
co-authors created a map of the same area using their previous system (Stereo Analyst [Ste n. d.]) and our new system. Our users had
to perform two tasks: record all observations that could be made
over an unlimited amount of time, and record all observations that
could be made in a limited amount of time. The first test was to
judge the effectiveness of our new system, i.e., the accuracy and
confidence of the mapping (see Figure 5, top row); the second test
was to judge its efficiency, i.,e., the number of observations made
in time (see Figure 5, bottom row). This informal study was not
quantitative due to the small number of participants and the fact
thateach participant performedall tests,butit supports ourhypothesis that VR visualization enables scientists to make more accurate
observations in less time, and to be more confident about their observations.
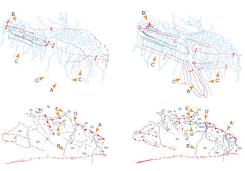
Figure 5: Results from comparison between Stereo Analyst (left
column) and our VR mapping application (right column). Top
row: sensitivity test comparing the accuracyand confidence of maps
created with unlimited time. Bottom row: time test comparing the
number of observations made in the same amount of time. The gold
arrows highlightkeydifferences between the result maps.
Displacement analysis using LiDAR data essentially requires VR
visualization and interaction. Since the sampled point sets are typically not high enough in resolution to reconstruct surfaces of small
features, theycan only be visualized as point sets to prevent the introduction of bias. Without stereoscopic display a user only sees
an amorphous point cloud, and it is veryhard even for experienced
users to identify objects in still images. Users typically rely on
motion parallax to provide depth clues by constantly spinning or
panning the model,but this interferes with accurate point selection.
In addition, selecting non-regular 3D point sets using 2D input devices is inherently difficult. Using stereoscopic displays, we find
that we and most users immediately perceive 3D objects, and can
identify the points defining features accurately. In combination with
the intuitive point set selection, this results in a more effective and
efficient process, where smaller features can be extracted more accurately in less time.
We have only recently started using our 3D data visualization system to explore plate subduction simulation data. The first results
have come from using it as a debugging tool for FEM simulations.
Oneof our co-authorswasfacinga convergencefailurein her simulations of plate subduction in the Aleutian region, and could not
find the cause of the problem using her previous set of tools. By
exploringher datain theVRapplication, we quickly found several
regions where one component of the simulation input exhibited severe aliasing, and were able to trace it back to the algorithms used
when converting plate surface data reconstructed from subsurface
earthquake locations into a 3D temperature and viscosity model.
We have hence devised an alternative approach to model generation that will hopefully solve the problem (results are still pending).
Weviewthisas anecdotalevidencethatourVR applicationis more
effective than the previously used program, in that we were able to
pinpoint a problem that had not been identified before.
6 Conclusion
We have presented an approach for turning immersive visualization
into a scientific tool. We focused on transferring real-world skills
into a virtual environment by providing real-time visualization and
direct interaction, thereby allowing scientists to use their existing
workflows in VR, and applying their skills to new problems. We
have illustrated our approach for three distinct geoscience applications, which have in common the need for the human interaction
withdatatomake scientific progress.Themost importantfactorin
the success of our described efforts has been the willingness of the
team members to cross disciplinary boundaries in an effort to understand the driving scientific questions posedbylarge geoscience
data setsandthe capabilitiesand limitationsof interactiveVR.This
successful collaboration between geoscientistsand information scientists has resulted in new approaches to visualization that take advantage of the skills of geoscientists while also exploiting the full
capabilities of a VR environment.
We emphasize that the methods that make data exploration possible arenot confinedto state-of-the-artVR systems,but are adapted
to a wide range of other visualization systems. Previously developed VR software has typically been limited to portability between
VR systems with very similar input devices, limiting the ability of
a research group with a low-end visualization system to scale up
in a cost-effective manner). The value of immersive, interactive
data exploration is growing more important with the explosion of
large datasets created by imaging, large observational efforts, and
high-resolution computer simulations. Great opportunities for further development exist especially for simulation applications. The
ability to rapidly create complex objects for use in models allows
the use of more realistic boundary conditions and objects in Earth
science modeling. One of the most difficult aspects of developing
forward models and simulations of earth science processes is identifying the spatial distribution of critical behaviors and thetemporal
framework of changes. Proper resolution is critical to modeling
realisticbehaviors.An abilityto interactively adjust critical parameters in 3D models substantially increases the appropriateness of
boundary conditions during model development, promoting rapid
advances in model sophistication, accuracy, and relevance to natural Earth processes.
Acknowledgments This work was supported by the National ScienceFoundation under contractACI 9624034 (CAREER
Award), through the Large Scientific and Software Data SetVisualization (LSSDSV) program under contractACI 9982251, through
the National Partnership for Advanced Computational Infrastructure(NPACI),andalarge InformationTechnology Research(ITR)
grant. We gratefully acknowledge the support of theW.M.Keck
FoundationprovidedtotheUCDavisCenterfor ActiveVisualization in the Earth Sciences (KeckCAVES), andthank the members
of the Departmentof Geology and theVisualization and Computer
Graphics Research Group at the Institute for Data Analysis andVisualization (IDAV) at the University of California, Davis.
References
1. ALEXA, M., BEHR, J., COHEN-OR, D., FLEISHMAN, S., LEVIN, D.,
AND SILVA,C.T. 2001. Point set surfaces. In Proceedings of the Conference onVisualization 2001 (VIS-01), IEEE Computer Society, Piscataway,NJ,T.Ertl,K.Joy,andA.Varshney,Eds., 21û28.
2. AMENTA,N., AND KIL,Y.J. 2004. Defining point set surfaces. In ACM,
ACM Press, 1515 Broadway, New York, NY 10036, vol. 23 of ACM
Transactions onGraphics(TOG),ACM, 264û270.
3. BAWDEN, G. W., SCHMITZ, S., HOWLE, J. F., LACZNIAK, R. J., BOWERS, J., OSTERHUBER, R., AND IRVINE, P. 2005. Four-dimensional surface deformation analysis, snowvolume calculation, andfault mapping with ground based tripod LiDAR. Eos Trans. AGU 86, 52, Fall Meet. Suppl., Abstract G33Dû07.
4. BILLEN,M.I., AND GURNIS,M. 2003.Acomparisonof dynamic models
in the Aleutian and Tonga-Kermadec subduction zones. Geochemistry,
Geophysics and Geosystems4, 4, 1035, doi:10.1029/2001GC000295.
5. BRYSON,S., AND LEVIT,C. 1991. TheVirtualWindtunnel:Anenvironment for the exploration of three-dimensional unsteady flows. In Proc. ofVisualization Æ91, IEEE Computer Society Press, Los Alamitos, CA, 17û24.
6. CHEN,S. 2004.Aprototypeof virtual geographicalenvironment(VGE)for
theTibet Plateau and its applications. In Geoscience and Remote Sensing
Symposium, 2004. Proceedings. IEEE International, vol. 5, 2849û2852.
7. CRUZ-NEIRA,C.,SANDIN,D.J., AND DEFANTI,T.A. 1993. Surround-
screen projection-based virtual reality: The design and implementation
of the CAVE. In Proceedings of SIGGRAPH 93, Computer Graphics
Proceedings, Annual Conference Series, 135û142.
8. CRUZ-NEIRA, C., BIERBAUM, A., HARTLING, P., JUST, C., AND MEINERT,K. 2002. VR Juggler: An open source platform for virtual reality applications. In 40th AIAA Aerospace Sciences Meeting and Exhibit.
9. DI CARLO, W. 2000. Exploring multi-dimensional remote sensing data
with a virtual reality system. Geographical&Environmental Modelling 4,1(May), 7û20.
10. ERLEBACKER,G.,YUEN,D.A., AND DUBUFFET,F. Current trends and
demands in visualization in the geosciences. Electronic Geosciences.
11. EVANS, F., VOLZ, W., DORN, G., FR.OHLICH, B., AND ROBERTS,D.M.
2002. Future trendsinoilandgas visualization.In VIS Æ02: Proceedings
of the conference onVisualization Æ02, IEEE Computer Society,Washington, DC, USA, 567û570.
12. FLEISHMAN,S.,COHEN-OR,D.,ALEXA,M., AND SILVA,C.T. 2003.
Progressive point set surfaces. In ACMTransactions on Graphics, J. C.
Hart, Ed.,vol. 22(4).ACM Press, 997û1011.
13. GARDNER, J. V., WARNER, T., NELLIS, M. D., AND BRANDTBERG,T.
2003.Virtual realitytechnology for lidar data analysis. In Geo-Spatial
andTemporal Image and Data Exploitation III, N. L.Faust andW. E.
Roper, Eds., vol. 5097 of Proceedings of SPIE, 48û57.
14. GOLD,R.D.,COWGILL,E.,WANG,X.-F., AND CHEN,X.-H. 2006.
Applicationof trishearfault-propagation foldingtoactivereversefaults:
examples fromthe Dalongfault, Gansuprovince,NW China. Journal of
Structural Geology 28, 200û219.
15. GROSS, M., LAMBORAY, E., N..AF, M., WURMLIN, S., SPAGNO, C.,
KUNZ, A., LANG, S., STREHLKE, K., VANDE MOERE, A., ENGELI, M., VAN GOOL, L., KOLLER-MEIER, E., SVOBODA, T., AND
STAADT,O. 2003. blue-c:Aspatially immersive displayand3d video
portal for telepresence. ACMTransactions onGraphics22,3(July).
16. GRUCHALLA, K. 2004. Immersive well-path editing: investigating the
added value of immersion. In Virtual Reality, 2004. Proceedings. IEEE,
157û164.
17. HARDING, C., KAKADIARIS, I. A., AND LOFTIN, R. B. 2000. Amultimodal user interface for geoscientific data investigation. In Advances
in Multimodal Interfaces -ICMI 2000, ThirdInternational Conference,
Beijing, China, October 14-16, 2000, Proceedings, 615û623.
18. HEAD, III, J. W., VAN DAM, A., FULCOMER, S. G., FORSBERG, A.,
PRABHAT, ROSSER, G., AND MILKOVICH, S. 2005. ADVISER:
Immersive scientific visualization applied to mars research and exploration. Pothogrammetric Engineering&Remote Sensing 71, 10 (October), 1219û1225.
19. HUMPHREYS, G., HOUSTON, M., NG, R., FRANK, R., AHERN, S.,
KIRCHNER,P.D., AND KLOSOWSKI,J.T. 2002. Chromium:astreamprocessing framework for interactive rendering on clusters. In Proceedings of the 29th annual conference on Computer graphics and interactive
techniques,ACM Press,NewYork,NY, 693û702.
20. HWA,L.M.,DUCHAINEAU,M.A., AND JOY,K.I. 2004. Adaptive 4-8
texture hierarchies. In Proceedings of IEEEVisualization 2004, Computer Society Press, Los Alamitos, CA, IEEE, 219û226.
21. JOHNSON,C. 2004.Top scientific visualization research problems. Computer Graphics and Applications, IEEE 24, 4, 13û17.
22. JORDAN, K. E., YUEN, D. A., REUTELER, D. M., ZHANG, S. X., AND
HAIMES,R. 1996.Parallel interactive visualizationof3D mantle convection. IEEE Computational Science&Engineering3, 4, 29û37.
23. KREYLOS,O.,BETHEL,E.W.,LIGOCKI,T.J., AND HAMANN,B. 2001.
Virtual-reality based interactive exploration of multiresolution data. In
Hierarchical Approximation and Geometrical Methods for ScientificVisualization, G.Farin, H. Hagen, and B. Hamann, Eds. Springer-Verlag,
Heidelberg, Germany, 205û224.
24. KREYLOS,O.,BAWDEN,G.W., AND KELLOGG,L.H. 2005. New visualization techniques to analyze ultra-high resolution four-dimensional
surface deformation imagery collected with ground-based tripod LiDAR.
EosTrans.AGU 86, 52,Fall Meet. Suppl., Abstract IN43Bû0332.
25. LIN,C.-R., AND LOFTIN,R.B. 1998. Applicationof virtual realityin the
interpretation of geoscience data. In VRST Æ98:ProceedingsoftheACM
symposium onVirtualreality software and technology,ACM Press, New
York, NY, USA, 187û194.
26. LIN, C.-R., LOFTIN, R. B., AND STARK, T. 1998. Virtual reality for
geosciences visualization. In Proceedings of 3rdAsiaPacific Computer
Human Interaction Conference, 196û201.
27. LIN,C.-R.,LOFTIN,R.B., AND NELSON,JR.,H.R. 2000. Interaction
with geoscience data in an immersive environment. In Virtual Reality,
2000. Proceedings. IEEE, 55û62.
28. LORENSEN,W.E., AND CLINE,H.E. 1987. Marching Cubes:Ahigh resolution 3D surface construction algorithm. In Proc. of SIGGRAPH Æ87,
ACM, 163û169.
29. MEYER, T., AND GLOBUS, A. 1993. Direct manipulation of isosurfaces
andcuttingplanesin virtualenvironments.Tech.Rep. CSû93û54,Brown
University, Providence, RI.
30. REITMAYR, G., AND SCHMALSTIEG, D. 2001. OpenTracker: An open
software architecture for reconfigurable tracking based on XML. In Virtual Reality 2001 Conference.
31. ROSS, L. E., KELLY, M., AND SPRINGER, A. E. 2003. GeoWall use
in an introductory geology laboratory: Impacts in student understanding
of field mapping concepts. EosTrans.AGU 84, 46,Fall Meet. Suppl.,
Abstract ED31Aû07.
32. SHAW,C.,GREEN,M.,LIANG,J., AND SUN,Y. 1993. Decoupled simulation in virtual reality with the MR toolkit. ACMTransactions on Information Systems 11,3(July), 278û317.
33. SIMON, A. 2005. First-person experience and usability of co-located interaction in a projection-based virtual environment. In Proceedings of
theACM Symposium onVirtual Reality Software andTechnology, VRST
2005, Monterey, CA, USA, November 7-9, 23û30.
34. SPRAGUE, K. B., AND DE KEMP, E. 2005. Interpretive tools for 3-D
structural geological modelling. Part II: Surface design from sparse spatial data. Geoinformatica9,1(Mar.), 5û32.
35. Stereo Analyst for ArcGIS.
http://gis.leica-geosystems.com/Products/StereoAnalyst/ .
36. STEINWAND, D., DAVIS, B., AND WEEKS, N. 2002. GeoWall: Investigations into low-cost stereo display systems. Tech. Rep. 03û198, USGS Open File Report.
37. The Studierstube home page.
http://www.cg.tuwien.ac.at/research/vr/AVS/html/ .
38. TAYLOR,II,R.M.,HUDSON,T.C.,SEEGER,A.,WEBER,H.,JULIANO,
J., AND HELSER,A.T. 2001. VRPN:adevice-independent, network-
transparent VR peripheral system. In Proceedings of theACM symposium onVirtualreality software and technology,ACM Press,NewYork,
NY, 55û61.
39. THURMOND,J.B.,DRZEWIECKI,P.A., AND XU,X.M. 2005. Building
simple multiscale visualizations of outcrop geology using virtual reality
modeling language (VRML). Computers&Geosciences 31,7(Aug.),
913û919.
40. TUFTE,E. 1983. TheVisual Displayof Quantitative Information.
41. TURCOTTE,D.L. 1997. Fractals and Chaos in Geology and Geophysics,
2nd ed. Cambridge University Press.
42. VAN DAM, A., FORSBERG, A. S., LAIDLAW, D. H., LAVIOLA,J.J.,J.,
AND SIMPSON,R.M. 2000. ImmersiveVR for scientific visualization:
A progress report. Computer Graphics and Applications, IEEE 20, 6,
26û52.