|
|
The task of EMC estimation subject to capacity of a casual noise disturbance and sluggishness of object - by squaring and smoothing is
considered. It is shown that distribution low of the casual process after squaring and smoothing is beta-distribution. The solution of the problem
is illustrated by an example of an estimation of permissible voltage unbalance.
1.PROBLEM DEFINITION
A dynamic EMC-model of an object usually includes a linear filter, a squaring and smoothing (SS)
unit and a statistical analysis unit: for example the flickermeter (IEC, Publication 868, 1986). The filter simulates reaction y(t) of object to noise
disturbance,
and the SS unit takes into account the fact that the consequences of EMC infringement depend on capacity of reaction and sluggishness of object.
We will conditionally refer to the ordinates of proces  after SS as doses (by analogy to a dose of
flicker). The relation between the processes before and after SS is described by the differential equation after SS as doses (by analogy to a dose of
flicker). The relation between the processes before and after SS is described by the differential equation
 (1) (1)
where T is the time constant of the sluggishness of the object.
The heart of the problem is definition of density of distribution  or distribution function
  , based on which the peak value , based on which the peak value  of the dose
is calculated (excess of of the dose
is calculated (excess of  is possible with the given probability Ex). The right part of the equation
is generally nonlinear, therefore the exact solution only exists for the special case of a telegraph signal. The approximate solution in expanded
form of Edgeworth series is known, but the necessary initial information is inaccessible in practice. is possible with the given probability Ex). The right part of the equation
is generally nonlinear, therefore the exact solution only exists for the special case of a telegraph signal. The approximate solution in expanded
form of Edgeworth series is known, but the necessary initial information is inaccessible in practice.
The statistical solution of the SS problem by methods of simulation (synthetic sampling) is given in this
report. For brevity the elementary EMC-model without the filter, when y = x is considered. Such a model is applied to estimate an additional
overheating of objects from non-sinusoidal and unbalanced voltage. In these cases the acceptable continuous value [y] of the noise disturbance
is standardised, and purpose of the study is determination of "an inertial maximum"  .
The requirement of EMC is that .
The requirement of EMC is that  . .
Estimated value of the dose is calculated on the acceptable probability Ex of its excess by the solving
of the equation
 (1) (1)
In the standard of the quality of the electric power in the countries cf Commonwealth of Independent States, a value Ex = 0,05 is accepted.
Since objects with different time constant of sluggishness can be connected to electric power supply network, a dependence of inertial maximum on
T should be generally obtained.
2. SIMULATION OF THE DOSE
There are various methods for simulation of casual processes. In systems of power supply, which carry
group of noise disturbance sources, it is expedient to use summation of individual noise disturbances with casual shifts. When realisations follow
the law of normal distribution, each realisation y(t) is formed by sum of a large number of n "elementary" processes (n = 100.. 1000) of the simple
form. The elementary process has a mean value equal to zero and correlation function (KF) n times smaller than the desired KF
 of the simulated process. The mean value y of a process y(t) is added to y(t) after summation
of elementary processes and before the operation of squaring. of the simulated process. The mean value y of a process y(t) is added to y(t) after summation
of elementary processes and before the operation of squaring.
To determine the statistical solutions, it is necessary to simulate an ensemble of a large number N
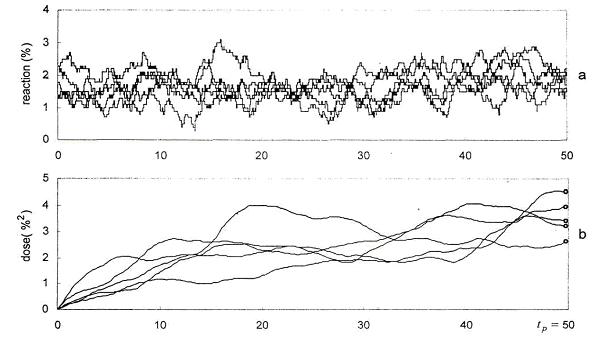
of realisations of process y(t). Fig. 1 shows a sample of 5 of N = 500 realisations of normal process of negative sequence voltage changes with
mean value y = l,6%, standard deviation  and exponential correlation function having time
of correlation and exponential correlation function having time
of correlation  . .
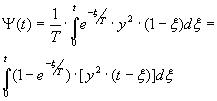
Each realisation y(t) -is squared, and the corresponding realisations of doses are calculated using Duamel
integral:
 (2) (2)
where , is integration variable. , is integration variable.
In practice, a transient comes to the end during the time tp=(5-6)T . When, due to nature of the task, it is
enough to compute only a distribution function, simulation stops at t=-t p. If, in addition, it is necessary to calculate KF of doses over the range of
argument from 0 to  , then the time of simulation is equal to , then the time of simulation is equal to  In Fig. lb, five realisations of doses are shown at T = 10 S. Realisations of doses correspond to realisations in Fig. la.
As simulation methods provide new knowledge, the requirements for the quality of simulation must
be greater than for processing experimental data. It is also necessary to take into account, that the operation of squaring increases an error
Therefore, in addition to checking the fidelity of reproduction of distribution function and KF of process y(t), it is necessary to check reproduction
of distribution function of process  , which can be determined analytically from f(y) or F(y). The
additional check at T = 0 ensures quality of simulation of doses at T > 0, as the smoothing reduces the error. , which can be determined analytically from f(y) or F(y). The
additional check at T = 0 ensures quality of simulation of doses at T > 0, as the smoothing reduces the error.

time (sec)
Figure1.
|
|