ДонНТУ
Портал магистров
ДонНТУ
| Об авторе |
| Реферат |
| Ссылки |
| Библиотека |
| Отчет о поиске |
| Индивидуальный раздел |
Moving Average Bounce
Автор: John Devcic
Источник в интернет: http://www.investopedia.com/articles/trading/08/moving-average-bounce.asp
A bounce off an influential moving average (MA) is a common
trade setup used by active traders. The strategy is simple to set up and you
will only need a basic charting package to get started. Once you have the chart
settings ready, the only thing left is to find a security to trade. This article
will outline the basic price moves that signal the moving average bounce and
what you should expect if you choose to employ this trading strategy. (For
background reading on these types of indicators, check out our Moving Averages
tutorial.)
What to Look For
There are three things you should observe when you're looking to initiate a
trade using the moving average bounce trading system:
-
A move away from the exponential moving average (EMA) line.
-
A retracement toward or through the EMA line.
-
A bar that breaks upward.
With the moving average bounce strategy, you're looking for the price to fall
toward the moving average and then make a rapid move upward away from it. It is
important to remember that when an equities price is moving away from the
average, there is a tendency for the price to retrace or even trade below the
EMA line. Once this retracement is complete, the price will again move higher.
That's what is called the bounce off of the EMA line. (For further reading on
using the EMA, see Exploring The Exponentially Weighted Moving Average.)
Generally, this strategy can be used on a chart with any time frame, but for
this article we'll focus on the intraday OHLC chart with five-minute prices and
use a 34-period EMA. (For further reading on the OHLC chart, see Western Line Vs.
Candlestick Charting.)
Case Study
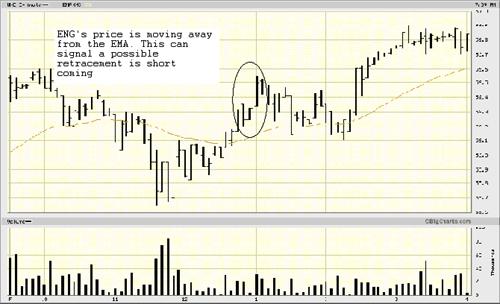
One example of the moving average bounce can be taken from the price action for
United States Natural Gas Fund (AMEX:UNG) on May 23, 2008 seen in Figure 1. A
clear move away from the EMA line is all that is needed. Once a strong move away
from the EMA line is spotted, you have to wait for a retracement.
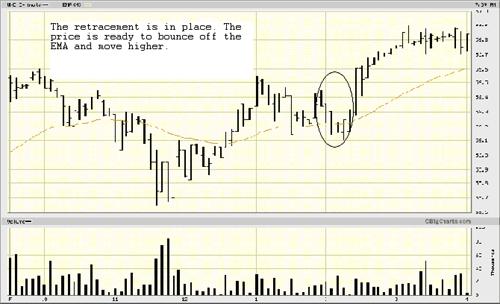
A retracement does indeed occur a little over an hour later in
Figure 2. Lower bars are formed on the way down as the bounce is being set up.
It is important that you see at least four bars that move toward the moving
average, because this usually means that this is a true retracement and not just
a period of sideways trading.
As you can see from the chart below, it is not uncommon to see the price briefly
fall below the MA. Since there are many traders buying and selling the stock, it
is rare that the price will stop exactly at the price of the moving average.
(For more on using technical analysis in active trading, read Defining Active
Trading and Trading Without Noise.)
As you can see, after another
minor upturn the price begins to trade lower again. We get four consecutive
lower bars near the moving average, so a buy order would be entered. The EMA
line was broken, which would cause some concern, but usually the true
direction is decided after a couple more bars have the chance to develop.
The exit can happen on any one of a myriad of scenarios. One exit point is
triggered when the price makes two consecutive bars with lower lows below
the moving average, regardless of whether you use one-minute or five-minute
charts.
Analyzing the Outcome
The UNG trade worked well. It is important to remember that the criteria
established are customizable and that it is the goal of each trader to enter a
position before the resultant bounce of the moving average occurs. Once the move
away from the EMA line was spotted, it was more than two hours before the trade
was actually placed. There was a minor pullback, but at the end of the day the
stock was able to trend higher following the bounce.
Patience proved to be the right move, because finally, after another move
upward, we get what we were looking for - the four consecutive lower bars tell
us that the retracement is indeed true. In the UNG case, it just so happens that
four consecutive bars were seen and the fifth one is the one that begins the
bounce by trading higher.
Some traders will use price targets or percentage gains to initiate a close of
the position. While any one of the scenarios set out is valid, which one is
chosen will depend on the trader. In the UNG trade, the position is held for
nearly two hours, which means we followed this trade for more than four hours.
There is no set time limit on a bounce, so choosing a percentage gain to close
out your trade could mean you miss some more upward movement. The moving average
bounce strategy is only used to spot and capture the move after a retracement;
there is no way of knowing how much higher the move will continue. (Read more
about using price targets in Target Prices Vs. Ratings.)
Conclusion
The moving average bounce strategy has important checks built into it to protect
traders from getting in too early on a possible bounce. Of course, there are no
perfect scenarios, and indeed, there is a chance that a bounce could occur after
only two or three bars are seen.
Traders will tend to move prices radically higher quickly; this is usually
followed by some quick profit taking. This profit taking is the retracement we
see when the price will come back and maybe even trade through the EMA.
The EMA gives us the platform or springboard where the price will jump from.
Usually, if the price continues to go higher, it will not trade below the EMA
for very long - that's the important theme of this system. There will be a move
off of the EMA if the initial price move is indeed justified.
It is important to remember that there is no way of knowing how much higher the
bounce will go, so trade accordingly.