TEXTILE ITEMS CLASSIFICATION FOR SALES FORECASTING
Авторы: S. Thomassey, M. Happiette, J.M. Castelain
Источник: http://scs-europe.net/services/ess2002/PDF/tex-3.pdf
ABSTRACT
In order to reduce their stock, to avoid ruptures and to direct their marketing policies, textile companies must improve their supply chain management. This organization requires forecasting systems adapted to the uncertain environment of the textile field. Taking into account also delivery constraints, textile distribution need mean-term forecasting (one season) in order to launch new production. The proposed model, based on items classification, performs mean-term forecasting from forecast established on items families. To evaluate accuracy of our model, a simulation is realized on real sales data of an important ready to wear distributor.
INTRODUCTION
To schedule all steps require to produce and deal textile items, managers must rely on efficient and accurate
forecasting systems. A sales forecast allowing to predict in a due time the right quantity to produce, is one of the most
important factors for the success of a lean production (Kincade et al. 1993; Sboui et al. 2001).
Sales forecasting in textile domain is very complex. In deed, sales are disturbed by numerous factors. These ones
can depend on item itself (color, price,...), on distributor (stores number, merchandizing,...), on customers
(fashion,...) or on external factor (weather, economic conjuncture, ...).
These explanatory variables are not always available and their influences have various on sales (De Toni and
Meneghetti 2000). Besides, sales historic are often short and noisy.
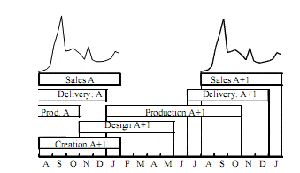
Figure 1 presents the creation, production and distribution planning of an autumn - winter item. It shows that
purchasing managers need to know, at the end of the season, sales forecasting of the future season to anticipate
the new production. To fit restocking predicted at mean-term, initial forecasting must be readjusted from the last
sales. Thus, textile field requires mean term (1 season) and short term (1 to 6 weeks) forecasting. In this paper, we
only present mean-term forecasting.

Figure1. Production planning of a autumn-winter textile item
The textile market also implies a number of items references growing, often renewed, with a life period increasingly short
(maximum 6 weeks). In this context, forecast requires a data aggregation (Figure 2), which allows to obtain an
exploitable history. In preceding works (Thomassey et al. 2001; Thomassey et al. 2002a), forecasts by items families
have been resolved by soft computing based methods.
We propose to determine a distribution method of the textile items sales from precedent forecasts accomplished
in the corresponding family. The suggested method is based on the achievement of a "life curve" performed by
items clusters. The final forecast is carried out from the total items forecast of the family and all "life curves" of
the items.

Figure 2. Different aggregation level of textile items
FORECASTING SYSTEM
General principle
The proposed method, which carries out mean-term sales forecasting of new items, is composed of two stages :
classification of historical items which allows to perform a "life curve" for each item of a family,
distribution of the total forecast of the family on each item.
Hypotheses are the following : sales items until season A and mean term forecasting of season A+1 are known.
Items classification
The most of items are renewed at each season and thus, no historical sales data are available. In this context, times
series forecasting models become unsuitable. The proposed solution is based on the classification of items of each
family according to different criteria. The effectiveness of classification for forecasting has been already validated
(Daneshdoost et al. 1998; Fokianos and Kedem 1998) and particularly in textile sales (Boussu 1998; Happiette et al.
1996). The aim is to obtain clusters of items, which hold the same behavior in terms of sales. The main difficulty is
the choice of significant and available criteria. According to experts, qualitative criteria like style, material,..., seem
the most appropriate. However in our context, these data are rarely accessible (Vroman, 2000). The only knew
criteria for new items are : period of sales, price, number of deal store and number of different color.
The classification procedure is based on hierarchical method (Bellman et al. 1996; Rham 1980) and composed
of two phases : classification of historical items and attribution of new items to clusters.
The optimal cluster number is selected through the following validity criterion S (Xie et Beni 1995) :
with :
c = cluster number
n = item number

ak = center of cluster k
xi = item i
d min = minimum distance between cluster centers
µ ik = membership degree to cluster k of item i (µ ik = 0 or 1 with hierarchical classification).
The applied distance is the Euclidean distance.
A life curve of each cluster is performed from the life curve of all historical items included in the corresponding
cluster.
Each new item is attributed to the cluster whose the center is the nearest in term of Euclidean distance. The estimate
life curve of a new item is then the life curve of his attributed cluster, adjusted to his sales period.
Distribution model (IDAIC)
This model called IDAIC (Items forecasting model by Distribution of Aggregated forecast and Items
Classification) performs mean-term forecasts from aggregated sales forecasting and items life curve. A
historical items classification is performed upstream of the IDAIC model ; it allows to achieve a specific life curve for
each new item. For each family, the predicted distribution of the total items sales is then given from the combination
of the "life curves" of each item on their respective life period.

Figure 3. IDAIC principle
For example at period t, consider only two items i and j of
a family (figure 3). Their respective life curve (lci and lcj) gives the life curve coefficient: ci and cj. Q is the predicted
sales quantity [11] for the family at period t. Then, the sales forecasting of item i is traduced by the following
relation: 
EXPERIMENTATION
Forecasting evaluation
The applied criterion is the Median Absolute Percentage Error (MdAPE), which is recommended to compare
forecasting models when numerous times series are available (Armstrong 2001).
The APEn of the n-th series is defined as:

MdAPE is observation (S+1)/2, if S is odd, or the mean of observations (S/2 and S/2+1) if S is even, where the
observations are rank-ordered APEn and S is the number of considered series. The lower this criterion is, the
more accurate the model.
Sales data
Models are tested on historic of women T-shirt family composed of 143 items of an important ready to wear
French distributor. These historic are composed of three years. The learning process is carried out on the two first
seasons (108 items). The simulation is realized on the third season (35 items).
Comparison with classical models
Due to the specificity of the context, it is difficult to compare our models with classical ones. However, we
propose and test the following solutions : a Basic Distribution (BD) of aggregated sales forecasting
according to the number of items of the family , the IDA model (IDAIC without classification) (Thomassey et al.
2002b) with mean life curve and IDAIC model with life curve obtained by classification.
Results

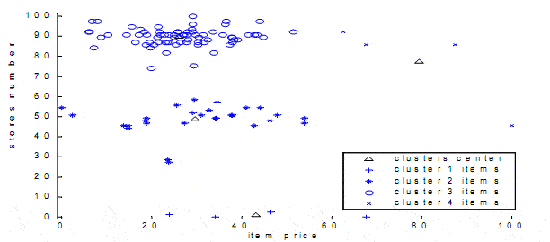
Figure 4. Four obtained clusters and their center according to item price and stores number

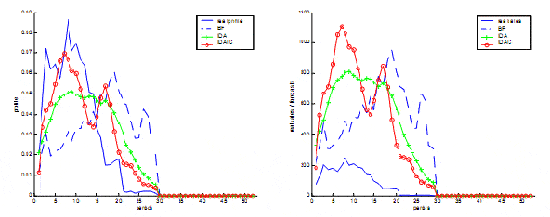
Figure 5. Example of estimated profiles and forecasting sales
Models evaluations on 35 items of a same family are presented in table 1. The horizon applied is one season.
Selected criteria for classification are the item price and the number of stores, which deal the item.
Figure 4 shows the four obtained clusters and their center according to these two criteria.
Figure 5 relates an example of estimated profiles and sales forecasting of three tested systems.
IDAIC and IDA models appear particularly more efficient than BF model in term of MdAPE criterion
(table 1). Estimated profiles are more accurate with a classification procedure upstream the forecasting
process (figure 5). Indeed, results obtained with IDAIC model are slightly better than IDA model
(table 1). However, the quantities forecasts are sometimes imprecise, and thus decrease the final
prediction accuracy (figure 5).
Table 1. MdAPE criterion of mean-term forecasting sales of 35 items
| Model | BF | IDA | IDAIC |
| MdAPE | 670 | 353 | 341 |
CONCLUSION
In order to answer to requirements of the textile field, the proposed system allows to obtain mean-
term sales item forecasting. The use of classification procedure allows in the specific
environment of the textile market, to increase the accuracy of sales forecasting for new items. The
proposed mean-term forecasting model, distributes forecasts realized on aggregated sales according to
life curve of each items belonging to considered family. However, if the classification increases the
accuracy of the life curves, the estimated quantities still sometimes imprecise. These results must be
generalized on larger number of items families and eventually with others pertinent classification
criteria. The use of more pertinent criteria should add more efficiency to the classification procedure,
but data obtaining are always problematic in textile context (Vroman 2000).
REFERENCES
Armstrong, J.S. 2001. Principles of forecasting - A handbook for researchers and practitioners. Norwell, MA : Kluwer Academic
Publishers.
Bellman, R.; R. Kalaba and L.A. Zadeh. 1996. "Abstraction and pattern classification". Journal of Mathematic Analysis
and Application, Vol. 2, 581-586.
Boussu, F. 1998. Simulation de la filiere Textile/Habillement/Distribution : reduction de la complexite en vue d'une
meilleure prevision des ventes. These de l'Universite des Sciences et Technologies de Lille I.
Daneshdoost, M.; M. Lotfalian; G. Bumroonggit and J.P. Ngoy. 1998. "Neural network with fuzzy set-based classification for short-term
load forecasting". IEEE transactions on power systems, Vol. 13, No.4, 1386-1391.
De Toni, A. and A. Meneghetti. 2000. "The production planning process for a network of firms in the textile - apparel industry"
International Journal of Production Economics, Vol. 65, 17-32.
Fokianos, K. and B. Kedem. 1998. "Prediction and classification of non-stationary categorical time series". Journal of
multivariate analysis, Vol. 67, No.2, 277-296.
Happiette, M.; B. Rabenasolo and F. Boussu. 1996. "Sales partition for forecasting into textile distribution network".
IEEE Conference on Systems, Man, and Cyberneticss (Beijing, China, Oct.14-17), Vol. 4, 2868-2873.
Kincade, D.H.; N. Cassill and N. Williamson. 1993. "The Quick Response Management System: Structure and Components for the Apparel
Industry". Journal of the Textile Institute, Vol. 84, No.2, 147-155.
Rham, C. 1980. "La classification hierarchique ascendante selon la methode des voisins reciproques". Les cahiers de
l'analyse des donnees, Vol. 5, 135-144.
Sboui, S.; B. Rabenasolo; A.M. Jolly-Desodt and N. Dewaelle. 2001. "Optimisation dynamique de la taille des lots d'approvisionnement:
application a la filiere textile". MOSIM'01 (Troyes, France, Apr.25-27), 551-558.
Thomassey, S.; P. Vroman; M. Happiette and J.M. Castelain. 2001. "A Comparative Test of New Mean-Term Forecasting Models Adapted
to Textile Items Sales". Studies in Informatics and Control, Vol. 10, No. 3, 209-225.
Thomassey, S.; M. Happiette and J.M. Castelain. 2002. "A short term forecasting system adapted to textile distribution". IPMU 2002
(Annecy, France, Jul.8-9), 1889-1893.
Thomassey, S.; M. Happiette and J.M. Castelain. 2002. "Three complementary sales forecasting models for textile distributors".
accepted to IEEE Conference SMC 2002 (Hammamet, Tunisia, Oct. 6-9).
Vroman, P. 2000. Prediction des series temporelles en milieu incertain : application a la prevision des ventes dans la
distribution textile. These de l'Universite des Sciences et Technologies de Lille I.
Xie, X.L. and A. Beni. 1995. "A validity measure for fuzzy clustering". IEEE Transactions on Pattern Analysis and Machine
Intelligence, Vol. 13, No. 8, 841-847.