Automatic Analysis of Acoustic Emission Signals
G. Vargas, S. I. Isaacson, C. E. D'Attellis
Facultad de Ingeniería, Universidad de Buenos Aires
Paseo Colón 850, 1063-Buenos Aires, Argentina.
E-mail: sisaacs@tron.fi.uba.ar
J. Ruzzante, I. López Pumarega
Centro Atómico Constituyentes - C.N.E.A.
Av.Gral. Paz 1499, 1650-San Martín, Buenos Aires, Argentina.
R. Piotrkowski
Escuela de Ciencia y Tecnología
Universidad Nac. de Gral. San Martín, Buenos Aires, Argentina.
Source of information: 15th World Conference on NDT - 2000 - Rome (Italy) 2000-11 [Electronic resource] / NDT.net resource center, - access mode: http://www.ndt.net/article/wcndt00/papers/idn483/idn483.htm
Abstract
The main problem in the analysis of acoustic emission signals is the estimation of the time of occurrence and amplitude of bursts. This work deals with the first mentioned problem.
The estimation of the time of burst occurrence is realized using an algorithm based on multiresolution analysis and compared with another technique based on Kalman filter. ([2],[4]). In the multiresolution analysis the signal is decomposed in frequency levels (bands), and its fundamental frequencies are detected using only a few levels, while the use of Kalman filtering technique as estimators is based on a dynamical model of the signal. In both methods the algorithms are implemented by means of digital filters, useful for on-line implementation. We describe and discusse some results obtained on experimental signals with different separation of bursts, between 15.6 ms and 50 ms.
Introduction
The acoustic emission ( AE) signal processing is an important tool for the detection and characterization of failures in the framework of non-destructive testing.
The A.E. signals are non stationary and they consist of overlapping bursts with unknown amplitude and arrival time. The main problem in the A.E signal analysis is the estimation of these parameters, allowing the prevention of failures and tool wear.
Several techniques have been applied in order to solve the problem of computer assisted detection of the amplitude and time arrival of the burst:
- Modelizing the signal ([2],[3],[4],[8]) .
- Using a method based on Gabor Transform ([1]).
- Using neural-networks ([14],[15],[16]).
- Using Wavelet Transform ([5],[6],[7]).
In this work we introduce an approach to detect the time of burst occurrence. We use a method based in multiresolution analysis and compare its performance with another technique based on Kalman filtering. In the first case no model is necessary but the signal must be analized by intervals. In the other case a model of the signal is used, but the estimation is more easily implemented on line than the first.
The Kalman filtering technique as estimator
The use of Kalman filter requires the modelization of the AE signal. These signal can be described by means a of a series of wavetrains with the same form and different amplitude varying the time of occurrence, by the expression:
 |
(1) |
 |
(2) |
where ai is the amplitude and ti the time of ocurrence for the i-th burst; fk are the resonance frequencies of the transducer and tk are the characteristic decay times ([2],[4]).
The continuous model for the AE signal is:
 |
(3) |
where U(t) is a train of impulses Poisson distributed with random amplitudes ai, independent of the random variable ti([8]):
 |
The first component of the vector state  is the solution of the differential equation used for the estimation of the time occurence of the burst, and the AE signal ([2],[4]) may be considered as the solution Y(t).
As the analysis is implemented in a digital framework, we discretize the above model, obtaining:
 |
(4) |
The Wavelet Technique
If y(t) is a wavelet function with scale function f(t), for a given signal g(t) the wavelet decomposition is ([10],[1l],[12]):
 |
(5) |
4where {dj(k), j = 1... J ; k Î Z} are the wavelet coefficients containing the information about the highest frequencies of the signal, and the sequence {cJ(k), k Î Z} represents the coarser resolution signal at level J.
The multiresolution analysis provides a frequential analysis of the signal with good temporal information: the signal is decomposed in frequency bands and, since a dyadic decomposition of the range of frequencies is used, distributing the wavelet coefficients along 2j points:
 |
we build, in each resolution level, a new signal that contains a frequential band of the original signal characterizing its local features.
We look for the times of bursts occurrence. These times correspond to jumps in the signal and are reflected in local extrema of the wavelet coefficients at the frequency bands of the bursts.
For a more efficient localization of these extrema we consider N-th powers (N ³ 2) of the wavelet coefficient (dj(k))N emphasizing in this form the times of abrupt changes of the signal.
Following [9] and [12] we use a fast recursive scheme to obtain the coefficients.
Simulations
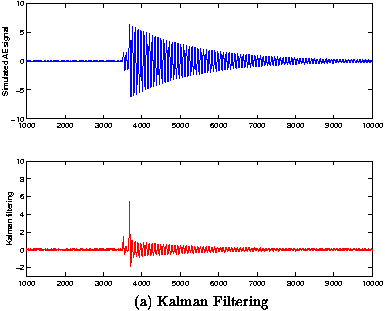
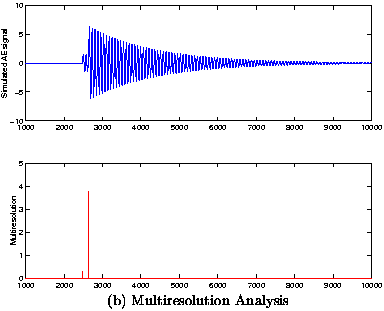
In order to evaluate the behavior of the algorithms based on Kalman filters and multiresolution analysis, a signal corresponding to the Mitrakovic model was generated.
The parameters of the model were adapted in such a way that the error between the simulated signal and a signal obtained in the laboratory was minimum. The input to the system was a signal composed by two impulses in t1 = 350ms and t2 = 366ms and a constant t = 172.1ms. The intensity of the white noise was obtained from measurements: R = 0.0029.
Figure 1 (a) and (b) show the signal obtained using a unique resonance frequency for the sensor, fo = 135kHz and the results obtained using the proposed methods.
|
|
| Fig 1: (a)Computer simulation of AE signal composed by two bursts at t1 = 350ms and t2 = 366 ms with resonance frequency fo = 135kHz. Estimation by Kalman filtering of the burst occurrence. (b) Computer simulation of AE signal composed by two bursts at t1 = 350ms and t2 = 366ms with resonance frequency fo = 135kHz, Estimation by multiresolution analysis of the burst occurrence. |
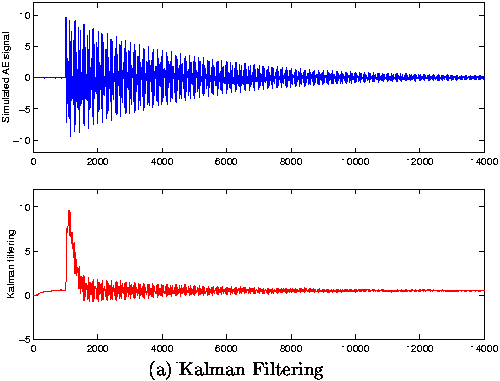
Figures 2 (a) and (b) show the signal generated with two frequencies f1 = 180kHz, f2 = 250kHz and the results obtained using the proposed methods.
 |
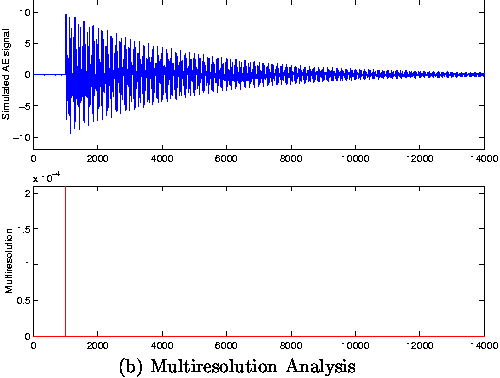 |
| Fig 2: (a)Computer simulation of AE signal composed by one burst at t1 = 970ms with resonance frequencies fo = 180kHz; f1 = 250kHz. Estimation by Kalman filtering of the burst occurrence. (b) Computer simulation of AE signal composed by one burst at t1 = 970ms with resonance frequencies fo = 180kHz and f1 = 250kHz, Estimation by multiresolution analysis of the burst occurrence . |
Experimental case
The AE signal was obtained using a piezoelectrical crystal fed by a square wave coming from a pulse generator. Each wave generates a burst in a steel plate. The signal detection was made using a piezoelectric sensor WD:SN42 with 200 - 800kHz as range of frequencies. The signal was amplified 40-45 dB and digitalized using an A/D converter 25 MHz 8-bits.
Results
We analyze twenty experimental AE signals, with burst separations between 15, 6ms and 5Oms. We show some of the results obtained.
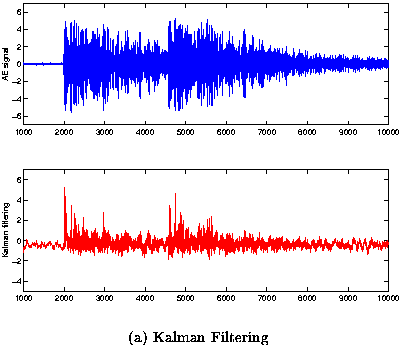
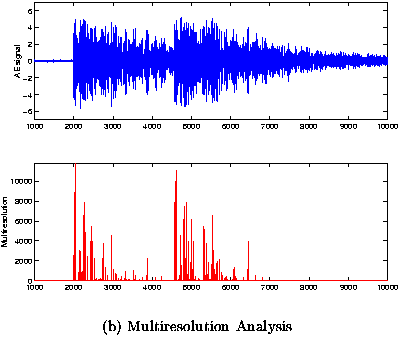
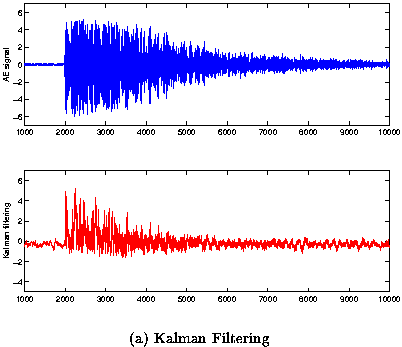
Figure 3 (a) and (b), Figure 4 (a) and (b) and Figure 5 (a) and (b) show signals obtained from the experiments described previously and the Kalman filtering and multiresolution analysis (based on Cubic Spline and Haar) respectively.
|
|
| Fig 3: (a) Experimental AE signal with burst separation Dt = 2.56ms and Kalman filtering estimation of time of occurence. We can see two pulses located approximately at t1 = 2015ms and t2 = 4740ms. (b) Experimental AE signal with burst separation Dt = 2.56ms and Multiresolution of time of occurence detected approximately at t1 = 2173ms and t2 = 4745ms. |
According to the power spectrum of figure 6, the frequencies components of the signals are in the band 125kHz - 250kHz. The frequencies between 90 and 100kHz can be interpreted as corresponding to the measurement equipment.
 |
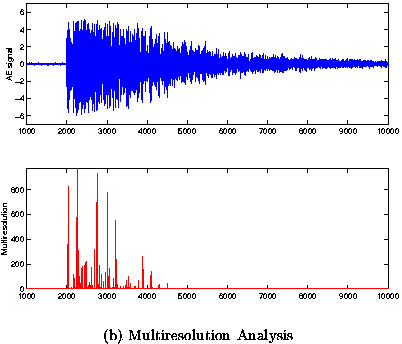 |
| Fig 4: (a) Experimental AE signal with burst separation Dt = 190mS and Kalman filtering estimation of time of occurence. We can see two pulses located approximately at t1 = 2015ms and t2 = 2230ms. (b) Experimental AE signal with burst separation Dt = 190ms and multiresolution of time of occurence detected approximately at t1 = 2035ms and t2 = 2267ms. |
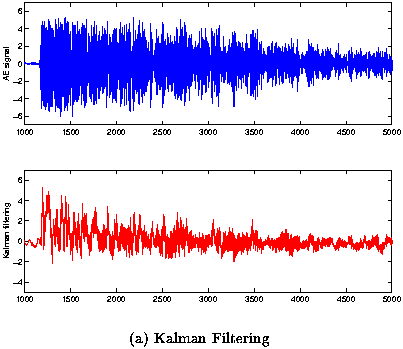 |
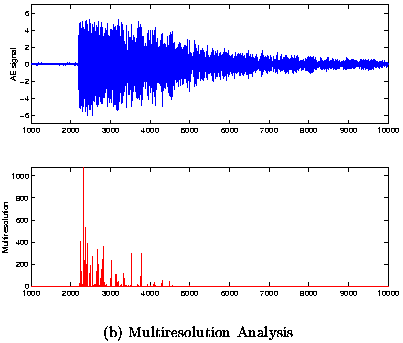 |
| Fig 5: (a) Experimental AE signal with burst separation Dt = 50ms and Kalman filtering estimation of time of occurence. We can see two pulses located approximately at t1 = 2465ms and t2 = 2497ms. (b) Experimental AE signal with burst separation Dt = 50ms and multiresolution of time of occurence detected approximately at t1 = 2249ms and t2 = 2313ms. |
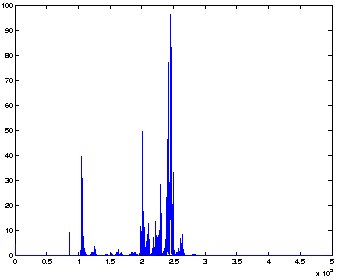 Fig 6: Power spectrum of the experimental AE signal
 |
Conclusions
Despite the easy implementation of the Kalman filters, the drawbacks presented by the use of Kalman filter as estimators are:
- high sensitivity with respect to the paramenters of the model
- high order of the system when different frequencies are considered or the rise-time is not zero.
The multiresolution analysis is implemented by a filter bank. As the spectral analysis has demonstrated, the two first levels of the multiresolution contain all the necessary information about the signal.
The cubic spline based multiresolution satisfy one of our objectives: a window with optimal localization in the time-frequency domain. Despite the corresponding filters are IIR filters, the fast convergence to zero of the impulse response allows the use of FIR filters. The length of the filters is about 80 points.
In that sense, the Haar filter is easier to implement than any other one, since it involves only two points. The estimations obtained with a Haar multiresolution are shown in Figures 3 (b).
The detection, by both methods, losses neatness when the bursts are very close. In this case, the bursts are mixed with the wave reflections on the steel plate. Despite this fact, the multiresolution analysis gives in this case a neater detection as shown in figure 7.
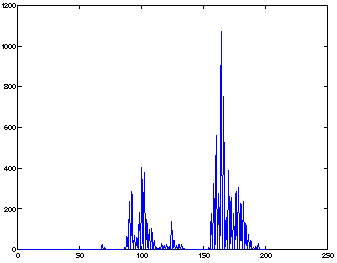 Fig 7: Zoom in, between t = 2150ms and t = 3150ms, of the detection in figure 5 (b). We see two bursts approximately at 100 (i.e. t = 2250ms) and 170(i.e t=2320 ms). There are also some other peaks, perhaps due to reflections
 |
References
- B. Frielander and B. Porat: " Detection of transient signals by Gabor representation"; IEEE Trans Acousr Speech Signal Processing, Vol 37, 2, pp 169-180, 1989.
- C.E. D'Attellis, L.V. Pérez, D.Rubio and J.E.Ruzzante: "Parameter estimation in acoustic emission signals", Journal of Acoustic Emission, Vol. 10 nro.3/4, 1992.
- C.E. D'Attellis, L.V. Pérez, D.Rubio and J.E.Ruzzante: "A bank of Kalman filters for fairlure detection using acoustic emission signals", Non-Destructive Testing "92", C Hallai and P. Kulcsar (Editors), pp 29-33, Elsevier Pub, 1992.
- L.V. Pérez, G.E. D'Attellls and J.E.Ruzzante: "A model for acoustic emission signals and burst occurrence estimation", The British Institute of Non-Destructive Testing, INSIGHT vol 39, 2 1997.
- E.P. Serrano and M. Fabjo:" Application of wavelet transform to acoustic emission signal processing"; IEEE Tras. Signal Processing, Vol 44, 5, pp 1270-1275, 1996.
- Oh-Yang Kwon and Young-Chan Joo: "Source location in Highly Dispersive Media by Wavelet Transform of Acoustic Emission signal", Journal of Acoustic Emission , Vol 15, 1-4, pp si-slO, 1997.
- H.Suznki, T. Kinjo, Y. Hayashi, M.Takemoto and K. Ono: " Wavelet Transform of AE signals", Journal of AE, Vol 14 nro. 2, pp69-84, 1996.
- D. Mitrakovic, I. Grave and S. Sedmak : "Simulation of AE signals and signal analysis system"; Ultrasonic, Vol 23, pp 227-232, 1985.
- S. Mallat: "A Theory for multiresolution signal decomposition: the wavelet representation"; IEEE Pattern Anal. and Machine Intell., vol 11 nro. 7 pp 674-693, 1989.
- I.Daubechies: "Ten Lectures on Wavelets". SIAM, Philadelphia USA, 1992.
- Chui C.K.: "An Introduction to Wavelets". San Diego: Academic Press, 1992.
- Unser M., Aidroubi A., Eden M.: "A family of polinomial spline wavelet transforms"; Signal Processing, Vol. 30, pp 141-162, 1993.
- S.G. Mallat :" Multirresolution approximations and wavelets orthogonal bases of L2(R)"; 1.Yans. Amer. Math. Soc., Vol. 135, pp. 69-87, 1989.
- V. Venkatesh and J.R. Hoghton:"Neural Network Approach to AE Source Location" ;Journal of acoustic Emission, Vol 14, nro.2,pp 61-68, 1996.
- S Jha and T. Durrani: "Direction of Arrival Estimation Using Artificial Neural Networks"; IEEE Trans on System, Man and Cybernetics, Vol 21, nro.5, 1991.
- 5. Keyvan and J. Nagaraj: "Pattern Recognition of AE signatures using ART2-A Neural-Network"; Journal of Acoustic Eipission, vol 14 nro.2 pp 97-102, 1996.