Phase-Locked Loop / H.R.Pota.
1. Introduction
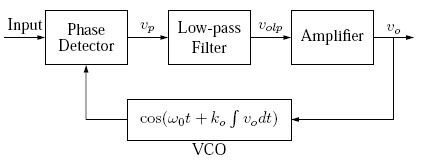
Phase-locked loop (PLL) is a feedback loop which locks two waveforms with same frequency but shifted in phase. The funda¬mental use of this loop is in comparing frequencies of two waveforms and then adjusting the frequency of the waveform in the loop to equal the input waveform frequency. A block diagram of the PLL is shown in Figure 1. The heart of the PLL is a phase comparator which along with a voltage controlled oscillator (VCO), a filter and an amplifier forms the loop. If the two frequen¬cies are different the output of the phase comparator varies and changes the input to the VCO to make its output frequency equal to the input waveform frequency. The locking of the two frequencies is a nonlinear process but linear approximation can be used to analyze PLL dynamics.
In getting the PLL to lock the proper selection of the filter is essential and it needs some attention. If the filter design is understood from control theory point-of-view then the design becomes quite simple. In this short note we will discuss only the fundamentals of the PLL and how you can use nonlinear simulation and linearised approximation to get a better understanding of the PLL.
1.1. Multiplier as Phase Comparator
Modern PLLs have digital phase comparator but there are PLLs with analog phase comparators too. They are made up of a simple multiplier and a low-pass filter. The output of the multiplier is made up of two periodic waveforms—one has the frequency of the difference of the frequencies of the two input sinusoid and the other wave’s frequency is their sum. The former is obtained by passing the output of the multiplier through a low-pass filter.
Let the input to the multiplier be vimsin(ωit) and vomcos(ωot + φ(t)) then the output voltage vp is
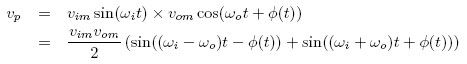
This output vp is passed through a low-pass filter and if the two frequencies ωi and ω0 are close together then the output of the filter is a function of the phase difference between the two input waveforms given by
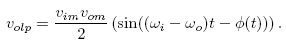
The output volp is a function of the instantaneous phase difference (ωit - (ωot + φ(t))) between the two waveforms.
1.2. The Locking Action
To understand the locking mechanism it’s best to do simulations and plot signals at different points in the loop. The simulation is discussed in Section 3. Here we give a plausible explanation of how the PLL locks.
Let’s look at the output of the low-pass filter volp (Figure 1) as given by equation (2) and consider that φ(t) = 0 and ωi > ω0. For a short while this will result in a positive value of volp. This positive value will increase the output frequency of the VCO bringing ωi and ω0 closer. Since the output volp is a sinusoid after its phase value exceeds 180 degrees ((ωi - ω0)t > π) things will go the wrong way around but since the difference between the two frequencies is lesser it will not pull the two frequencies as much apart as brought together during the time the phase was less than 180 degrees. This cycle will repeat and in every cycle the two frequencies will keep coming closer together and finally they will lock. A symmetrical cycle starting with a negative value for volp will pull the two frequencies together when ωi < ω0.
From equation (2) we see that if ωi is equal to the free running VCO frequency then the output of the low-pass filter should be zero. This means φ(t) in equation (2) should be zero. What if the output of the VCO is vom sin(ω0 + φ(t)) instead of the cos function as in equation (2)? Then for the PLL to lock when the input frequency is equal to the free running VCO frequency, the phase difference φ(t) between the two waves has to be 90 degrees. Why?
2. Linearised PLL
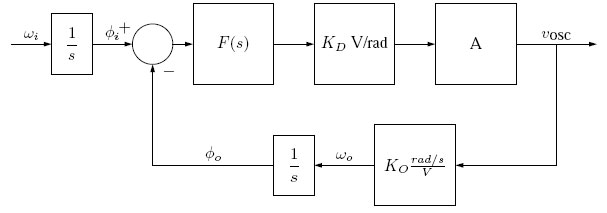
To analyse the behaviour of a PLL we can linearise it about the locking frequency obtained with zero input voltage to the VCO. This frequency is also known as free running frequency of the VCO. The linear model then only deals with the change in frequencies about this lock frequency.
The linear approximation to the PLL is shown in Figure 2. The block F(s) in Figure 2 is the low-pass filter to get a signal proportional to the difference in frequency (and phase) of the two waveforms. Looking from the phase comparator point-of-view, the output of the multiplier and low-pass filter is a signal equal to the sine of the phase difference between the two input signals. So our linear approximation is valid only when the phase difference is small.
To analyse the PLL in Figure 2, let’s write the transfer function
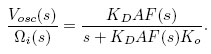
For

2.1. Lock Range
Let the VCO output frequency be ω0 for zero input voltage. We need to know what is the range of input signal frequencies for which the output will lock and this range is called the lock range of the PLL.
To calculate the lock range we need to know the phase difference for which the phase comparator works. Some phase comparators work for only a 90 degree range and there are others which work for a full 360 degrees. Some PLL schemes do frequency dividing and thereby enable a comparison over very large phase range. For the digital phase comparator discussed later, the input phase range is 90 degrees. In this case the lock range is

This is the maximum frequency variation that can be had within the loop.
2.2. Filter Design
For a simple low-pass filter F(s), it can be seen that the second-order closed-loop system will have underdamped poles if KDAKo is large and ω1 small. A quick root-locus sketch should clarify this point. We need large KDAKo for a large lock range but that makes the system underdamped. One solution is to have a zero in the filter F(s) which damps the system.
For practical reasons of attenuating the out of bandwidth signals, the cut-off frequency of the low-pass filter is kept as low as possible (this may vary with different applications). A low cut-off and a high KDAKo results in underdamped response which can be improved by using a compensating network as shown in the simulink implementation next.