Abstract of Master's thesis
«Development and research of debugging tools
for Microsoft Windows kernel mode»
Introducing
Debugging is a process of identifying and eliminating causes of errors in the software. In some projects, debugging takes up to 50% of the total development time. Many experts believe that debugging is the most difficult aspect of programming [1].
Beginning with the introduction of mainframe computers (in particular, during the introduction of IBM System/360 clone called ES EVM) and until today tools for preparation and debugging programs haven't been given sufficient attention. Moreover, often possibility itself of mistake appearance has been refused and it has put programmers in severe conditions. As a result, it has led to an extremely inefficient use of the computer. At the moment, debugging is an integral part of software development life cycle.
Debugging can be greatly simplified by using specialized tools which constantly being improved. The main such tool is a debugger that allows you to control execution of software, monitor its progress and force in it.
Application software development tools offer the programmer a wide range of possibilities. Any integrated development environment includes debug capabilities without necessity of using third party tools. If we are talking about system software and driver development in particular, development process is extremely difficult and few automated by virtue of its specific. All phases of development, including debugging, are separate. Each phase requires specific conditions: writing software code is performed on a full-fledged computer system, debugging is performed on debug system, testing — depending on the situation and so on. The kernel mode debugger itself is more difficult to learn and therefore less friendly.
In general we can talk about lack of kernel debug tools. Although such tools are available, often there are no alternatives. Many programmers say about the negative experience on first acquaintance with kernel-mode debuggers.
In general we can talk about lack of kernel debug tools. Although such tools are available, often there are no alternatives. Many programmers say about the negative experience on first acquaintance with kernel-mode debuggers.
Problem analysis
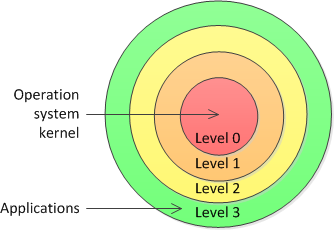
Many modern processor architectures such as Intel x86 and its extensions provide a protective mechanism that operates at the level of segments and memory pages. This mechanism enables the hardware to restrict access to certain segments or pages based on privilege level. It allows the operating system to protect its critical code and data by placing them in more privileged segments than the application code. Protective mechanism Intel x86 processor family operates four levels of privilege, also known as rings (figure 1). The processor uses privilege levels to prevent a code operating at a lesser privilege level from accessing a segment with a greater privilege, except under controlled situations [2].

Figure 1. Privilege levels of Intel x86 family processor
To prevent application access to critical system data and data from other applications, Microsoft Windows operating system relies on the protective mechanism of the processor. It uses only two levels of privilege: lowest and highest called user mode and kernel mode, respectively. Executable application code runs in user mode, while the operating system code — in kernel mode. A kernel-mode provides access to all memory space and allows execution of any processor instruction, whereas user-mode code must address to the operating system services to perform all critical operations.
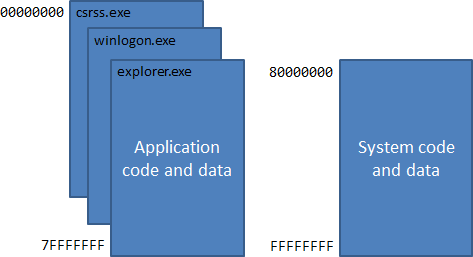
Microsoft Windows is a multitasking operating system. By virtue of processor segmentation mode each task (process) obtains its own linear virtual memory address space of 2 GB. The same virtual address is mapped in different physical addresses for each process, so the process can not damage the memory space of another process, either accidentally or intentionally. At the same time, the memory space used by the operating system is shared by all processes (but only code that runs in kernel mode has access to it) (figure 2).

Figure 2. The structure of the virtual address space
Based on the structure of virtual address space if there is a mistake in application due to which the application writes data to arbitrary memory location, the application will only hurt its own memory and will not affect other applications and operating systems. While kernel-mode code is able to damage the important data structures of the operating system and this will bring to a system failure.
The kernel-mode components of Windows include the following: hardware abstraction level, kernel itself, kernel subsystems that implement memory management, power management, scheduling of CPU time, etc., and also device drivers. Typically, all components except the drivers are part of the operating system because their self-development is very difficult whereas device drivers implement the interface between the hardware and kernel subsystems. Due to variety of equipment produced in the whole world practically each device connected to the ports of the computer requires its own driver. Therefore, debugging the kernel is mostly used by developers of drivers [3].
Goals and objectives
The ultimate goal is a creation of own kernel-mode debugger which should simplify the process of debugging and reduce the learning curve. For achieving this goal developed debugger must have a modern friendly graphical user interface. At this moment graphics subsystem Windows Presentation Foundation (WPF) included in Microsoft .NET Framework beginning from version 3.0 answers such user interface design requirements most of all.
-
Thereby implementation of next objectives is necessary for debugger’s creation:
- kernel debugging complexity analysis;
- existing solutions analysis;
- studying of hardware debug engine of Intel x86 processor architecture;
- exploring of debug engines provided by Windows kernel;
- exploring of Windows Debugger functional capabilities;
- studying of Windows Debugger extension method specification;
- debug system software development;
- debug application software development.
Review of research and development
Basic debug tools for kernel mode debugging are provided by Windows operation system manufacturer itself within the bounds of free redistributable package "Debugging Tools for Windows". Tools include GUI and character-based debuggers WinDbg and Kd, respectively (hereinafter referred to as Windows Debugger). The work of these debuggers based on the mechanisms provided by the developers of the operating system and incorporated in its kernel [4].
The main mode for Windows Debugger is a command interpreter mode. By virtue of module structure Windows Debuggers supports third party modules called extensions side by side with native commands. In fact most of build-in commands are also executed in the form of extensions.
Windows Debugger is focused on remote interactive and postmortem debugging, their using reveals all it possibilities. At the same time full-fledged local interactive debugging is not supported: debugger allows viewing of some kernel structures only.
There is an extension module for Windows Debugger called LiveKD. It was created by Mark Russinovich and it in some ways implements possibility of local interactive debugging. LiveKD creates memory dump of working system on the fly and uses it for debugging [5].
Windows Debugger uses Microsoft debugger engine which give an opportunity to manipulate the target system [6]. In Microsoft CodePlex community there is a project of managed library for interaction with Microsoft Debugger Engine API [7]. Its author is Nicolae Mogoreanu. Within the bounds of this project two sets of classes are provided: the first one is easier to use for people familiar with Debugger Engine API and the second one more corresponds to the .NET style. Library gives an opportunity to extract information from memory dumps and from running application memory. But this project doesn't allow to produce a kernel mode debugging, because it is focused on user mode debugging.
Package "Debugging Tools for Windows" updates regularly and supports all modern Windows operation systems.
SoftICE kernel debugger released by Compuware Company as a part of DriverStudio package traditionally was alternative to package "Debugging Tools for Windows". A distinctive feature of SoftICE is the implementation of a local interactive debugging on the supported hardware. The debugger was almost completely able to control the operating system.
On April 3, 2006 sales of products of the family "DriverStudio" were discontinued due to "a set of technical and business issues, as well as general market conditions". The latest version of the operating system, whose support was implemented, is Windows XP Service Pack 2. Typically, service packs do not change the application interface of the operating system, but the number of system calls and other undocumented information may change. SoftICE debugger relied on hard-prescribed addresses of internal data structures. As a result, with the release of Service Pack 3 compatibility has been broken. Obviously, the later versions of Windows are not supported too.
Syser Kernel Debugger has been created a small Chinese company Sysersoft as a replacement for the SoftICE debugger. The first final version was released in 2007. As SoftICE, Syser Kernel Debugger is able to perform interactive debugging of a running system. Only 32-bit editions of the modern Windows operation system versions are supported [8].
Breakpoints Live Company specializes in solutions for debugging, both user mode and kernel mode. Interactive debugger DebugLive Debugger has a web-based friendly interface which should reduce the learning curve and make debugging process easier [9]. The debugger does not implement its own debug stack and uses Microsoft Debugger Engine.
Dmitry Vostokov is a Microsoft Certified Technology Specialist. Since 2003 he has been working in Citrix where he explores features of a kernel-mode debugging. Dmitry Vostokov is also an author of several books on this subject [10].
At this moment Windows Debugger is an essential tool among developers of kernel modules. Windows core team also uses it.
As search showed there are basically no researchers dealing with Windows kernel debugging in Ukraine. In the matter of Donetsk national technical university then number of authors in their articles covers topics related to kernel mode.
Results
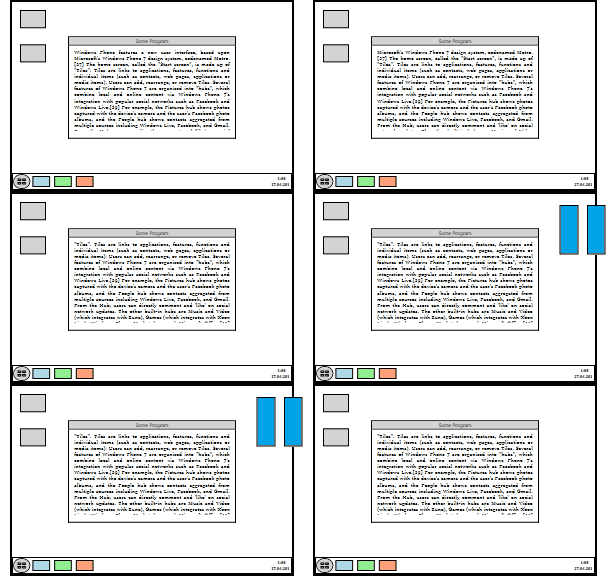
Windows Debugger based on a dynamic-link library DbgEng.dll, which is an operating system debugging engine and gives the opportunity to manipulate the target system (figure 3). In turn, a debug engine uses an auxiliary debugging library DbgHelp.dll. Both libraries are included in the modern versions of Windows.

Figure 3. Suspending the remote system on demand
(animation, 8 frames, 6 times, 18 kB)
Interaction with the debug engine is implemented by the COM technology (Component Object Model). Assembly that encapsulates work with COM-objects accordantly with described pattern is required for work with debug engine from managed code. Such assembly is called the interoperation assembly. Microsoft Corporation doesn't supply an interoperation assembly with Windows debugging engine. Therefore, the interfaces were described manually, although this way is tedious and predispose to errors.
-
All the described interfaces are internal to the assembly and are not visible outside it. Instead, instances of COM-objects that implement these interfaces are private members of high-level classes and are created inside them. It abstracts the programmer from the COM-interaction issues, and allows him to focus on the using of the assembly's functionality. In general, the following methods were used to describe high-level classes:
- methods GetX and SetX were replaced by single read/write property;
- methods that have different names due to the impossibility of overloading are reduced to the single name;
- structures, containing overhead information, such as line size or number of array elements, replaced by a simplified version, because for managed code this information is redundant;
- in case of need to invoke method repeatedly with index as a parameter collections were used;
- unsigned integers if possible were replaced by signed integers to comply with Common Type System that allows to use the assembly in managed languages that do not support unsigned integers, such as VB.NET;
- callback interfaces intended to notify the program about changes in kernel engine were implemented by the private subclasses, which call the appropriate language event handlers;
- method names are adjusted to the naming rules.
Conclusion
-
At this moment following features have been implemented in an interoperation library:
- connection to the remote system;
- suspending and resuming the remote system on demand;
- receiving notifications of events (changing of registers and memory, occurrence of exceptions and interrupts, etc.);
- viewing and modifying all processor registers (including system registers).
Created assembly simplifies the interaction with the debug engine and is the basis for building the kernel debugger with a rich graphical interface. In addition to its main purpose, the assembly can be used in Windows PowerShell scripts that will automate some of the debugging operations.
References
- McConnell, Steve. Code Complete, Second edition. Microsoft Press, 2004.
- Intel Corporation. Intel 64 and IA-32 Architectures Software Developer's Manual. Volume 3A: System Programming Guide, Part 1, 2010. http://developer.intel.com/design/processor/manuals/253668.pdf
- Russinovich, Mark; Solomon, David. Windows Internals, Fifth Edition. Microsoft Press, 2009.
- Microsoft Corporation. MSDN Library. Debugging Tools for Windows, 2010. http://msdn.microsoft.com/en-us/library/ff551063(v=vs.85).aspx
- Russinovich, Mark. Windows Sysinternals. LiveKd, 2010 http://technet.microsoft.com/en-us/sysinternals/bb897415
- Microsoft Corporation. MSDN Library. Debugger Engine and Extension APIs, 2010. http://msdn.microsoft.com/en-us/library/ff540525(v=vs.85).aspx
- Nicolae Mogoreanu. Managed Library for interacting with Debugger Tools for Windows Engine API, 2010. http://mdbglib.codeplex.com
- SyserSoft. Syser Kernel Debugger, 2011. http://www.sysersoft.com
- Breakpoints Live. Web based Debugging Software, 2011. — http://www.breakpoints.com
- Dmitry Vostokov. About, 2011. http://www.dumpanalysis.org/blog/index.php/about


