DonNTU   Masters' portal

Abstract

Содержание

Introduction

Among the basic sectors of Ukrainian economy, energy is dominant. Ukraine is the largest consumer and producer of energy. By electricity consumption Ukraine is second only to the most developed countries of the World: U.S., Russia, Japan and Canada.

Nowadays the potential power system of Ukraine is 44 thermal power plants (TPP), of which 14 large. In the Donetsk region, there are seven stations. The share of TPP in the total installed capacity of the industry in the period before 2030, will preserve at the level of 50-60%. The importance of these technological objects is obvious [8,9]

Water hammer is a sharp increase or decrease of pressure in the pressure pipe due to changes in the velocity of the fluid in it.

Accordin to experts, causes of accidents (pipe breaks) to the power station are:

- 55% hydraulic blows pressure drop and vibration;

- 25% – corrosion processes;;

- 20% – force majeure circumstances .

For a timely response to possible emergency situations (breaking lines) necessary to control the technological parameters of the pipeline system: flow and speed of fluid, pressure. The most critical of these is the water pressure.

1. Theme urgency

Currently, fuel and energy complex of Ukraine is going through a complex condition that is associated with the global crisis, low investments in the energy sector, the aging of power equipment. Sudden need for technical and technological renovation, upgrading and repair of production facilities and infrastructure of Ukrainian thermal power plant. Of the 14 Ukrainian thermal power plants, 7 were designed more than 50 years ago. Obviously, the thermal power plants (TPP) has long been worn out. An urgent task was to ensure their trouble-free operation.


2. Goal and tasks of the research

Develop, justify and investigate the structure of an electronic system that provides automated control of process parameters flowing in piping systes.

Main tasks of the research:

  1. Analysis methods for measuring water hammer in the piping system of thermal power plants.
  2. Development of a mathematical model for measuring the parameters of water hammer.
  3. Substantiation of structure of the channel pressure.
  4. Operational monitoring of operating modes of pipeline systems and forecasting of water hammer on the basis of the results obtained by methods of mathematical modeling.

Research object: pipeline system at the power station.
Research subject: control of process paramters (pressure, flow rate and fluid velocity) in the pipeline.

3. Calculation of water hammer anda review of research on this topic

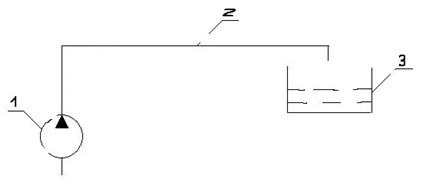
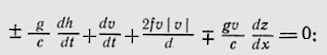
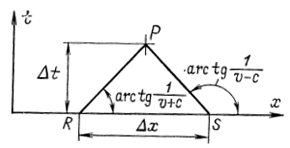
During the conducting research and calculations of water hammer, were formed by the factors on which it depends are: the length and type of pipe material and geometry of the tubes, transported medium, the variation of flow rate, etc. [5]. In order to take into account all the factors that affect the hydraulic impact, need to use the method of characteristics. The simplest hydraulic (pipeline) system is given by Figure 1.

Figure 1 - A simple diagram of the hydraulic system: 1 – pump, 2 – line 3 – reservoir.

Water hammer in pipelines caused by a rapid change in the rate of water movement and is accompanied by a large increase in pressure. In piping systems the most dangerous pressure oscillations arise if I get disconnected the pump unit. Example of water hammer is shown in Fig. 2.

                                     Figure 2 – Example of water hammer in the piping system when disconnecting the pump.                                                                               The animation parameters: an amount of frames – 8; size – 141 КВ; amount of repetition – 6 

To calculate the characteristics of water hammer need to use the fundamental equations of water hammer:


These equations are presented in characteristic form:


Using these equations and initial conditions was simulated hydraulic shock. The calculation method of characteristics, each section of the pipeline appears as a separate segment. In solving the equations above, it is easy to find the pressure and velocity in terms of Δt, the known values ​​(Fig. 3). The method provides a basis for calculating the pressures and velocities in the required number of points, taking into account the influence of friction, convective acceleration and pressure gradients instant - everything that the previous methods are fully or partially lowered [4].


                                                                                          Figure 3 – Characteristics of the method.

In the modeling of water hammer were used the following settings pipeline system: L (pipe length) 1000 m, h (geometric height) of 20 m, diameter of 2.5 m. In the initial mode, the pressure is 83 atm. Water flow rate 370 m 3 / h, the efficiency = 0.67.

The calculation of the transition process on the PC have a chart (Figure 4). Water hammer occurs due to the shutdown of pumping agregata.


                                                                                Figure 4  Graph of water hammer in the 10 second interval of time.

From the above graph shows that the system needs to be controlled. The resulting abrupt changes in pressure, constitute a danger to the elements of the pipeline and pumping plant. For a timely response to the threat of water hammer pressure monitoring system must be constantly improved.

Controlled parameters during the process are the flow and velocity of the fluid and the pressure on the walls of the pipeline. In solving the problem of predicting the hydraulic impact, the most critical parameter is the pressure, the jump which leads to a hydraulic shock. Therefore, the main measuring channel a channel pressure measurement.

The proposed microprocessor based microcontroller controls the blocks interaction with the measuring device, converting a signal using ADC: a graphical display interface for integration with a PC RS-485. Block diagram of the electronic system is shown in Fig. 5.


                                                                        Figure 5 - Block diagram of electronic control of pressure in the pipeline.

Fitting Pressure Monitoring System pipelines TPP. The work of the proposed system based on proportional conversion of pressure into an electrical signal. When the pressure (at a rate higher than 0.4 atm / sec) in the pipeline at the output of the sensor is formed by an electrical signal.

The electric signal output from the sensor through a conversion unit pressure enters the ADC. After analog to digital conversion the signal is transmitted to the controller of the electronic unit. After processing, the result is compared with established thresholds

As a result of processing the output signal is formed, which enters the display unit that controls the inclusion of LED indicators. If you exceed the emergency threshold include the appropriate LED. The amplitude of the pressure change is displayed on the LCD display unit.

The digitized signal from the sensor in the threshold register is stored in the memory of the electronic system. The transfer of data from the memory of the electronic unit to a PC via an interface RS485.

Conclusion

 In the trials carried out:

               
  1. On the basis of studying the problem of water hammer, we see the need to improve the system of control of the pipeline TPP.
  2. The necessity of using the electronic system, based on a predictive mathematical model that solves the problem in a high rate of real time.
  3. As a main measuring channel is proposed to use the channel pressure that could be implemented through the application of pressure measuring devices.

This master's work is not completed yet. Final completion: December 2011.


References

  1. Жуковский Н.Е. О гидравлическом ударе в водопроводных трубах. М.-Л., Гостехиздат, 1949. 103 с.
  2. Бержерон Л. От гидравлического удара в трубах до разряда в электрической сети. Общий графический метод расчета. (Перевод с франц.) М., Машгиз, 1962. 348 с.Лямаев Б.Ф., 4.
  3. А.В. Клименко, В.М. Зорина Теплоэнергетика и теплотехника: Общие вопросы: Справочник, МЭИ, 2000.
  4. Фокс Д.А. Гидравлический анализ неустановившегося течения в трубопроводах. М, 1981. - стр.248
  5. Соколов Е.Я. Теплофикация и тепловые сети: Учебник для вузов. — 7-е изд., стереот. — М: Издательство МЭИ, 2001. — 472 с: шт.
  6. Кудинов В.А., Карташов Э.М. Гидравлика. М.: Высшая школа. 2008. 200 с.
  7. С.Мекид Повышение структурного интеллекта кластеров датчиков в промышленном производстве /Датчики и системы-2007. - №4 – с. 50÷64
  8. Под ред. А.И. Барановского, Н.Н. Кожевникова, Н.В. Пирадовой. Экономика промышленности. Том 2. Часть 1, 1998.
  9. Энергетическая стратегия Украины на пepиод до 2030 року (Одобрена распоряжением Кабинета Министров Украины от 15 марта 2006 г.), с. 26. Официальный сайт Минтопливэнерго Украины http://mpe.kmu.gov.ua/fuel/control/uk/doccatalog/list?currDir=50358
  10. Уралтеплоресурс http://td-utr.ru
  11. Поисковый портал документации на микроэлектронику http://gaw.ru