ABSTRACT
This paper presents the possibility of using CAD programming tools for customizing, in order to meet specific engineering tasks. The software developed in this work enables the automation of the procedure for mechanical calculation of overhead electric power transmission lines. The calculation includes determination of vertical deformations and stresses of transmission lines, graphical representation of lines at different temperatures and additional loads on columns. Developed programs allow automatic creation of tables with data on normal forces, stresses and deflections of wires for different values of spans, at different temperatures, as well as graphical representation of calculated values for deformations and loads. Keywords: CAD, programming, electric power transmission lines.
1. INTRODUCTION
The programming and customization of standard AutoCAD package to suit the special needs of a company can significantly increase productivity and fully utilize the potential of this CAD tool. Most modern CAD programs offer capabilities to accommodate user-developed programs in order to perform certain design tasks and functions that cannot be carried out directly by using the standard functions offered by the systems. AutoCAD is an open-architecture application which supports different programming environments, like:
- ActiveX Automation, a technology that is based on the component object model (COM) architecture and enables macro programming across applications;
- VBA (Visual Basic for Application), an object-based programming environment designed to provide rich development capabilities;
- AutoLISP and VisualLISP, the versions of common LISP, a popular artificial intelligence language;
- ObjectARX, a technology that provides the foundation for design applications to share intelligent object data. ObjectARX programming environment includes a number of C++ dynamic link libraries (DLLs) that operate directly with core AutoCAD data structures and code;
- .NET., that enables creation of applications that interoperate with AutoCAD using programming languages like VB .NET and C#.
AutoLISP is based on the LISP programming language, that was originally designed for use in Artificial Intelligence (AI) applications and is still the basis for many AI applications. Visual LISP (VLISP) is a software tool designed to expedite AutoLISP program development. The VLISP integrated development environment (IDE) provides features to help ease the tasks of source-code creation and modification, program testing, and debugging. In addition, VLISP enables delivering standalone applications written in AutoLISP.
Although AutoCAD has a widespread use as a tool for 2D drawing and 3D modeling, in the combination with programming languages designed for its extending and customizing, it grows to the environment in which we can not only draw, but also do some complex mathematical operations, and represent their results in the form of automatically generated tables and visual, graphical appearances. Like all programming languages which find their application in engineering, VLISP supports different forms of calculation. Thereby, the possibility of graphical data input is of particular significance, as well as representing of the results in the form of graphical entities. The process of doing calculations and generating project documentation are becoming integrated, and the time necessary for their creation is rapidly decreasing.
The aim of this paper is to show the possibility of automatization of the procedure for mechanical calculation of the energetic transmission lines using the programming techniques inside AutoCAD environment.
2. PROBLEM DESCRIPTION
Since overhead low and high voltage transmission lines are uninsulated wire, design of these lines requires minimum clearances from the ground to be observed to maintain safety. The shape of a cable hung between two supports forms a curve called a catenary. The term catenary applies to a flexible cable that has uniform mass throughout its length and is being acted upon a gravitional force. The sag of a cable is the vertical distance between the cable and the straight line drawn between wire connection points measured at the midspan. The magnitude of the sag is influenced by the value of the span, weight of the cable and climate circumstances. The cables get longer and closer to the ground at high temperatures in summer, and due to ice or snow there is an additional load in winter, which can achieve extremely high magnitudes. The values of stresses and sags by different temperatures can be determined using the equation of state:
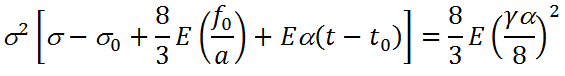
σ (Mpa) – stress of the transmission line at the temperature t (°C)
 (Mpa) – max. tensile stress
E (Mpa) – Young's modulus
γ (N/m•mm2) – specific weight
α (°C) – temperature coefficient
 (°C) – temperature at which the max. tensile stress acts
 (m) – sag at the temperature t0 (°C)
a (m) – sag
At small spans, the maximum tensile stress is present at the lowest temperature of -20°C, and at large spans the maximum stress appears at the temperature of -5°C with additional load. Between these two cases, there is a critical span by which the maximum tensile stress appears at both temperatures, -20°C and -5°C with additional load. Comparing the critical span ak with the real span a, we get the criterion of critical span:
- if a>ak, the maximum tensile stress is present at the temperature of -5°C with additional load;
- if a<ak, the maximum tensile stress is present at the temperature of -20°C without additional load.
The maximum sag appears either at the temperature of -5°C with additional load, whereby the cable gets longer due to mechanical loads, or at the temperature of +40°C, whereby the cable gets longer due to temperature loads. The criterion of critical span determines the temperature by which the maximum sag is present. The critical temperature is defined by the temperature at which the sag achieves the same value in the case without additional load and in the case with the additional load at -5°C.
Comparing the critical temperature with the temperature of +40°C, we get the criterion of critical temperature:
- if t<40°C, the maximum sag is present at the temperature of +40°C;
- if t>40°C, the maximum sag is present at the temperature of -5°C with additional load.
3. PROGRAM RESULTS
The communication with the software developed here is done by the command line and dialog boxes, for which definition two types of files are needed:
- the files with the description of the dialog box appearance, which includes the definition of the number and size of the basic elements and their disposition. These files are written in DCL (Dialogue Control Language);
- VLISP programs to control the dialog boxes.
The softwer includes a set of new commands and some of them are briefly explained here. The commands sag and stress generate tables with the sags and stresses for more spans between two columns at different temperatures. The span and temperature values are determined by the minimum and maximum value and by the increment of these values (Figure 1).
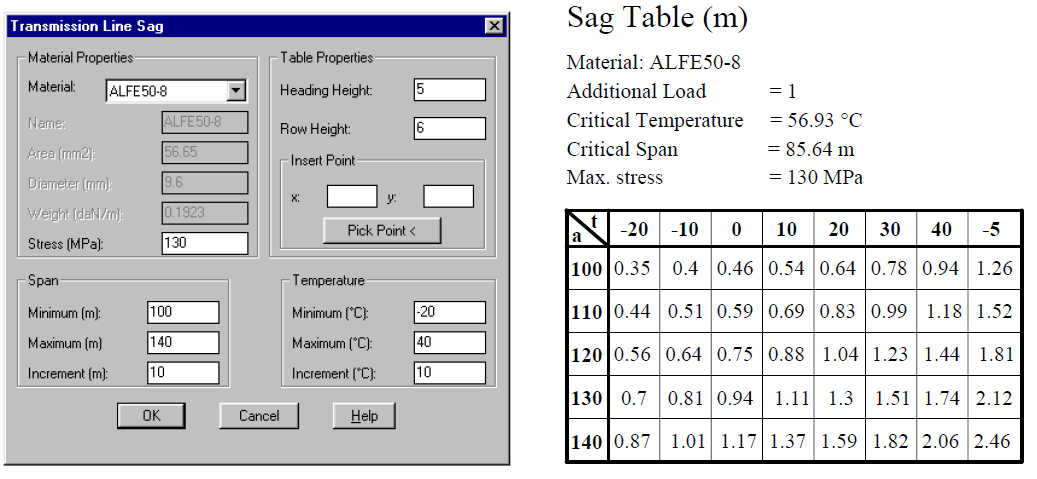
Figure 1. Example of input and output data for calculating cable sags
The command span automatically generates the table with data on transmission line stresses, tensile forces and sags for the specific value of span between two columns, at different temperatures. The input data for this command are the material of the transmission line, the maximum allowable stress value, the additional load coefficient, the distance between the columns, the lowest and the highest temperature, as well as the temperature increment for which the results are being calculated, and the data which define the result table appearance: the height of heading and table rows and the coordinate of the upper left table corner. These values can be graphically entered with the mouse or by typing on the keyboard. The example of input and output data for the command span is depicted in the figure 2. Every table column is drawn on its own layer, which enables control of visibility of values for specific temperatures by turning the layers on and off.
The command catenary draws the transmission line shape for the specific span between the columns, at one or more different temperatures (Figure 2). The shape of the catenary can be drawn in different proportions in vertical direction. The colour of the temperature text on the right is same as the colour of the corresponding catenary.
The visibility of these shapes can be regulated by turning on or off the corresponding layers on which they are automatically placed. The example of layer sintax is AlFe50-8_100_20, which represents the catenary with the material ALFe50-8, for the span of 100 m, at the temperature of 20°C.
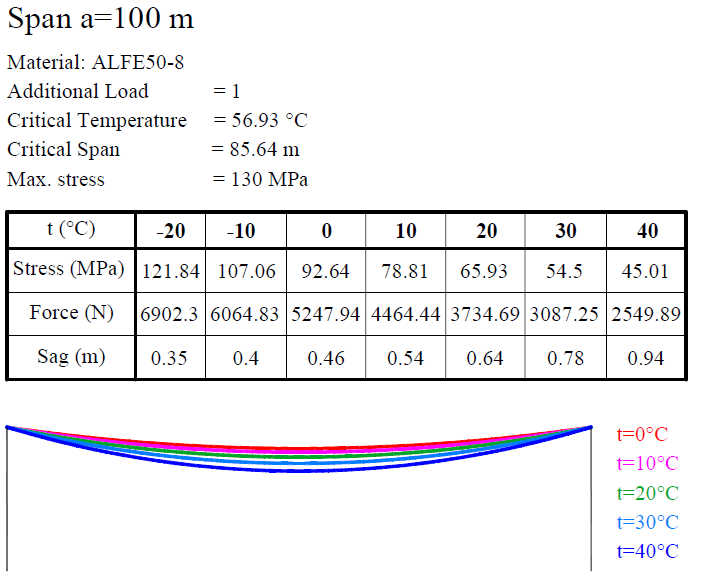
Figure 2. Example of output data for the commands "span" and "catenary"
4. CONCLUSION
The aim of this paper is to present the possibility of automatization of the procedure for mechanical calculation of overground transmission lines. Programming in VLISP has enabled the customization of AutoCAD user environment to fulfill the specific engineering task concerning projecting, calculation, graphical presentation and technical documentation of the results. The software developed here provides greater accuracy and reduces the time needed for calculation of stresses and sags of transmission lines for arbitrary values of spans and temperatures. Additionally, the functions for automatic generation of tables with the results and drawing of accurate shape of catenary have been developed.
5. REFERENCES
1. R. Gesner, J. Smith: Maximizing AutoLISP, The Complete Guide to Programming AutoCAD with AutoLISP, New Riders Publishing, USA, 1992.
2. J. Winters, VB.NET Programming for AutoCAD Customization, VB CAD, Inc., 2007.
3. Nadzemni vodovi, Pravilnik o tehnickim normativima za izgradnju nadzemnih elektroenergetskih vodova, Beograd, 1980