
Abstract
Contents
- Introduction
- 1. Relevance of the topic
- 2. Research objective and tasks, its scientific novelty
- 3. The valuation method of signal-to-noise ratio
- 4. Equipment for implementation of the method
- 5. Conclusions
- References
Introduction
While detecting signals carrying information that is objective for this kind of measuring, interfering signals, i. e. noise and interference of different character, are registered simultaneously together with the main signal. Interference also includes distortions of wanted signals under the influence of diverse destabilizing factors on processes of measurement, as, for example, influence of lightning discharges on electroprospecting processes of measurement and etc. [1].
Signal-to-noise ratio often serves as measure of discernibility of wanted signal against noise in one or another system [2].
Signal-to-noise ratio (SNR) is dimensionless quantity, indicating power of wanted signal to power of noise ratio.
1. Relevance of the topic
Object of valuation of signal-to-noise ratio in the received radio signal is actual for radio-technical systems of different destination (radio-locating, radio-navigational, communication systems, information measuring systems). Existing valuation methods require previous knowledge of the frequency band occupied by the received signal or adding of special additional signals to the signal being transmitted. In the master’s thesis valuation method of signal-to-noise ratio for the signals with continuous carrier free of mentioned flaws is considered.
2. Research objective and tasks, its scientific novelty
Investigation of valuation methods of signal-to-noise ratio in the received radio signals is objective of the master’s thesis.
Main tasks of the research are:
- Analysis of existing valuation methods of signal-to-noise ratio;
- Working of valuation method of signal-to-noise ratio, invariant to the signal spectrum width;
- Working and modeling of equipment for the workable method to realize;
- Analysis of the result obtained.
In the master’s thesis fundamentally new valuation method of signal-to-noise ratio will be stated.
3. Valuation method of signal-to-noise ratio
Detection of wanted signals with continuous carrier is accompanied by noise. If to consider instantaneous frequency of such sum of wanted signal and noise, 2 components may be noticed: small fluctuations and short emissions of high amplitude [3].
The signal at the output of frequency-sensitive detector may be considered as the sum of two components – emissions resulting from occurrence of open-phase faults and fluctuating noise. The component of phase jumps possesses uniform spectrum with density (2π)2fs, where fs – is mathematical expectation of number of jumps per second (average intensity of jumps), it is defined by the formula:
 (1)
(1)
In this form: p – signal-to-noise ratio at the output of intermediate frequency filter, erfc() – additional function of error, that is defined by the form:
 (2)
(2)
R – gyration radius of intermediate frequency filter:
 (3)
(3)
In this form: f0 – is carrier frequency, H – is transmissive characteristic of filter [3].
Considering transmissive characteristic of intermediate frequency filter uniform in the limits [ f0 – Δf/2; f0 + Δf/2], from (3) the following result for gyration radius will be got:

Putting this value in (1) we will get:
") (4)
(4)
It is seen from the last form that number of anormal errors depends on the frequency band occupied by the signal, so it is of interest to work out valuation method of relative frequency of anormal errors appearance, invariant to the frequency band.
In [4] ratio for average number of maxima per unit of time for fluctuation of quasi-harmonic process phase is defined:
 (5)
(5)
where r0 – is correlation function of the process r(τ) if τ = 0; r0″ and r0(4) – are derivatives r(τ) if τ = 0 of the second and fourth order respectively.
Correlation function of frequency change may be presented in the following way:

Having calculated derivatives and having put them in (5) we will get:

Having divided (4) on derived ratio, we will get the form invariant to frequency band, occupied by the analyzed signal:

Thus, signal-to-noise ratio will be defined by the formula:
 , (6)
, (6)
where erfc–1() – inverse additional function of error.
The graph of this dependence is shown on the picture 1.
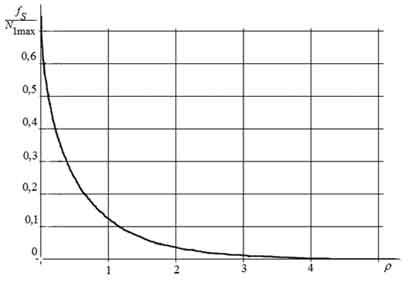
Picture 1. The diagram of relationship between anormal errors number to average number of fluctuation maxima ratio and signal-to-noise ratio
5. Equipment for implementation of the method
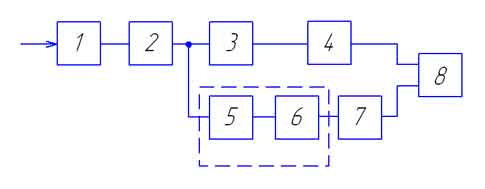
The example of realization of this method is illustrated on the picture 2, where block 1 – narrow-band filter, block 2 – frequency-sensitive detector, block 3 – indicator of extrema, 4 – counter of extrema, block 5 – differentiating circuit, block 6 – differential discriminator, block 7 – counter of anormal emissions, block 8 – resolver.
Picture 2. The block diagram of the equipment for detection of signal-to-noise ratio
After preliminary filtration and frequency detection of the sum of signal and noise being realized in the blocks 1 and 2 respectively, the extraction of extremal values and short high-amplitude discharges (anormal discharges) is carried out with the help of the blocks 3, 5 and 6 respectively. Next with the help of the blocks 4 and 7 number of extrema and anormal discharges is counted up. The risolver (block 8) gets the contents of the counter of anormal emissions at given value of the counter of extrema and takes transforms of this number by the formula (6).
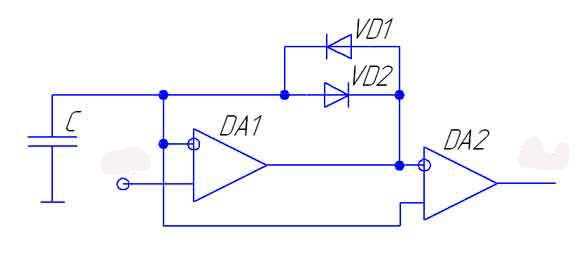
The indicator of extrema is realized by the scheme shown on the picture 6, where DA1 – operational amplifier (OA), DA2 – comparator. Its work is explained by the time charts shown on the picture 7, where 9 – input signal; 10 – output signal of OA; 11 – signal at the output of the comparator.
Picture 3. The scheme of the indicator of extrema.
On increasing of the input signal the output signal of OA also increases, in which connection its level is bigger by the value of threshold of tension in the diode VD1 than that of the input signal. On decreasing of level of the input signal the output signal of OA decreases as well, at that its level is less by the value of threshold of tension in the diode VD2 than that of the input signal of OA.
Picture 4. The time charts, explaining work of the indicator of extrema.
(animation: 10 frame, 7 of cycles of recurrence, 136 kB)
(9 – input signal; 10 – output signal of OA; 11 – signal at the output of the comparator)
So, the difference equal to threshold of tension of opening the diodes VD1 and VD2 between the input signal and the output signal of OA always takes place, in which connection if the input signal increases, this difference has positive sign, if it decreases, this difference has negative sign. Change of sign of tension difference occurs at the moment of change of sign of derivative of the signal (when derivative turns into zero).
This difference stands out with the help of the comparator.
Conclusions
Thus, the proposed method of valuation of signal-to-noise ratio, based on finding of frequency of anormal errors appearance (high-amplitude short-time impulses of instantaneous frequency) to general number of signal frequency extrema (discharges) ratio is invariant to the frequency band, occupied by the received signal. It does not require previous valuation of the frequency band occupied by the received signal, that finally leads to decrease of the time, needed for valuation of signal-to-noise ratio, and that improves speed.
On writing this report the master’s thesis has not been completed yet. The term of final readiness of the work is December, 2014. The full text of the work and materials on this topic may be obtained from the author or his supervisor after the specified term.
List of sources
- Харкевич, А. А. Борьба с помехами / А. А. Харкевич. – [2-е изд.]. – М.: Наука, 1965. – 275 с.: ил.
- Джонс, М. Х. Электроника – практический курс / М. Х. Джонс; пер. с англ. Е. В. Воронова, А. Л. Ларина. – М.: Постмаркет, 1999. – 528 с.: ил.
- Ван Трис, Г. Теория обнаружения, оценок и модуляции. В 3 т. Теория нелинейной модуляции Т. 2 / Г. Ван Трис; пер. с англ. В. Т. Горяинов. – М.: Советское радио, 1975. – 344 с.: ил.
- Тихонов, В. И. Выбросы траекторий случайных процессов / В. И. Тихонов, В. И. Хименко. – М.: Наука, 1987. – 304 с.: ил.
- Пат. 86834 Украина, МПК G 01 R 29/26. Спосіб вимірювання відношення сигнал/шум / Алаєв О. М., Атаров М. О.; заявник и патентовласник Державний вищий навчальний заклад Донецький національний технічний університет. – № u201309268, заявл. 23.07.2013; опубл. 10.01.2014, Бюл. № 1
- Алаев, А. Н. Метод оценки качества сигнала с непрерывной несущей / А. Н. Алаев, Н. А. Атаров // Современный научный вестник. – 2013. – № 50 (189). – С. 94–98