
Abstract
Contents
- Introduction
- 1. Theme urgency
- 2. Goal and tasks of the research
- 3. Research overview
- 4. Features of Wireless LAN radio waves propagation
- 5. Geometric models
- 6. Building of room model
- 7. Building of field distribution
- Conclusion
- References
Introduction
Distribution of wireless communication systems leads to the need of approximate calculation of field in rooms for optimal locating of transmitter. This helps to solve not only a task of providing service area coverage, but also a task of preventing information leakage through wireless communication channel.
In recent years, a question of derailed analysis of wireless systems’ security threads, their appearance probability and probability of their prevention with existing tools became very relevant. Specialists in information security designed a huge amount of comprehensive information protection systems; a lot of practical test carried out. However, the question of theoretical measurement of network security remains opened.
The task of this work is to develop a wave attenuation model for buildings of complex shape and check the possibility of its application on practice for local wireless networks’ leakage security. In addition, create an instrument for schematic display of buildings, visual representation of results in the form of area coverage tacking into account wave’s reflective properties.
1. Theme urgency
The relevance of the development a simple, visual field calculation method related not only to the need of information protection from leakage, but also to the need of optimal locating of transmitter. This helps to cover as much area as possible with as little number of transmitter as possible for conservation of energy and reduction of fields’ adverse effect on human body.
Most of the methods used provide a two-dimensional solution of this problem, allowing you quickly assess the optimal location of the transmitter. This is sufficient for most cases, but in the case of multi-storey buildings, this method does not allow to take into account the wave propagation between floors. In this paper, we propose a method for constructing a three-dimensional grid with an approximate distribution of the field that is usually overkill for a simple local wireless network in the building, but individual cases can show much more precise result compared with two-dimensional methods.
2. Goal and tasks of the research.
The purpose of the master's work is to develop a radio waves attenuation model, which would take into account the geometric features of the environment.
Major goal of the research:
- Develop a simple graphical editor for specifying the form of premises.
- Creation of propagation model using ray tracing.
- Visual representation of the simulation results.
- Comparing results with experimental data.
The object of study: the local wireless network.
Subject of research: union of methods of radio wave propagation calculation.
3. Research overview.
The study is a popular topic in the international scientific community and in the local. A large number of research and development evidences this.
In [1], a two-dimensional model of the multipath propagation channel of UHF in buildings proposed. The model based on the methods of geometrical optics that provides a deterministic description of the geometric characteristics of the premises. Reflection of radio waves from the walls modeled as a reflection from a flat surface with some effective reflectivity. The proposed model and developed on its basis software can determine the key parameters of the link: attenuation, the signal propagation time, impulse response, etc.
In [2] proposed the use of ray tracing to find areas of shade on the structural elements of buildings based on methods of geometrical optics. Calculation of the field at the selected point made using the mirror image of source. In the comparison of the distributions of signal attenuation, the calculated in different ways and it shown that the proposed method yields reliable results.
In [3] described in detail an algorithm for constructing a binary tree and its use to determine visibility between nodes. However, the definition of visibility produced by a numerical method that does not always give the correct result. The paper [5] describes the analytical method for determining visibility and provides its implementation in C.
The process of tracing for binary trees described in the article [4], as structural elements of the building used convex polyhedra.
4. 4. Features of Wireless LAN radio waves propagation.
Radio wave is electromagnetic radiation with wavelengths in the electromagnetic spectrum longer than infrared light. The radio waves have a frequency of 3 kHz to 300 GHz, and a corresponding wavelength from 1 millimeter to 100 kilometers. Propagation on the premises has the following features:
1) On the propagation effect walls and massive pieces of furniture. According to the degree of influence they can be divided into the following groups:
а) The weak influence of walls and ceilings made of wood, plastics, glass.
б) Medium impact: the obstacles of brick, concrete.
в) High impact: obstacles and walls of reinforced concrete with foil insulation.
Metal walls and floors greatly affect the range, up to the complete impossibility of communication. It considered ambiguous the effect of non-capital plasterboard walls - from low to very high depending on the design of the lattice at its core - and in some cases may fluctuate with changes in humidity in the room.
2) Indoors becomes significant influence interference phenomena. Due to multiple reflections from the various designs interference character of the electromagnetic field inside the premises more pronounced. This leads to a decrease in field strength in certain places in the space and increase the other. In some cases, it can also lead to so-called fading ("dead zones") in which the signal reception is greatly complicated. This can happen even if the receiver is in line of sight from the transmitter. The formation of "dead zones" due to the fact that the signal follows the paths of different lengths, bouncing off various objects, such as steel constructions, concrete walls, metal doors, windows, ceilings, etc. "The Dead Zone" appears if the length of the propagation paths differ by an odd number of half wavelengths. But "absolutely dead zones" are usually very local and may be removed by moving antenna receiver and / or transmitter. This is very important when planning the placement of wireless communication devices in the premises.
5. Geometric models.
There are three main classes of geometric models:
1) Constructive solid geometry (CSG). The technology used for modeling of solids. Constructive solid geometry is often, but not always, is a way of modeling three-dimensional graphics and CAD. It allows you to create a complex scene or object using bit operations to combine several other objects. This makes it easier to describe complex objects mathematically, although not always pass operation using only simple bodies. Therefore, constructive solid geometry model used for the surfaces that look visually complex; in fact, they are little more than cleverly combined simple objects.
Simple body used in a constructive solid geometry - primitives with a simple form: a cube, cylinder, prism, pyramid, sphere, cone. The set of primitives available depends on the software package. For example, some programs allow the creation of a constructive solid geometry based on curved objects, and some do not. Building a more complex object occurs with use of object descriptions Boolean (binary) operations on sets - union, intersection and difference. Primitive usually can be described a procedure that takes some parameters, for example, to build enough to know the scope of its radius and center.
The main advantage of SCG is ease of description, but this it has some drawbacks:
- The method is flexible enough: SCG acceptability depends on a given set of primitives. If the primitive needed for a particular case missing, modeling will be difficult.
- CSG lacks some important information for rendering, which needs triangulation.
2) Boundary representation - method of presentation solid form by describing its borders. The three-dimensional body is set connected to each other surfaces that define the border between the sending and the rest of the body space.
а) The boundary representation with facets. The surfaces of three-dimensional objects divided into separate flat triangles. When the surfaces divided into triangles, objects described as a list of triangles. While this method allows precise and clearly describe the object, it is nevertheless inaccurate, triangles must be very small to describe the model accurately. The advantage of the method - simple visualization of existing graphics libraries with hardware acceleration makes it easy to draw such objects on the screen.
б) Boundary representation with the parametric surfaces. Instead, triangles used to describe the faces of parametric surfaces. This method is widely used for the submission of vehicles (cars, planes, ships). Its advantage compared to the representation of the triangle is the ability to describe smooth surfaces accurately.
6. Building of room model.
The editor window is a set of four projections in the center of the window and the toolbar on the right. Initially, the screen has a construction element in the form of a box (Fig.) That can move and change its size. The basic operation is to create a space to add convex polyhedra. Convex polyhedras choosen as geometric primitives because they can be combined easily. By clicking on the appropriate button in the right pane on the site of the construction element appears created element.
The room constructed from convex polyhedra, tightly adjacent to each other (Fig. 1). Their mathematical representation - the list of planes, describing each face. The planes described by three points with integer coordinates, it allows you to avoid problems with floating point accuracy and guarantee the exact location of planes "on the grid". All polyhedras are written in a simple text file (Fig. 2).

Fig. 1. Building in editor window
Taken together polyhedras form a closed room. For a visual representation of polyhedra by finding points of intersection of the planes are based polygons on the screen. Invisible outer surfaces will be removed later.

Fig. 2. Polyhedra representation in file. 1 - Three points describing plane. 2 - Additional information for visual representation.
Ray tracing requires finding the intersection of polygons with the ray. From all points of intersection near one selected. Thus, the need for a ray intersection test for each polyhedron at each reflection. This means that along with the increasing complexity of shape of the room and size time calculation will grow linearly. To get rid of this dependence it`s common to build special accelerating structures that allow you to discard large chunks of space immediately when checking the intersection with the ray. An example of such a structure is binary partition tree (Fig. 3). Plane that divides polygons into two roughly equal lists selected as dividing. Partitioning done until each node of the tree will be convex.

Fig. 3. Binary tree example
In detail the process of finding intersections described in [4].
7. Building of field distribution.
Point used as a source of signal, radiating uniformly in all directions. From the point a random vector chosen and its intersection with the room found. The resulting segment and the corresponding value of the field is stored in the list. From the end of the segment mirror built next ray. Reflected vector can be constructed by formula (all vectors has unit length):
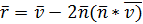 , where
  – incident vector,
  – surface normal.
The reflected ray must have been smaller intensity value is taken into account by the reflection coefficient [1]:
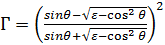 , where
  – the angle of incidence,
  – the relative permittivity of the wall.
The process continues for the desired number of reflections, and rays. When the calculation is finished, grid with a resolution 100h100h100 is built, each ray segment adds value to its intensity with the distance traveled in a fixed time to the grid cells it passes. The resulting grid is displayed in the form of dots - the bigger dots, the higher the intensity (Fig. 4).

Fig. 4. Calculation result for depth
1-8
(animation: 8 frames, 7 cycles, 116 kb)
Conclusion
The approximate distribution model shows quite reliable result for a simple assessment of the optimum location of the transmitter in the room.
Remark. In writing this essay master's work is not yet complete. Final completion: December 2015. Full text of the work and materials on the topic can be obtained from the author or his supervisor after that date.
References
- Липлянский И.А., Спунитис А.А. Модель трассировки лучей для распространения радиоволн в помещениях [Электронный ресурс]. Режим доступа: https://ortus.rtu.lv/science/lv/publications/4272;jsessionid=451EC9D108A3C5E8ED2E87815EE674EF/fulltext.pdf
- Алгоритм трехмерной трассировки радиоволн локальной беспроводной сети [Электронный ресурс]. Режим доступа: http://cyberleninka.ru/article/n/algoritm-trehmernoy-trassirovki-radiovoln-lokalnoy-besprovodnoy-seti
- Binary Space Partioning Trees and Polygon Removal in Real Time 3D Rendering [Электронный ресурс]. Режим доступа: http://sha.nnoncarey.com/physics/SamuelRanta-Eskola_BSPTrees.pdf
- Quake 3 BSP Collision Detection [Электронный ресурс]. Режим доступа: http://openzone.googlecode.com/git-history/f73bb8dfe8e6a16c13d39aba1c8f6537ee263d07/doc/Quake3BSP.html
- Binary Space Partitioning Tutorial [Электронный ресурс]. Режим доступа: http://www.cs.utah.edu/~jsnider/SeniorProj/BSP/default.htm
- Sandy Sefi, Ray Tracing Tools for High Frequency Electromagnetics Simulations, Licentiate Thesis Royal Institute of Technology -Режим доступа: https://www.nada.kth.se/utbildning/forsk.utb/avhandlingar/lic/030612sefi.pdf
- Gary Simmons, Binary Space Partitioning Tutorial // [Электронный ресурс] -Режим доступа: http://www.cs.utah.edu/~jsnider/SeniorProj/BSP/default.htm