Insar and polinsar for land subsidence monitoring – user perspective
Àâòîðû: Geological Visualization Laboratory at Chair of Fundamental Geology
Àâòîðû: Geological Visualization Laboratory at Chair of Fundamental Geology
In this paper the selected interferometric studies of subsidence caused by underground mining are discussed. Despite the common limitations the traditional single-polarization InSAR technique is already proved its high potential in this application. Today, the determination of the areas of affected by terrain deformation risks becomes one of the most promising applications for operational use of SAR data. InSAR monitoring of Upper Silesian Coal Basin in Poland (ESA AO3–127 project) and other studies from Central Europe shows that the interpretation of the fringe pattern is often strongly reduced by low coherence. On the base of these examples this paper aims to discuss a potential advantages of POLinSAR technique in this application.
Mine subsidence – commonly known, as a sag subsidence is in theory a gentle, gradual settling of the earth’s surface. In the context of underground mining, is the lowering of the Earth’s surface due to collapse of bedrock into underground mined-out areas and subsequent sinking of surface unconsolidated materials-sand, gravel, silt, and clay. In recent years coal mine subsidence is associated with underground large-scale highly mechanized technology named long wall mining
operations with allows the almost total removal of a coal seam. In that system a seam of coal can be extracted in a form of parallel strips at a length of 1 to 2 km and width of 200 to 500 m. With modern equipment around 10.000 t of coal can be exploited from one face per day. The pace of an average long wall mining extraction front is 3 to 10 m per day.

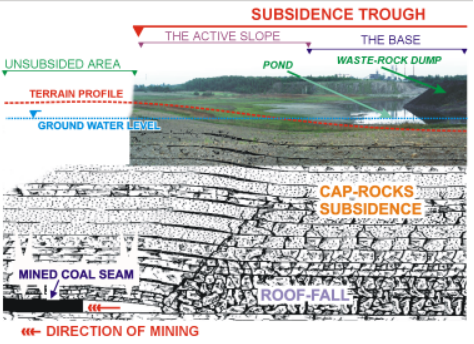
Figure 1. Mine subsidence caused by underground mechanized longwall coal mining
Mine subsidence is very interesting for InSAR research and modeling because other than in natural causes the subsurface action is known: the depth, mass and volume of rocks removed and time. Moreover, the general result on surfaces also known and general models of the process exists. For coal mining industry, the surface deformations are expensive to measure using traditional methods and thus the common strategy is to measure as less as possible. Typically the measurements are done only at limited, most important locations with low frequency and then the deformation phenomena are not as well recognized as it might be [3].
The Region, Upper Silesia is stretching almost in the centre of Europe in the southern part of Poland and has borders with the Czech Republic and Slovakia. Geologically, the main geological structure of the Region represents the Upper Silesian Coal Basin (USCB). It covers an area of about 7,250 km2 and it is the primary coal basin in Poland, and also one of the largest in Europe. The coal bearing formations of the USCB include several Upper Carboniferous litostratigraphic series, totalling 8,500 m in the greatest thickness. These series are featured by a gradual reduction of their thickness toward the east and southwest. The lower part includes sediments characterized by numerous periodic marine transgressions (paralic sediments) separated by a sedimentary gap from the overlying limnic
part of the sequence, consisting of continental sediments. On the great area of the USCB boundary is located at the base of the important the thickest 510 seam (max 25 m thick). Mining activity of Carboniferous hard coal deposits has been conducted here for over 200 years. During this last two centuries about 7 billion tons (out of a potential 60 billion t) of raw materials were exploited by the coal mining industry. Today the region is producing up to 100 million tonnes of hard coal per year. As a result, the region has become highly urbanized and simultaneously environmentally degraded. At present there are 39 active coalmines in the Polish part of the basin operating at the depth ranging from 200 to 900 m below the terrain surface. Among them the significant part of the coalmines is going to be liquidated because of restructurization of Polish industry.

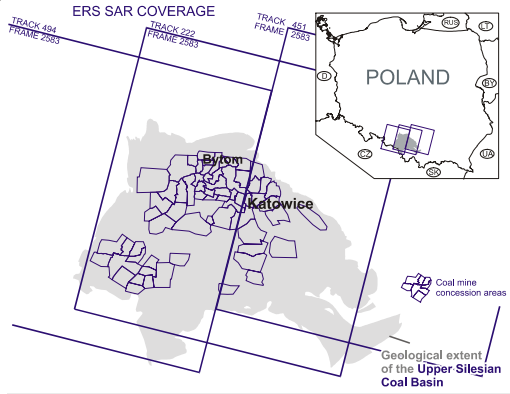
Figure. 2. Location Map of the Polish part of Upper Silesian Coal Basin (USCB) and ERS SAR coverage
In Upper Silesia, the mining activity has caused an area of almost 600 km2 to sag (by trough) subsidence with local appearances of pit subsidence (sink-holing). Both types of subsidence are accompanied by surface deformations and discontinuities such as fractures, crevices, faults, step folds and slides. The subsidence has caused particular changes in topography of Upper Silesia, as well as in hydrography, and is still affecting buildings, roads, railways and pipelines. Between 1970 and 1999 many exploitation fields has been located under densely urbanized cities like e.g. Katowice (the capital of the province) and historical town Bytom. Since that time, mining deformation has become an important problem for construction, settlement, communication and investment policy [3].
The subsidence in Upper Silesia reaches velocities commonly of a few centimeters per month but there are many areas with subsidence of 1 cm daily, or more. Such a rate of downwarping usually appears 3 to 6 months after exploitation and then during the next two years the subsidence gradually ceases. If an area has been previously subsided due to mining in coal seams above current exploitation the subsidence is usually faster and cease in a shorter period. In a most common case of the longwall technique for coal exploitation the area of the highest rate of subsidence follows the exploitation front during the spatial expansion of settled area Fig. 1
. The extents of the final subsidence basin named subsidence trough are determined by the size the exploitation field and its depth depends on the thickness of coal layer.
For subsidence prediction in the Polish coal industry the methods are used developed on the Budryk – Knothe theory of subsidence, which considers the rheology of subsidence phenomena and applies of the Gaussian model. The common reliability of the forecasting is about 75%. Predictions and ground geodetic measurements of current deformations are used to construction of mining land classification maps that allows determining the hazards for engineering structures.
Since 1998 the 48 ERS SAR scenes over Upper Silesia have been analysed and processed within AO–127 ESA Project. To cover whole area of mining activity full SAR scenes acquired from adjacent tracks 494, 222, 451 have been selected. As the result the interferograms of variable baselines (between 0 to 430 m) have been successfully generated. The best results were obtained for tracks 494 and 222. Depending on seasonal conditions, land use type and temporal baseline the interferograms presents various qualities and finally only a few were suitable for quantitative analysis. For interferometric processing the differential 3 and 4 pass interferometry have been applied. To reduce topographic effect on the differential interferograms the tandem data acquired in 1995 and 1999 have been used.
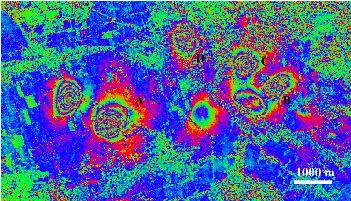
The first interpretations of the ERS SAR Interferograms over Upper Silesia [5] shows that for repeating cycle of 35 days observations the fringe pattern on interferograms presents only differential effect – i. e. the temporary velocity of subsidence instead of the subsidence trough elevations obtained with terrestrial leveling. The highest temporary velocity of subsidence is occurring on the dynamic slope of expanding subsidence trough following long-wall exploitation. SAR interferograms over typical short time periods like 35–days present thus unique information about subsidence velocity pattern which extraordinary spatial quality.
Despite presented above potential, the SAR interferometric mine subsidence measurements have distinct environmental limitations identified during the analysis of data from Upper Silesia. The limitations due to SAR geometry and system noises are not discussed in this paper.
Successful coherent interferogram generation depends on seasonal and weather conditions during and before SAR data acquisition. Usually wet weather and dense vegetation cover significantly degrading coherence. SAR data selection must thus be performed very carefully considering detailed meteorological data. Typically, the SAR image pairs with temporal baseline longer than 70 days are incoherent. This limitation considerably decreases the number of data available for processing. In Central Europe of moderate climatic zone there are many areas, which are permanently inaccessible for InSAR observations (forests) or there are inaccessible temporary (arable lands). Only man-made structures remain coherent over long time scales [6]. Applying very careful data selection according to meteorological data the coherence may be maximized. Similarly, coherence improvement could be done also with consideration of seasonal variability: the best coherence presents data acquired during autumn to early spring seasons with limited vegetation activity.
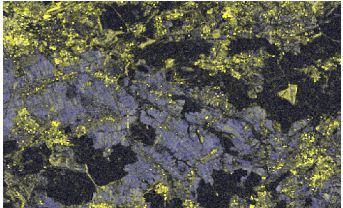
Detailed analysis of the low coherence areas on coherent interferograms from Upper Silesia shows that the volume scattering is the most important factor causing decoherence. This type of decorrelation [1], [7] takes place when the backscattering comes from targets with different elevation within resolution cell [2]. Volumetric scattering case occurring for vegetation targets and decorrelation is a caused by wavelength-order position changes of branches, leaves etc. Operational use of interferometry requires a tool to predict where coherence will be low and another measurement technique should be used. This analysis coud be made with the Interferometric Quality Map (IQM) which will allow to discriminate at least 3 types of areas: permanently decorrelated, permanently correlated and temporary correlated. IQM may be constructed based on typical land use classes because in general case the correlation is related to them. Much more accurate approach present an analysis of a set (at least 4–5) of coherence maps of different temporal baselines and seasons. For Upper Silesia the best results have been obtained with classification of bicolor composition of averaged coherence image and standard deviation over the coherence images set.

Fig. 3. An example of Interferometric Quality Map from Upper Silesia. Black – the areas permanently uncorrelated, blue – correlated temporary, yellow – areas permanently correlated. The map has been composed by color composition of the average from 6 coherence images and standard deviation image calculated from the same 6 coherence images. SLCI data courtesy of ESA
During detailed analysis of interferograms from Upper Silesia the lost of the fringe track due to extremely fast movement have been noted. This effect is especially clear on tandem data with 24 hours of temporal baseline where 3 centimetres of subsidence was found confirmed also with terrestrial leveling surveys.
If the subsidence trough slope increment during a period between SAR acquisitions of an interferogram higher than some centimeters the fringe pattern will present wrong value to too high phase gradient in respect to spatial resolution. The areas affected by subsidence are small (commonly 1 per 2 km). With respect to the typical 20 m spatial resolution of SAR interferograms (typical multilook factor 5 in azimuth direction) the interferometric fringe caused by subsidence may consists of limited number of pixels Fig. 2
.
Taking into consideration C band wavelength and multilooked with factor 5 interferogram the critical value of land subsidence is:
Where fr is a vertical displacement corresponds to one fringe; d is a distance between adjacent pixels centres of multilooked interferogram. For ERS–1 and ERS 2 where fr=3 cm and d=20 m, wcr = 1,5 mm/m wc might be also understand as the limit of changes in terrain inclination due to subsidence. Similar parameter is used for engineering hazard evaluation in Polish coal industry [4]. It uses the 6–step scale for terrain classification according to terrain inclination, curvature, and horizontal deformation.:
Class 0 – up to 0.5 mm/m; Class I – 0,5–2,5 mm/m; Class II – 2,5–5 mm/m; Class III – 5–10 mm/m; Class IV – 10–15 mm/m Class V – more than 15 mm/m
Only inclinations of Class 0 and I might be detected with InSAR. However the classes are usually calculated for total coal removal from exploitation field. Inclination values measured on interferogram of short temporal baseline may inform about incoming hazard when the process will continue in future in the same way.

Fig. 4. An example of interferometric fringes caused by coal mine subsidence.
Some of the presented above limitations of the InSAR measurements with ERS could be potentially improved applying advanced SAR systems as e.g. ASAR on ENVISAT satellite:
1. Improvement of coherence. The vertically polarized signals interact more with vegetation structure and therefore highlight the subtle differences between crops (e. g. barley, wheat). ERS sensors have been principally designed for agriculture and mapping applications. The HH polarization penetrates crops more effectively since such waves are not interacts with vertical structures. In arable lands and some types of forests it creates a chance to minimize with HH signal the volume scattering decorrelations Fig. 4
. The coherence improvement could be also potentially done with application of steeper incidence angle.
2. Improvement of accuracy. The comparison of interferograms from like-polarized SAR data of the same area (VV and HH) may help to extract a phase change due to height of crop cover (important to improve InSAR DEM. With such data might be also possible to detect tropospheric artifacts related to polarization.
The author gratefully acknowledge the European Space Agency and European Space Research Institute for supporting and sponsoring this research and supplying the ERS SAR data from AO3–127 InSAR for Land Subsidence Monitoring in the Upper Silesian Coal Mining Region, Poland
.