
Abstract
Content
- Introduction
- 1 Relevance
- 2 Sewage and composition analysis
- 3 Selecting the method for assessing the concentration of heavy metal ions
- 4 The implementation of the method chosen
- 5 Mathematical modeling of the measuring cell parameters
- Conclusion
- References
Introduction
Waste water containing heavy metals (industrial wastewater), are formed in many areas of industrial production. In this galvanic production is one of the most dangerous sources of environmental pollution, mainly from underground water, due to the formation of a large volume of waste water containing contaminants of heavy metals, inorganic acids and alkalis, surfactants and other highly toxic compounds, and also large quantities of solid waste, in particular from the method of reagent disposal of waste water containing heavy metals form sparingly soluble.
1 Relevance
Waste water containing heavy metals (industrial wastewater), formed in many areas of industrial production. In this galvanic production is one of the most dangerous sources of pollution environment, mainly surface and underground waters, due to the formation of a large the volume of waste water containing heavy metal contaminants, inorganic acids and alkalis, surfactants and other highly toxic compounds, and also large quantities of solid waste, in particular from the method of neutralization reagent wastewater containing heavy metals in the form of poorly soluble.
2 Sewage and composition analysis
The plant uses a hot-dip galvanizing to extend the life of metal parts. This is the most advanced, reliable, highly efficient protection against various types of corrosion. Zinc shell is a protective barrier, which reduces to a minimum the environmental effects of the environment, as well as resistance to mechanical stress. Zinc also provides electrochemical protection, since in contact with the steel it creates a galvanic cell [1].
However, modern electroplating production falls far short of the requirements of time, both in technology and in the field of ecology. When choosing technology electroplating practically does not take into account environmental requirements. Existing galvanic production built on the same technology, designed to solve only one problem - coating or surface treatment of metals - excluding recycling processes and disposal of electroplating waste, and protection of environmental problems. As a result, a significant amount of heavy metals is in the waste water [2].
Cobalt (Co) was chosen as the controlled parameter.
Rivers and lakes are contaminated as a result of leaching cobalt copper and other ores from the soil during decomposition of extinct organisms (animals and plants), and of course as a result of activity of chemical, metallurgical and metal-working enterprises.
MPC cobalt to the aquatic environment is 0.1 mg/l.
3 Selecting the method for assessing the concentration of heavy metal ions
The main method of assessing the concentration of heavy metal ions has been selected - Extraction-photometric method.
To ensure the extraction method sample preparation subsystem is required which must periodically dosing extract, provide its addition to the work cell.
Photometric technology - the core technology for the determination of concentrations of many liquids and gases used in industry percentage levels. [3].
For example, the absorption spectrum of the cobalt thiocyanate solutions depending on the concentration of thiocyanate is shown in Fig. 1 absorption spectra of solutions of cobalt thiocyanate [4].

Figure 1 – The absorption spectra of solutions of cobalt thiocyanate in a concentration dependent thiocyanate: 1 – 0.1 mol×g/L; 2 – 0.25 mol×g/L; 3 – 0.5 mol×g/L; 4 – 0.75 mol×g/L; 5 – mol×g/L
4 The implementation of the method chosen
To implement the extraction-photometric method for measuring the concentration of cobalt (Co) a semiconductor light emitting diode (LED) must be a radiation source with a constant level of radiation, suitable for this purpose. The radiation passes through a diverging lens OB1 and enters the sample to which thiocyanate and is added acetone for binding of cobalt ions and staining it blue. After passing through the sample radiation passes through a converging lens OB2 and fall on the photodetector (OP1). The selected photodiode as a photodetector.
A complete measuring circuit is shown in Fig. 2.

Figure 2 – Block diagram of measuring channel;
5 Mathematical modeling of the measuring cell parameters
To determine the concentration of cobalt ions is necessary to construct a mathematical model of the selected LED and photodiode [5, 6].
The mathematical description of the passage of light through the optical part of the device
LED emission spectrum is shown in Fig. 3. Block diagram of measuring channel

Figure 3 – The spectrum of LED light
For the analytical description of the LED emission spectrum we use an expression like:

where S0 – is spectral power density, which is equal to:
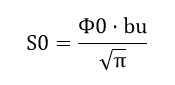
Ф0 – radiation flux at the central wavelength Ф0 = 4.32 мВт;
0u – the central wavelength of the emission spectrum 0u = 625 нм;
bu – coefficient depending on the half-width of the spectrum 0u = 30 нм.
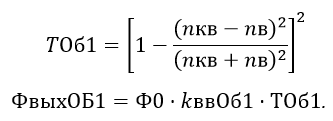
Single-lens transmission factor of the lens with the fused quartz of the lens is defined as:
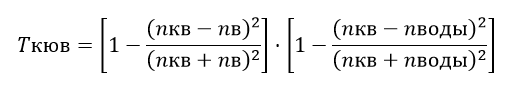
We define a passage through the optical flow cell walls. The transmission coefficient is determined from the condition that the ambient air outside the walls, but inside they are in contact with water (at low concentrations of dissolved substances, they do not affect the coefficient of water refraction).
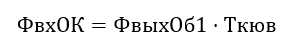
We determine the flow on the input optical channel as:
We define the spectral density of the input stream as:

Next, we perform construction of a mathematical model of cobalt spectrum. For this spectrum will produce an approximation method of least squares:
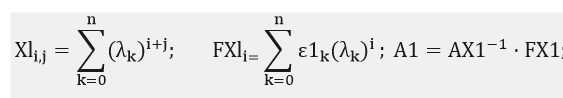
Description approximated dependence is of the form:
The resulting relationship is shown in Fig. 4. Mathematical model of the spectrum of cobalt, least squares approximated

Figure 4 – The mathematical model of the spectrum of cobalt, approximated by the method of least squares
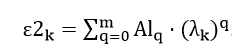
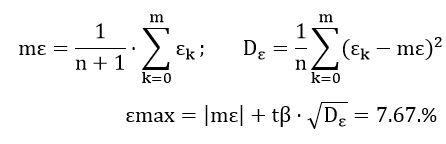
Define the approximation error:
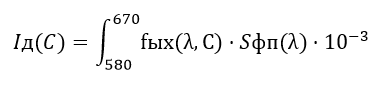
We find the optical density and the light output of the optical channel:

Spectral flux density at the output of the optical channel is described by the expression:

As a photodetector using a photodiode, the spectral sensitivity is described by the expression:

The dependences of the photodiode current on the concentration of cobalt ions:
A plot of the current from the photodiode cobalt ion concentration is shown in Fig. 5. photodiode current dependence on the concentration of cobalt ions [7].

Figure 5 – The current dependence of the photodiode on the concentration of cobalt ions
Conclusion
As Cobalt (Co) is selected as a controlled parameter as thiocyanate complex at a concentration of 0.1 mol×g/l thiocyanate.
The mathematical description of the process of absorption of the radiation in the optical output of the device was produced by. Obtained is dependence of the optical channel. Metrological characteristics of the developed measuring channel were estimated.
In writing this essay master's qualification work is not completed. Date of final completion – June 2017 Full text of work and materials on a work theme can be received from the author or his supervisor after that date.
The text of the abstract is intellectual property, which is forbidden to use or copy without the agreement of the author.
List of sources
- Библиофонд, электронная библиотека студента. Гальваническое производство – электронные данные: [Электронный ресурс ]: – дата доступа: май 2016.
- Вредные вещества в промышленности. Справочник для химиков, инженеров и врачей. Изд. 7–е, пер. и доп. В трех томах. Том 3. Неорганические и элементорганические соединения. Под ред. засл. деят. науки проф. Лазарева Н.В. и докт. биол. наук проф. Гадаскиной И.Д. Л., «Химия», 1977. – 608 с.
- Библиофонд, электронная библиотека студента. Экстракционно-фотометрический метод определения тяжелых металлов в природных водах – электронные данные [Электронный ресурс ]: – дата доступа: май 2016.
- Бабко А.К. и др. Физико-химические методы анализа., 1968. – 335 с.
- Alldatasheet, Electronic Components Datasheet Search. APC3216EC Datasheet (PDF) – Kingbright Corporation – режим доступа [Электронный ресурс ]: – дата доступа: май 2016.
- Hamamatsu. S5344Si APD. – режим доступа [Электронный ресурс ]: – дата доступа: июнь 2016.
- Гусев В.Г., Гусев Ю.М. Электроника: Учебное пособие для приборостроительных специальностей вузов. – 2–е изд., перераб. и доп. – М.: Высшая школа, 1991. – 622 с.