IOSR Journal of
Electrical and Electronics Engineering (IOSRJEEE)
ISSN: 2278-1676
Volume 1, Issue 6 (July-Aug. 2012), PP 13-21
Microcontroller Based Substation Monitoring and Control System with Gsm Modem
Amit Sachan
Department of Energy & Power Engineering
NIMS University, Jaipur, Rajasthan
Abstract : The purpose of this project is to
acquire the remote electrical parameters like Voltage, Current and Frequency
and send these real time values over GSM network using GSM Modem/phone along
with temperature at power station. This project is also designed to protect the
electrical circuitry by operating an Electromagnetic Relay. This Relay gets
activated whenever the electrical parameters exceed the predefined values. The
Relay can be used to operate a Circuit Breaker to switch off the main
electrical supply.
User can send commands in the form
of SMS messages to read the remote electrical parameters. This system also can
automatically send the real time electrical parameters periodically (based on
time settings) in the form of SMS. This system can be designed to send SMS
alerts whenever the Circuit Breaker trips or whenever the Voltage or Current
exceeds the predefined limits.
This project makes use of an onboard
computer which is commonly termed as microcontroller. This onboard computer can
efficiently communicate with the different sensors being used. The controller
is provided with some internal memory to hold the code. This memory is used to
dump some set of assembly instructions into the controller. And the functioning
of the controller is dependent on these assembly instructions. The controller
is programmed using Embedded C language.
Keyworld: GSM Modem, Initialization of ADC
module of microcontroller, PIC-C compiler for Embedded C programming, PIC kit 2
programmer for dumping code into Micro controller, Express SCH for Circuit
design, Proteus for hardware simulation.
I. Introduction
Electricity is an extremely handy
and useful form of energy. It plays an ever growing role in our modern
industrialized society. The electrical power systems are highly non-linear,
extremely huge and complex networks [1]. Such electric power systems are unified
for economical benefits, increased reliability and
operational advantages. They are one of the most significant elements of both
national and global infrastructure, and when these systems collapse it leads to
major direct and indirect impacts on the economy and national security [2]. A
power system consists of components such as generators, lines, transformers,
loads, switches and compensators. However, a widely dispersed power sources and
loads are the general configuration of modern power systems [3]. Electric power
systems can be divided into two sub-systems, namely, transmission systems and
distribution systems. The main process of a transmission system is to transfer
electric power from electric generators to customer area, whereas a
distribution system provides an ultimate link between high voltage transmission
systems and consumer services. In other words, the power is distributed to
different customers from the distribution system through feeders, distributors
and service mains. Supplying electricity to consumers necessitates power
generation, transmission, and distribution [4]. Initially electric power is
generated by using electric generators such as: nuclear power generators,
thermal power generators and hydraulic power generators and then transmitted
through transmission systems using high voltage. Power departs from the
generator and enters into a transmission substation, where huge transformers
convert the generator's voltage to extremely high voltages (155kV to 765 kV)
for long-distance (up to about 300 miles) transmission [4]. Then, the voltage
level is reduced using transformers and power is transferred to customers
through electric power distribution systems. Power starts from the transmission
grid at distribution substations where the voltage is stepped-down (typically
to less than 10kV) and carried by smaller distribution lines to supply
commercial, residential, and industrial users [4]. Novel electric power systems
encompassing of power transmission and distribution grids consist of copious
number of distributed, autonomously managed, capital-intensive assets. Such
assets comprise: 1.) power plants, 2.) transmission lines, 3.) transformers,
and 4.) protection equipment [1].
Electric utility substations are
used in both the transmission and distribution system and operate independently
to generate the electricity. A typical substation facility consists of a small
building with a fenced-in yard that contains transformers, switches, voltage
regulators, and metering equipment that are used to adjust voltages and monitor
circuits [4]. A reliable and efficient process of these networks alone is not
very significant when these electricity systems are pressed to their parameters
of its performance, but also under regular operating conditions. Generators and
loads are some components that coerce the continuous dynamic behavior[5].
The distance between the Generators
and loads may be in terms of hundreds of miles. Hence, the amount of huge power
exchanges over long distances has turned out as a result of the lack of quality
of the electric power. During the earlier development stages the issues on
quality of power were not frequently reported. Quality of supply is a mixture
of both voltage quality and the non-technical features of the interaction from
the power network to its customers. Demanding the quantity of power being
delivered at the user side has raised the alarm due to the increase in demand
of electricity in the customers side. The power
generated at the main stations is transported hundreds of miles using
transmission lines before they reach the substations. A huge amount of power is
lost during the transportation of the generated power which leads to the
reduction in the quantity of power received at the substations. Also the
electric lines users have identified that the number of drawbacks caused by
electrical power quality variations are increasing rapidly. These variations
have already existed on electrical systems, but recently they are causing
serious problems [6]. Therefore, measurements must be acquired either from one
end or from both the ends of a faulted line. Only meager recorded data is
available at limited substation locations in certain systems. When a fault
occurs in such systems, only a few (two or three) recording devices are triggered.
The most likely case is that the measurements could not be obtained at either
or both ends of the faulted transmission line leads to drop in the quality of
the power.
To improve the quality of power with
sufficient solutions, it is necessary to be familiar with what sort of
constraint has occurred. Additionally, if there is any inadequacy in the
protection, monitoring and control of a power system, the system might become
unstable. Therefore, it necessitates a monitoring system that is able to automatically
detect, monitor, typify and classify the existing constraints on electrical
lines. This brings up advantages to both end users and utility companies [6].
In general, distributed control agents are employed to offer reactive control
at several places on the power

network through
the devices namely: 1.) Power System Stabilizers (PSSs), 2.) Automatic Voltage
Regulators (AVRs), 3.) FACTS and much more [3].
Monitoring systems offers an opportunity to record each and every relevant
value that is present in a local database [7]. An effective and well-organized
state of monitoring is much significant in guaranteeing the safe running of
power transformers. Potential breakdown of the power transformers can be
recognized in their incipient phases of development by an excellent state of
monitoring so that the maintenance of the power transformers can be condition
based in addition to periodically scheduled [8].
During the past years a number of
researches were undergone with the help of microprocessors and controllers for
continuous monitoring of sample concentrations, the behavior of analysts at
different time intervals, monitoring the voltage, current and temperature
fluctuations in the distribution transformers at the substations. The level of
current and voltage at the substations may vary drastically due to the increase
in temperature at the distribution transformers. Due to this the quality of
power being delivered to the user might be insufficient. Hence monitoring the
current, voltage and additionally required parameters at the distribution side
can aid in developing both the output generated at the main station and the
quality of power being delivered at the customer side. It is also capable of
recognizing the break downs caused due to overload, high temperature and over
voltage. If the increase in temperature rises higher than the desirable
temperature, the monitoring system will protect the distribution transformer by
shutting down the unit.
As discussed earlier, maintenance of
a transformer is one of the biggest problems in the Electricity Board (EB).
During strange events for some reasons the transformer is burned out due to the
over load and short-circuit in their winding. Also the oil temperature is
increased due to the increase in the level of current flowing through their
internal windings. This results in an unexpected raise in voltage, current or
temperature in the distribution transformer. Therefore, we are proposing the automation
of the distribution transformer from the EBsubstation.
In the automation, we consider the voltage, current and temperature as the
parameters to be monitored as the transformer shows its peak sensitivity for
the same. Hence, we design an automation system based on microcontroller which
continuously monitors the transformer. Because of the microcontroller
operation, the transformer present in the substation which is turned off in the
main station. The rest of the paper is structured as follows. Section 2
presents a brief review of several approaches that are available in the
literature for monitoring of power in distribution systems. Section 3 presents
the technique along with its algorithm for monitoring and controlling the
essential parameters of the distribution transformers using the system based on
microcontroller. Section 4 details the three case studies analyzed in the paper
and section 5presents the conclusion.
II. Related Works
The process of rebuilding in the
field of electricity industry results in a need of innovative techniques for
representing a huge quantity of system data. Over bye and Weber [9] have
presented a summary on various visualization techniques that might fairly be
helpful for the representation of the data. The techniques such as: 1.)
contouring, 2.) animation, 3.) data aggregation and, 4.) virtual environments
must prove to be quite useful. Yet, important challenges remain. The major
challenges are: 1.) the problem of visualizing not just the state of a existing system but also the potentially huge number of
incident states, and, 2.) the problem of visualizing not just the impact of a
solitary proposed power transfer but of a great number of such transactions.
Johan Driesen
et al.[10] have discussed the model of an flexible energy
measurement system consisting of a DSP, sensor and communication units. The
modern electricity distribution networks utilizes this system, featured by
multiple suppliers in a deregulated market, bi-directional energy flows owing
to the distributed generation and a diversified demand for the quality of
electricity delivery. Different features of the system relating to signal
processing, communication and dependability were discussed. Their work also
includes the examples of the use of such devices.
Daponte et al. [6] have discussed the
design and implementation of Transient meter, a monitoring system for the
detection, classification and measurement of disturbances on electrical power
systems. CORBA architecture is utilized as communication interface by the
Transient meter, wavelet-based techniques for automatic signal classification
and characterization, and a smart trigger circuit for the detection of
disturbances. A measurement algorithm, developed by using the wavelet transform
and wavelet networks, had been adopted for the automatic classification and
measurement of disturbances.
The results that are obtained after
the process of monitoring a distribution transformer during a period of 18
months was described and discussed by Humberto
Jimenez et al. [11]. The transformer fed several households, each with a grid
connected photovoltaic system, and it was identified that the power factor at
the transformer attained strange low levels. This was because of the fact that
under some circumstances, the systems offers a great portion of the active
power that is demanded by the households, whereas the grid supplied all there
active and distortion powers. The operating temperature was used as an
indicator for the pressure on transformer. The temperature level was least when
the systems were providing the maximum energy available from the solar cells.
Power quality monitoring systems are
capable of detecting disturbances by means of Mathematical Morphology (MM) very
quickly. Yet, the signal under examination is frequently corrupted by noises,
and the performance of the MM would be greatly degraded. Sen
Ouyang and Jianhua Wang
[12] have presented a quick process in order to detect the transient
disturbances in a noisy atmosphere. In this approach, the suitable morphologic
structure element, appropriate mixture of the erosion and the dilation
morphologic operators can develop the capability of MM. In addition, the
soft-threshold denoising technique based on the
Wavelet Transform (WT) was used for purpose of reference. Thus the abilities of
the MM can hence be restored. This technique has possessed the following
merits: 1.) Great speed in calculation, 2.) easy implementation of hardware
and, 3.) better use value. At last, the validity of the proposed technique is
demonstrated by the outcome of the simulation and the actual field tests.
The propagation of non-linear and
time-variant loads leads to a copious number of disturbances on the electric
network, from an extremely significant distortion of both currents and
voltages, to transient disturbances on the supply voltage. In this respect the
electric network behaves as a “healthy carrier” of disturbances, so that a
disturbance generated by single customer can be distributed to other customers,
causing possible damages to their equipment. Evaluating the quality of the
electric power that is present in a network section is consequently becoming an
impelling requirement, mainly in a deregulated electricity market, where every actor
can be in charge for the injection of disturbances. Yet, there are several
respects of power-quality measurement, from both the methodological and
instrumental point of views that are been unsolved yet and needs to be analyzed
cautiously. An analysis of these problems and various suggestions about the
development of the present research work on this area has been presented by
Alessandro Ferrero [13].
Real-time monitoring of power
quality necessitates great abilities of data-handling and data-processing.
These requirements limit the possibility of monitoring, in spite of the fact
that microprocessor-based monitoring systems have observed vital development in
their storage and computational power. Development of compact algorithms will
benefit power quality in the following two ways: 1.) they will allow monitoring
of more points simultaneously for large systems, and, 2.) they will help in
building powerful embeddable monitoring architectures within small power
devices, such as a breaker, motors, or power drives. Antonio Ginart et al. [14]have proposed
the use of the distance L1 norm as an indicator of power quality. They have
shown how their approach has enhanced the computational and storage
requirements. Their work has presented: 1.) analyses of the proposed norm, 2.)
how it compared with traditional approaches, and, 3.) examples of its
applications.
Modulation:
Modulation is a form of change
process where we change the input information into a suitable format for the
transmission medium. We also changed the information by demodulating the signal
at the receiving end. The GSM uses Gaussian Minimum Shift Keying (GMSK)
modulation method.
Access Methods:
Because radio spectrum is a limited
resource shared by all users, a method must be devised to divide up the bandwidth
among as many users as possible. GSM chose a combination of TDMA/FDMA as its
method. The FDMA part involves the division by frequency of the total 25 MHz
bandwidth into 124 carrier frequencies of 200 kHz bandwidth. One or more
carrier frequencies are then assigned to each BS. Each of these carrier
frequencies is then divided in time, using a TDMA scheme, into eight time
slots. One time slot is used for transmission by the mobile and one for
reception. They are separated in time so that the mobile unit does not receive
and transmit at the same time.
Transmission Rate:
The total symbol rate for GSM at 1
bit per symbol in GMSK produces 270.833 K symbols/second. The gross
transmission rate of the time slot is 22.8 Kbps. GSM is a digital system with
an over-the-air bit rate of 270kbps.
Frequency Band:
The uplink frequency range specified
for GSM is 933 - 960 MHz (basic 900 MHz band only). The downlink frequency band
890 - 915 MHz (basic 900 MHz band only).
Channel Spacing: This indicates separation between adjacent carrier frequencies. In GSM,
this is 200 kHz.
GSM Commands:
Commands always start with AT (which
means Attention) and finish with a <CR> character.
Information responses and result codes
Responses start and end with
<CR><LF>, except for the ATV0 DCE response format) and the ATQ1 (result
code suppression) commands.
_ If
command syntax is incorrect, an ERROR
string is returned.
_ If command syntax is correct but
with some incorrect parameters, the +CME
ERROR:
<Err> or +CMS ERROR: <Sms Err> strings are
returned with different error codes.
_ if the
command line has been performed successfully, an OK string is returned. In some
cases, such as “AT+CPIN?” or (unsolicited) incoming events, the product does
not return the OK string as a response.
In the following examples <CR> and <CR><LF> are intentionally omitted.
1. Manufacturer identification +CGMI
2. Request model identification
+CGMM
3. Request revision identification
+CGMR
4. Product Serial Number +CGSN
Preferred Message Format +CMGF
Description:
The message formats supported are text mode and PDU mode. In PDU mode, a
complete SMS Message including all header information is given as a binary
string (in hexadecimal format). Therefore, only the following set of characters
is allowed: {„0‟,‟1‟,‟2‟,‟3‟,‟4‟,‟5‟,‟6‟,‟7‟,‟8‟,‟9‟,
„A‟, „B‟,‟C‟,‟D‟,‟E‟,‟F‟}.
Each pair or characters are converted to a byte (e.g.: „41‟ is converted
to the ASCII character „A‟, whose ASCII codes is 0x41 or 65). In Text
mode, all commands and responses are in ASCII characters. The format selected
is stored in EEPROM by the +CSAS command.
Command syntax: AT+CMGF
Read message +CMGR
Description:
This command allows the application to read stored messages. The messages are
read from the memory selected by +CPMS command.
Command syntax: AT+CMGR=<index>
Send message +CMGS
Description:
The <address> field is the address of the terminal to which the message
is sent. To send the message, simply type, <ctrl-Z> character (ASCII 26).
The text can contain all existing characters except <ctrl-Z> and
<ESC> (ASCII 27). This command can be aborted using the <ESC>
character when entering text. In PDU mode, only hexadecimal characters are used
(„0‟…‟9‟,‟A‟…‟F‟).
Syntax:
AT+CMGS= <length> <CR>
PDU is entered <ctrl-Z / ESC >
Modem Specifications:
The SIM300 is a complete Tri-band
GSM solution in a compact plug-in module.
Featuring an industry-standard
interface, the SIM300 delivers GSM/GPRS900/1800/1900Mhzperformance for voice,
SMS, data and Fax in a small form factor and with low power consumption. The leading
features of SIM300 make it deal fir virtually unlimited application, such as
WLL applications (Fixed Cellular Terminal), M2M application, handheld devices
and much more.
1. Tri-band GSM module with a size of
40x33x2.852.
2. Customized MMI and keypad/LCD support
3. An embedded powerful TCP/IP protocol
stack
4. Based upon mature and field proven
platform, backed up by our support service, from definition to design and
production.
SIM Hardware Interface Description
Features of SIM300:
1. Power supply: Single supply
voltage 3.4V - 4.5V
2. Power saving: typical power
consumption in SLEEP mode to 2.5mA
3. Frequency bands: SIM300 Tr-band:
EGSM 900, DCS 1800, PCS 1900. The band can be set by
ATCOMMAND, and default band is EGSM 900 and DCS 1800.
4. Temperature range:
Normal operation: -20°C to +55°C ,
Restricted operation: -25°C to -20°C and +55°C to +70°C, Storage temperature
-40°C to +80°C
SIM interface: Supported SIM card:
1.8V, 3V
External antenna: Connected via 50
Ohm antenna connector or antenna pad
Serial port 1
Port/TXD @ Client sends data to the
RXD signal line of module
Port/RXD @ Client receives data from
the TXD signal line of module
Serial port 2
Port/TXD @ Client sends data to the
DGBRXD signal line of module
Port/RXD @ Client receives data from
the DGBTXD signal line of module
All pins of two serial ports have
8mA driver, the logic levels are described in following table:
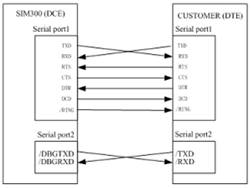
Serial port 1
1. Seven lines on Serial Port Interface
2. Contains Data lines /TXD and /RXD,
State lines /RTS and /CTS, Control lines /DTR, /DCD and RING;
3. Serial Port 1 can be used for CSD
FAX, GPRS service and send AT command of controlling module. Serial Port 1 can
use multiplexing function, but you cannot use the Serial Port 2 at the same
time;
4. Serial Port 1 supports the
communication rate as following: 1200, 2400, 4800, 9600, 19200, 38400, 57600,
and 115200 Default as 115200bps.
5. Autobauding supports the communication rate as
following: 1200, 2400, 4800, 9600, 19200, 38400, 57600, and 115200bps.
Serial port 2: Two lines on Serial Port Interface
1. Only contains Data lines /TXD and
/RXD
2. Serial Port 2 only used for
transmitting AT command. It cannot be used for CSD call, FAX call. And the
Serial port 2 can not use multiplexing function;
3. Serial port 2 supports the
communication rate as following: 9600, 19200, 38400, 57600, 115200
III. Proposed Microcontroller Based System For
Substation Monitoring
Distributed transformers are prone
to damages due to the raise in oil temperature when
there is an overload or huge current flows through the internal winding of the
transformer. When the oil temperature rises, it increases the probability of
getting damages in the transformers. The transformers are to be monitored very
cautiously during these situations. The proposed system consists of a
monitoring unit that is connected with the distribution transformer for the
purpose of monitoring the same. Hence, we introduce a simulation model which
details the operation of the system to rectify the mentioned problem. The
monitoring system is constituted by three major units, namely,
1. Data processing and transmitter
unit
2. Load and Measurement Systems
3. Receiver and PC display unit
We have designed a system based on
microcontroller 16F877A that monitors and controls the voltage, current and oil
temperature of a distribution transformer present in a substation. The
monitored output will be displayed on a PC at the main station that is at a
remote place, through ADC
Communication. The parameters monitored at the
distribution transformer are compared with the rated values of the transformer.
Additionally the breakdowns caused due to the overload and high voltage are sensed
and the signals are transmitted to the main station using ADC communication.
The software in the PC compares the received values with the rated measurements
of the distribution transformer and shuts down the transformer so that it can
be prevented from damages and Performances can be enhanced quiet to a
remarkable level.
The controller consists of a sensing
unit which collects the essential parameters such as current, voltage and the
oil temperature within the distribution transformer. The digital display
connected to the processing unit displays corresponding parameter values at the
substation for any technical operations. The controller also senses the
overload and high current flow conditions in the internal windings that may
lead to breakdown of the corresponding unit. The microcontroller is programmed
in such a manner so as to continuously scan the transformer and update the
parameters at a particular time interval. The parameter values sensed by the
microcontroller are transmitted through the ADC transmitter connected to the
microcontroller unit.

SIM card interface
You can use AT Command to get
information in SIM card. The SIM interface supports the functionality of the
GSM Phase 1 specification and also supports the functionality of the new GSM
Phase 2+specification for FAST 64 kbps SIM (intended for use with a SIM
application Tool-kit). Both 1.8V and 3.0VSIM Cards are supported. The SIM
interface is powered from an internal regulator in the module having nominal
voltage 2.8V. All pins reset as outputs driving low.
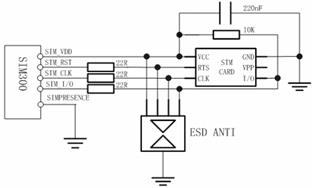
Figure: SIM interface reference
circuit with 6 pins SIM card
Monitoring and controlling by the
proposed system
The values of voltage, current and temperature
of the transformer is directly applied to one of the input ports of the
microcontroller. Along with this, a display is connected in the input port of
the microcontroller. The GSM transmitting section and the load variation
control are connected to the one of the output ports in the microcontroller).
The monitoring PC is connected to the main station. The microcontroller at the substation
monitors and captures the current, voltage and temperature values for a
particular period of time interval. The captured values are stored in the data
register and displayed using the LCD display.
The monitored voltage, current and
temperature values of the transformer are transmitted using the RF transmitter
for each and every time interval. Any antenna tuned for the selected RF
frequency can be utilized for the transmission of the RF signal but the antenna
has to exhibit a unidirectional radiation pattern. In the receiver side of the
proposed system, the receiver antenna converts the RF signal into electrical
signal and acquires the information which has been transmitted by the
transmitter. Based on the received information, controlling operation is
performed. If the receiver receives the transformer parameters which is greater
than the fixed threshold level, then immediately the units is shutdown so as to
protect the same.
Design Procedures
The design procedures for the
proposed microcontroller based system is described as follows
Define the interfacing parameters
for LCD and Data Registers.
Assign a value for the circuit elements
such as Relay, LED, Buffer and Fan.
Initialize the input and output
ports of the microcontroller.
The functions defined for capturing
the current, voltage and temperature values are called and executed.
The displaying function is called
and the parameter values are displayed.
Design Considerations:
Before starting a project there are
several ways to design a PCB and one must be chosen to suit the project’s
needs.
Single sided, or double sided:
When making a PCB you have the
option of making a single sided board, or a double sided board. Single sided
boards are cheaper to produce and easier to etch, but much harder to design for
large projects. If a lot of parts are being used in a small space it may be
difficult to make a single sided board without jump ring over traces with a
cable. While there’s technically nothing wrong with this, it should be avoided
if the signal traveling over the traces is sensitive (e.g. audio signals).
A double sided board is more
expensive to produce professionally, more difficult to etch on a DIY board, but
makes the layout of components a lot smaller and easier. It should be noted
that if a trace is running on the top layer, check with the components to make
sure you can get to its pins with a soldering iron. Large capacitors, relays,
and similar parts which don’t have axial leads can NOT have traces on top unless
boards are plated professionally.
Ground-plane or other special purposes for one side:
When using a double sided board you
must consider which traces should be on what side of the board. Generally, put
power traces on the top of the board, jumping only to the bottom if a part
cannot be soldiered onto the top plane (like a relay), and vice- versa.
Power supplies or amps can benefit
from having a solid plane to use for ground. In power supplies this can reduce
noise, and in amps it minimizes the distance between parts and their ground
connections, and keeps the ground signal as simple as possible. However, care
must be taken with stubborn chips such as the TPA6120amplifier from TI. The
TPA6120 datasheet specifies not to run a ground plane under the pins or signal
traces of this chip as the capacitance generated could effect
performance negatively.
Circuit Description:
The LCD panel's Enable and Register
Select is connected to the Control Port. The Control Port is an open collector
/ open drain output. While most Parallel Ports have internal pull-up resistors,
there is a few which don’t. Therefore by incorporating the two 10K external
pull up resistors, the circuit is more portable for a wider range of computers,
some of which may have no internal pull up resistors.
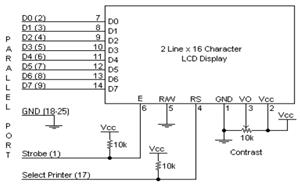
We make no effort to place the Data
bus into reverse direction. Therefore we hard wire the R/W line of the LCD
panel, into write mode. This will cause no bus conflicts on the data lines. As
a result we cannot read back the LCD's internal Busy Flag which tells us if the
LCD has accepted and finished processing the last instruction. This problem is
overcome by inserting known delays into our program.
The 10k Potentiometer controls the
contrast of the LCD panel. Nothing fancy here. As with all the examples, I've
left the power supply out. We can use a bench power supply set to 5v or use an onboard
+5regulator. Remember a few de-coupling capacitors, especially if we have
trouble with the circuit working properly.
Advantages:
1. Devices can be operated from
anywhere in the world.
2. Feedback of the devices being
operated is present.
3. Efficient and low cost design
4. Low power consumption.
5. Real time monitoring.
Disadvantages:
1. Depends on the network signal
strength.
Applications:
1. This system can be
implemented in industries.
2. This system can be used to
monitoring and controlling the home appliances.
IV. Result:
The project
“MICROCONTROLLER BASED SUBSTATION MONITORING AND CONTROL SYSTEM WITH GSM MODEM”
was designed such that the devices can be monitored and also controlled from
anywhere in the world using GSM modem connected to mobile phone.
V. Conclusion:
Integrating
features of all the hardware components used have been developed in it.
Presence of every module has been reasoned out and placed carefully, thus
contributing to the best working of the unit. Secondly, using highly advanced
IC‟s with the help of growing technology, the project has been
successfully implemented. Thus the project has been successfully designed and
tested.
VI. Future Scope:
Our project
MICROCONTROLLER BASED SUBSTATION MONITORING AND CONTROL SYSTEM WITH GSM MODEM is
mainly intended to operate the devices like fans, lights, motors etc.., through
a GSM based mobile phone. The system has a GSM modem, temperature, current,
voltage sensors and the devices to be operated through the switches like Relay
which are interfaced to the micro controller. The micro controller is
programmed in such a way that if a particular fixed format of sms is sent to GSM modem from mobile phone, which is fed as
input to the micro controller which operates the appropriate devices. A return
feedback message will be sent to the mobile from GSM modem. The temperature at
the place where devices are being operated can be known.
In future we can
use this project in several applications by adding additional components to
this project.
This project can
be extended by using GPRS technology, which helps in sending the monitored and
controlled data to any place in the world. The temperature controlling systems
like coolant can also use in places where temperature level should be
maintained.
By connecting wireless
camera in industries, factories etc we can see the
entire equipments from our personal computer only by
using GPRS and GPS technology. The monitoring and controlling of the devices
can be done from the personal computer and we can use to handle so many
situations. By connecting temperature sensor, we can get the temperature of
dangerous zones in industries and we can use personal computer itself instead
of sending human to there and facing problems at the field. The temperature
sensor will detect the temperature and it gives information to the micro
controller and micro controller gives the information to the mobile phone from
that we can get the data at pc side.
References
[1]. Jyotishman Pathak, Yuan Li, Vasant
Honavar and James D. McCalley,
"A Service-Oriented Architecture for Electric Power Transmission System Asset Management", In ICSOC Workshops, pp: 26 37, 2006.
[2]. B. A. Carreras, V. E. Lynch, D. E.
Newman and I. Dobson, "Blackout Mitigation Assessment in Power
Transmission Systems", Hawaii International
Conference on System Science, January 2003.
[3]. Xiaomeng Li and Ganesh K. Venayagamoorthy,
"A Neural Network Based Wide Area Monitor for a Power System", IEEE Power Engineering Society
General Meeting, Vol. 2, pp: 1455-1460, 2005.
[4]. Argonne National Laboratory,
"Assessment of the Potential Costs and Energy Impacts of Spill Prevention,
Control, and Countermeasure equirements
for Electric Utility Substations", Draft Energy Impact Issue Paper, 2006.
[5]. R.R. Negenborn,
A.G. Beccuti, T. Demiray,
S. Leirens, G. Damm, B. De Schutter and M. Morari,
"Supervisory hybrid model predictive control for
voltage stability of power networks", Proceedings
of the 2007 American Control Conference, New
York, New York, pp:
5444-5449, July 2007.
[6]. Daponte, M. Di Penta and G.Mercurio,
"TRANSIENTMETER: A Distributed Measurement System for Power Quality
Monitoring", IEEE
Transactions on Power Delivery, Vol. 19, Issue.
2, pp: 456-463, 2004.
[7]. G. Pudlo,
S. Tenbohlen, M. Linders
and G. Krost, "Integration of Power Transformer
Monitoring and Overload Calculation into the Power
System Control Surface", IEEE/PES
Transmission and Distribution Conference and Exhibition, Vol. 1, pp: 470-474 Asia Pacific, 2002.
[8]. Zhi-Hua Zhou, Yuan Jiang, Xu-Ri Yin, and Shi-Fu
Chen, "The Application of Visualization and Neural Network Techniques in a
Power Transformer Condition Monitoring System", In: T. Hendtlass and M. Ali eds. Lecture Notes in Artificial
Intelligence 2358, Berlin: Springer- Verlag, pp: 325-334, 2002.
[9]. Overbye and Weber, "Visualization of power system data", in proceedings of 33rd Annual Hawaii International Conference
on System Sciences, January 2000.
[10]. Johan Driesen
, Geert Deconinck, Jeroen
Van Den Keybus, Bruno Bolsens,
Karel De Brabandere, Koen Vanthournout, Ronnie Belmans,
"Development of a Measurement System for Power Quantities in Electrical
Energy Distribution Systems", in proceedings
of IEEE Instrumentation and Measurement Technology
Conference, Anchorage, AK, USA, May 2002.
[11]. Humberto Jimenez, Hugo Calleja, Raúl González, Jorge Huacuz
and Javier Lagunas, "The impact of photovoltaic systems on distribution transformer: A case study", Energy Conversion
and Management, Vol.47, No.4, pp.311-321, March 2006.
[12]. Sen Ouyang and Jianhua
Wang, "A new morphology method for enhancing power quality monitoring
system", International Journal of Electrical Power & Energy Systems Vol.29, No.2, pp.121-128, February 2007.
[13]. Alessandro Ferrero,
"Measuring electric power quality: Problems and perspectives",
Measurement, Vol.41, No.2, pp.121-129, February 2008.
[14]. Antonio Ginart,
Irtaza Barlasa, Sashank Nanduria, Patrick Kalgrena and Michael J. Roeme,
"An L1 norm for efficient power quality monitoring",
Electric Power Systems Research ,Vol. 79, No. 11, pp. 1495-1502, November 2009.
Books
[1] Microcontrollers Architecture,
Programming, Interfacing and System Design - Raj kamal
[2] Embedded Systems - Mazidi and Mazidi.
[3] PCB Designe
Tutorial -David.L.Jones.
[4] PIC Microcontroller Manual - Microchip.
[5] Piezoelectric Sensor Module-
Murata.
[6] Embedded C -Michael.J.Pont.
Thesis
[1] Amit sachan “Microcontroller based
substation monitoring & Control system with GSM modem”