
Abstract
Content
- Introduction
- 1. Relevance of the topic
- 2. Purpose and objectives of the study, planned results
- 3. Overview of existing tools
- 4. Prediction Methods
- 4.1 Moving Average Method
- 4.2 Exponential Smoothing Method
- 4.3 Neural Networks
- 5. Mathematical statement of the research problem
- Conclusions
- List of used sources
Introduction
Intelligent system (IS) – an automated system based on knowledge, or a set of software, linguistic and logical-mathematical tools for the implementation of the main task – implementation of support for human activities and information retrieval in the mode of advanced dialogue in natural language. [1]
In IS decision-making technologies – it is an information-computing system with intelligent support that solves problems without human intervention – decision maker. [2]
The resources of any organization are constantly in a state of flux. At any given time, there is more or less inventory, cash, incoming and outgoing accounts. Even a relatively small enterprise must process a large amount of information. The speed with which this information changes makes it necessary for management to use formal methods for collecting and processing information.
It is necessary to organize deliveries in such a way that the products in the enterprise's warehouses are sufficient to meet the needs of customers in the enterprise's products for a certain period of time. The time for which the stock of the enterprise's products should be enough is determined depending on how much time is required to eliminate the most common causes of failures in the enterprise.
The paper considers a pharmacy network enterprise with a large range of products. The company needs from time to time to search for suppliers of products and organize its delivery to the places of sale.
Effective inventory management enables a business to meet or exceed customer expectations by building inventory of each item that maximizes bottom line. [3]
1. Relevance of the topic
The situation on the market is unpredictable, and it inevitably affects the production process. Not a single specialist undertakes to name the exact figure of how many products will be sold next month. However, it is still necessary to plan the work of the enterprise, therefore, the volume of sales for future periods is determined with some degree of probability either with the help of experts or with the help of special software.
Thus, a modern enterprise faces a number of tasks related to ensuring optimal inventory levels. This implies the need to create special software.
The developed system will be intended for use in the supply department, because it is this department that determines the company's needs for certain goods, as well as organizing their storage and distribution.
2. Goal and tasks of the research
Goal of creating – reducing the costs of the enterprise in the process of purchasing goods, by optimizing the planning of purchases.
Tasks to accomplish the goal:
- perform an analysis of the functioning of the enterprise for the organization and management of product inventories;
- analyze existing methods for drawing up a procurement plan;
- identify the factors that affect product inventory management;
- to identify possible risks arising from the management of inventory volumes;
- develop algorithms for each of the procurement models;
- develop algorithms for forecasting prices and sales volumes;
- develop an algorithm for determining the optimal procurement strategy.
Object of research: activities of managers of purchasing logistics departments of a pharmacy chain.
Subject of research: organization of inventory management in a warehouse using modern modeling and forecasting methods.
Intended scientific novelty:
- development of a simulation mathematical model that allows you to manage the procurement strategy;
- development of algorithms for forecasting prices and sales volumes based on neural networks.
3. Overview of existing tools
There are many systems on the market designed to manage purchases. Below are some of the largest programs.
SAP Ariba
The first system in the list of purchasing software developed by Supply Chain Digital (release May 2020), it offers a series of solutions in the field of management of suppliers, sales, customer services. With SAP Ariba, companies can fully digitize and simplify their cost management processes in an integrated cloud platform. [4, 7] The solution includes strategic modules to perform various – from supplier management and cost analysis to procurement and contracts – which allows companies to optimize their purchasing and cost management processes, identify opportunities for savings and build a stable supply chain based on a single source of reliable information. Users also become part of the largest B2B network where companies can interact with each other, collaborate digitally and transact with millions of suppliers and partners through virtual channels. [9]
The system implements the following functions:
- selection of goods and services;
- enforce compliance and create order;
- order receipt and reconciliation;
- guided purchasing;
- certified security technologies with ERP systems;
- single tool for purchasing management.
The solution is designed for large and medium-sized organizations that want to digitalize all their procurement and supply processes – from supplier selection to contract signing. SAP Ariba Snap is an appropriate extension of the Ariba portfolio for high-growth companies.
The appearance of the program is shown in Figure 1.
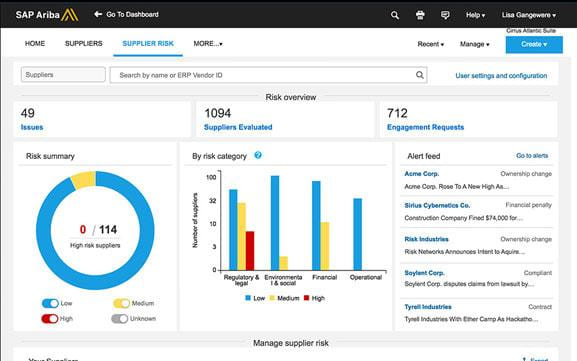
Figure 1 – SAP Ariba interface
Oracle: Supply chain and manufacturing.
An equally popular system is provided by Oracle. This is a solution for managing direct and indirect costs at different stages of procurement (contract, purchase and payment). This platform also facilitates relationships with suppliers through interaction devices and document exchange. Oracle makes it possible to automate the processes of production planning and logistics management at different levels: from daily shop floor planning and management, with operational quality control of products, to integrated scheduling of production, including for a group of enterprises. [4, 6]
Oracle provides the following features:
- demand management;
- supply planning;
- sales and operations planning;
- collaboration with the supply chain. [6]
The appearance of the program is shown in Figure 2.
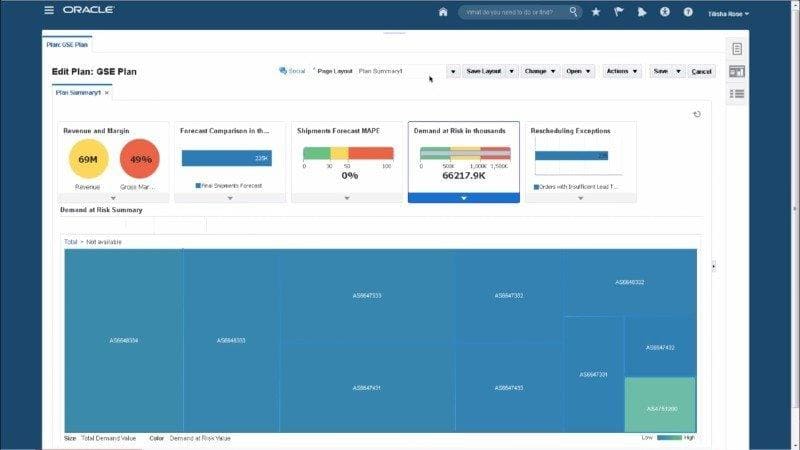
Figure 2 – Oracle interface
Microsoft Dynamics AX (Axapta).
Multifunctional ERP enterprise resource management system for medium and large companies. Axapta provides the following features:
- management of a group of companies;
- cash flow management; optimization of purchases and warehouse operations;
- minimizing inventory through a variety of planning methods;
- production cycle optimization and flexible production planning. [5]
The main modules of the Axapta system are:
- finance;
- trade and logistics;
- production;
- e-commerce;
- personnel management;
- projects;
- customer relationship management (CRM);
- knowledge management
- supply chain management and others. [10]
The appearance of the program is shown in Figure 3.
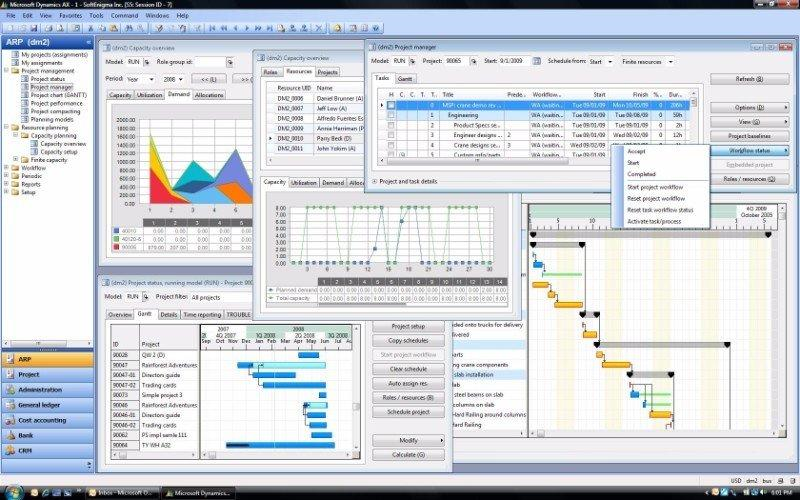
Figure 3 – MX Axapta interface
The tools presented above have a wide range of functions and have the following advantages:
- purchase planning capability;
- the ability to maintain counterparties;
- the ability to keep records of products;
- availability of statistics and infographics;
- the ability to work in the cloud.
These tools are good representatives in their field, but also have a number of disadvantages:
- can be used only with a paid subscription;
- lack of detailed instructions for use;
- opacity of prediction methods.
During the comparison of the presented tools, it was revealed that the systems have extensive functionality and have many advantages. But due to the lack of free versions, their use becomes available to a smaller circle of users. Also, a disadvantage for systems and an advantage for the system being developed is the availability of procurement planning for all four procurement planning models.
4. Prediction Methods
The task of predicting data from a historical, i.e. the accumulated array of values of sales volumes and prices can be solved in several ways.
The first group of predictive models – models based on game theory (Nash equilibrium models, Cournot model, Bertrand model, etc.).
The second group of models includes the so-called imitative or fundamental models. Given that these models require a large amount of initial data, their use for short-term forecasting is limited.
The third group of predictive models is based on the analysis of time series, which uses a set of mathematical and statistical methods designed to identify the structure of time series, study the historical dynamics of the studied indicators and extrapolate them to the future.
In this group of predictive models, there are two subgroups: traditional statistical models and artificial intelligence models.
Representatives of artificial intelligence models are predictive models based on neural networks. Using these models allows you to associate the indicator under study with a set of various factors (not only historical values) and extrapolate its value to the future.
4.1 Moving Average Method
One of the most commonly used time series alignment methods – moving average method, because it is easy to understand and implement. Moving averages are commonly used with time series data to smooth out short-term fluctuations and highlight major trends or cycles. The method is used for short-term forecasting:
yt+1 = mt-1 + 1/n(yt - yt-1)
where t + 1 – forecast period; t – the period preceding the forecast period (year, month, etc.); yt+1 – predicted indicator; mt-1 – moving average for two periods before the forecast; n=3 – the number of levels included in the smoothing interval; yt – the actual value of the phenomenon under study for the previous period; yt-1 – the actual value of the phenomenon under study for two periods preceding the forecast. [8]
To determine the moving average, enlarged intervals are formed, consisting of the same number of levels. Each subsequent interval is obtained by a gradual shift from the initial level of the dynamic range by one level. The first interval includes levels y1, y2, .... ym; the second - levels y2, y3, .... ym+1, etc. Thus, the smoothing interval, as it were, slides along the dynamic series with a step equal to one. Based on the formed enlarged intervals, the sum of the values of the levels is determined, on the basis of which the moving averages are calculated. [11]
Mathematical formulation of the problem for the moving average method: given an array of prices for the previous days. It is necessary to predict prices for the forecasted future period. For price forecasting for purchase planning:
yt+1 = mt-1 + 1/n(yt - yt-1)
where t + 1 – forecast date; t – previous date; yt+1 – projected price; mt-1 – moving average two days before the forecast; n– the number of levels included in the smoothing interval; yt – price value for the previous date; yt-1 – the price value two days before the forecast date.
A smoothing interval is defined for a time series. If it is necessary to smooth out small random fluctuations, then the smoothing interval is taken as large as possible; the smoothing interval is reduced if it is necessary to preserve smaller fluctuations. Other things being equal, it is recommended to take the smoothing interval odd.
These calculations will be repeated until the date we are interested in.
The algorithm is also applicable for forecasting sales volumes.
Advantages:
- simplicity, ease of interpretation;
- use in short-term forecasting;
- possibility of easy geometric interpretation;
- does not conflict with other methods.
Disadvantages:
- shortening the smoothed row compared to the actual row, which leads to loss of information;
- subjectivity of the choice of order (averaging period);
- the impossibility of expressing a trend trend in an analytical form;
delay
of the method (the average reacts weakly to sharp reversals);- applicable only for series with a linear trend;
- use of a large amount of information.
Conclusion: The method is simple and easy to use, but has many disadvantages that increase the prediction error.
4.2 Exponential Smoothing Method
Exponential time series smoothing – a modification of the least squares method for time series analysis, in which more recent observations are given more weight, in other words, the weights of the points of the series decrease (exponential law) as they move into the past.
The calculation is carried out using exponentially weighted moving averages. The exponential smoothing method is most effective in developing medium-range forecasts.
Ut+1 = aYt + (1-a)Ut
where t – the period preceding the forecast; t+1 – forecast period; Ut+1 – predicted indicator; a– smoothing parameter; Yt – the actual value of the indicator under study for the period preceding the forecast; Ut – exponentially weighted average for the period preceding the forecast period.
The optimal value of the smoothing parameter a is calculated by the formula:
a=2/n+1
where n – the number of observations included in the smoothing interval.
To select Uo (exponentially weighted mean initial) as Uo, use the original first value of the forecast base. [8]
Mathematical formulation of the problem for the exponential smoothing method: given an array of prices for the previous days. It is necessary to predict prices for the forecasted future period. For price forecasting for purchase planning:
Ut+1 = aYt + (1-a)Ut
where t – previous date; t+1 – forecast date; Ut+1 – projected price; a– smoothing parameter; Yt – price for the previous date; Ut – exponentially weighted average of the previous date.
The optimal value of the smoothing parameter a is calculated by the formula: a= 2/n +1, where n – the number of observations included in the smoothing interval. When making forecasts using the exponential smoothing method, one of the main problems is choosing the optimal value of the smoothing parameter a. It is clear that for different values, the forecast results will be different. If a is close to unity, then this leads to taking into account in the forecast mainly the influence of only the latest observations; if it is close to zero, then the weights by which sales volumes in the time series are weighed decrease slowly, i.e. all (or almost all) observations are taken into account when forecasting.
Exponential weighted average initial will be equal to the first value of the price from the data array.
These calculations will be repeated until the date we are interested in.
The algorithm is also applicable for forecasting sales volumes.
Advantages:
- ease of implementation;
- used for medium-range forecasting;
- requires a small amount of information.
Disadvantages:
- difficulty in selecting the value of the smoothing constant;
- The future forecast depends on the accuracy of the previous forecast.
Conclusion: the method is useful for medium-term forecasts, easy to implement, but has a significant drawback – selection of a constant smoothing value, on which the accuracy of the calculation depends.
4.3 Neural networks
Another popular forecasting method is forecasting using artificial neural networks.
Artificial Neural Networks (ANN) – these are mathematical models, as well as their software or hardware implementations, built on the principle of organization and functioning of biological neural networks – networks of nerve cells of a living organism.
Neural network forecasting method, suitable for solving linear and complex problems, as well as for classification problems. The training of the neural network depends on the values of the weight coefficients. The neural network approach allows solving problems of different scales.
The main feature of the network, indicating its broad capabilities and high potential, is a technique that allows you to significantly speed up the process of processing information, and the network becomes resistant to errors that may occur on some lines. [8]
General forecasting algorithm using a neural network shown in Figure 4.
Figure 4 — General forecasting algorithm using a neural network:
(animation: 17 frames, 3 repetition cycles, 42.1 kilobytes)
Advantages of neural networks:
- the possibility of modeling non-linear processes;
- adaptability;
- scalability;
- heterogeneity of tasks to be solved.
Disadvantages:
- complexity of software implementation;
- no intermediate calculations;
- high requirements for the consistency of the training set.
Conclusion: the method is the most promising and flexible of the above, can solve various problems, but is also quite difficult to implement.
5. Mathematical statement of the research problem
To achieve the maximum profit from the sale, it is necessary to apply existing methods for solving multicriteria problems of decision theory.
The multicriteria selection problem is formulated as follows. A set of valid alternatives is given, each of which is evaluated by a set of criteria. It is required to determine the best alternative. When solving it, the main difficulty lies in the ambiguity of choosing the best solution.
Methods considered:
- additive convolution;
- multiplicative convolution;
- maxmin convolution;
- threshold criteria method;
- main criterion method.
There are several criteria in our task:
- expenses for the supply of goods, rub. (min);
- expenses for storage of goods, rub. (min);
- expenses for the lack of goods, rub. (min);
- profit from work for the forecast period, rub. (max).
Let's assign variables to the criteria:
expenses for the supply of goods – A, the cost of storing the goods – B, out-of-stock expenses – C, profit from work for the forecast period – D.
Then it turns out that:
{A-> min; B-> min; C-> min; D-> max
Conclusions
Of all the above forecasting methods, the forecasting method based on neural networks is the most suitable for the system being developed. It is able to solve various kinds of problems.
At this stage of the master's work, the goal and objectives for the system were determined, a comparative analysis of existing tools was carried out.
When writing this essay, the master's work has not yet been completed. Final Completion: May 2023. The full text of the work and materials on the topic can be obtained from the author or his supervisor after the specified date.
List of used sources
- Интеллектуальная информационная система (ИИС) кратко [Electronic resource]. – Access mode: [Link] – Title from the screen.
- Интеллектуальная система [Electronic resource]. – Access mode: [Link] – Title from the screen.
- Шрайбфедер Д., Эффективное управление запасами [Electronic resource]. – Access mode: [Link] – Title from the screen.
- ТОП 10 ПРОГРАММ ДЛЯ ОТДЕЛА ЗАКУПОК, О КОТОРЫХ НУЖНО ЗНАТЬ [Electronic resource]. – Access mode: [Link]– Title from the screen.
- Microsoft Dynamics AX [Electronic resource]. – Access mode: [Link] – Title from the screen.
- Oracle Procurement [Electronic resource]. – Access mode: [Link] – Title from the screen.
- SAP Ariba [Electronic resource]. – Access mode: [Link]. – Title from the screen.
- Андриевская А.В., Экстраполяционные методы прогнозирования закупочных цен лекарств в условиях аптечной сети [Текст] / А. В. Андриевская, В. О. Вовченко, Н. К. Андриевская// Информатика, управляющие системы, математическое и компьютерное моделирование (ИУСМКМ-2021). Материалы XII Международной научно-технической конференции в рамках VII Международного Научного форума Донецкой Народной Республики к 100-летию ДонНТУ. 2021, 169-175
- SAP Ariba. Цифровое управление расходами и поставщиками с помощью облачной торговой площадки SAP Ariba [Electronic resource]. – Access mode: [Link] – Title from the screen.
- AXAPTA [Electronic resource]. – Access mode: [Link] – Title from the screen.
- Метод скользящей средней в статистике [Electronic resource]. – Access mode: [Link] – Title from the screen.