
Abstract on the topic of the final work
Content
- Introduction
- 1. Analysis of dimension measurement systems
- 1.1 Relevance of the study
- 1.2 Overview of dimension measurement systems
- 1.3 Purpose and objectives of the system
- 2. Concepts of constructing depth maps
- 3. Algorithms of the main program and subroutines
- Conclusions
- List of sources
Introduction
The development and application of digital technologies in the service and trade sector has led to a sharp increase in postal shipments from the company; Online store to the buyer. Giants in the field of online shopping are recognized today amazon.com, еbay.com, alibaba.com, walmart.com, bestbuy.com and others . The flow of goods from them to customers requires unmistakable differentiation by delivery directions, by means of delivery and not in last of all, according to the dimensions of the cargo. The latter is especially important for solving the issue of the number of containers for cargo delivery and for optimal loading of each container. It is clear that the giants of online commerce today have modern expensive systems automated cargo handling, however, the online shopping market needs simpler and inexpensive, but reliable enough systems determining the dimensions of the cargo. It is necessary to take into account the interests of post offices in large settlements, the interests of airlines, the interests of industrial production, where there is also a need for automatic assessment of the dimensions of goods and products.
Postal items to recipients and parcels from an online store to customers are usually packed in cardboard boxes in the form of parallelepiped, and the dimensions of the box correspond to some standard row. There are often cases when the goods being shipped it is indivisible and does not fit into standard sizes. Hence, the task of automatically determining the dimensions of goods arises.
1. Analysis of dimension measurement systems
1.1 Relevance of the study
Parcel sizing has recently become critically important for the e-commerce and logistics industries in as part of their optimization of space and pricing models based on the dimensions of the parcel. According to the report, VDC Research, 43&percent; respondents working in the field of warehousing and distribution are currently supported by the sizes of standard parcels and cardboard boxes, and another 30% plan to support sizing in the future.
Unfortunately, most businesses still use manual labor to measure dimensions. If you take pallet, "large" or oversized loads are always roulette. The employee takes measurements, writes them down on paper or, keeping the numbers in mind, goes to the computer and enters they are transferred to the accounting system (or the goods are moved to a special workplace for this procedure).
There are various developments that allow you to automate the process of measuring dimensions, depending on the measurement method, size cargo, type of process. The cargo must be placed in the measurement area of the loading zone, after which the scanning process is performed automatically, i.e. the employee does not participate in determining and transmitting the results to the accounting system.
Large companies rely on automated sizing solutions to avoid time-consuming and often inaccurate manual measurements that sometimes force shippers to abandon certain packaging box options that can save precious space and reduce costs [1].
For example, in 2014, the postal system in Russia experienced a collapse associated with an increase in parcels from China, which led to
months of delays in the delivery of parcels. In this regard, FSUE Russian Post has decided to conduct a global modernization
Europe's largest mail sorting hub Logistics Center
. As part of the work on
modernization of conveyor and sorting lines was tasked with equipping sorting units with a machine (technical) vision system, in particular
in order to reduce the influence of the human factor and increase the throughput of the system as a whole [2].Vnukovo
1.2 Overview of dimension measurement systems
Automated measurement systems (AIS) of cargo dimensions differ in the size of the measured cargo, throughput, installation options, can measure cargo in static or dynamic (the process of movement along the conveyor). Potential customers of SAI dimensions are logistics and transport companies, distribution centers, distributors and manufacturers of oversized goods.
Existing AIS are mainly used as key elements of ultrasonic, infrared sensors.
Ultrasonic AIS are well suited for measuring the outer boundaries of the package. They detect objects regardless of their optical properties properties. The accuracy of the measurement does not depend on the color of the object or the presence of reflective surfaces, since they do not affect the propagation and reflection of sound waves. This ensures reliable recognition of packages, even if they are wrapped, for example, with glossy film or cellophane.
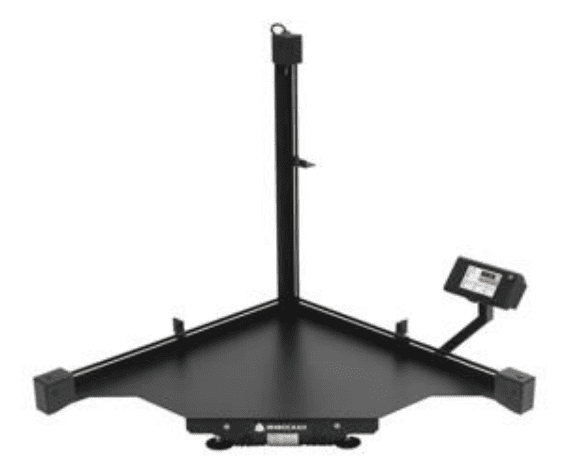
Figure 1.1 – Appearance of ultrasonic SAI
Infrared AIS (Fig. 1.2), are often presented in the form of a large number of infrared sensors, determining spatial coordinates of objects passing in the frame between two optical curtains (infrared barriers), one of which it is a transmitter of pulsed optical infrared signals, and the second is a receiver with a built-in amplifier of these signals. Optical infrared blinds scan an object in two mutually perpendicular directions when moving along the conveyor. Individual rays are collected in a continuous parallel row and represent an optical curtain.
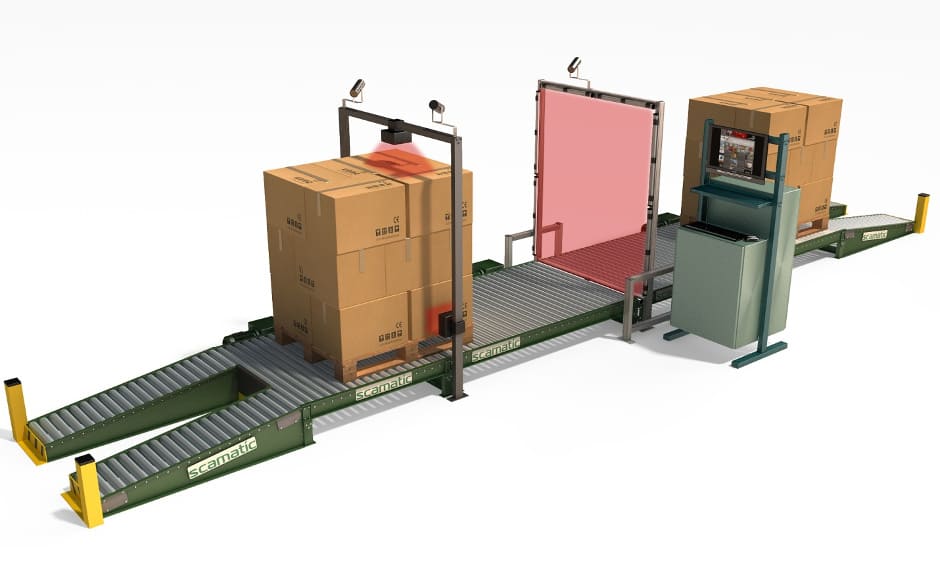
Figure 1.2 –Appearance of infrared SAI
The main manufacturers of the systems are: Sensotec, APACHE, Cubiscan, Vibra and others.
The use of such systems allows you to recognize dimensions with high speed and accuracy, however, such systems have limitations according to the shapes of the measured object.
As mentioned earlier, the market tends to move away from standard sizes in order to increase the turnover of goods and increase the commercial share. To do this, recently more and more often resort to the help of technical vision systems (STV). The main elements of which are depth cameras. Which receive an image in each pixel of which stored in addition to the color, the distance to the object at this point. The vision system provides information about the object in the form of a point cloud. Each point clouds are the distance to an object, a set of vertices in a three—dimensional coordinate system.
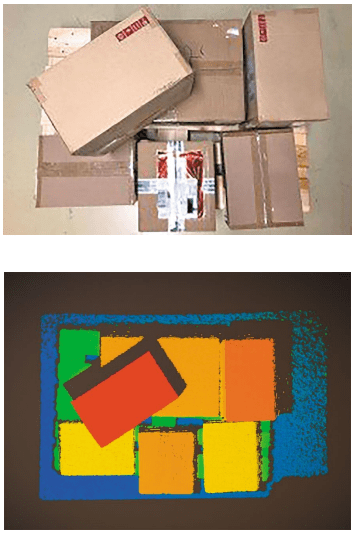
Figure 1.3 – Upper – real image, lower – image obtained using depth cameras
1.3 The purpose and objectives of the system
The purpose of the work is the research and development of an intelligent vision system for measuring the dimensions of objects of amorphous shapes.
The main task is to develop an automatic system for determining the dimensions of goods having any shape, using a system of technical vision, which allows the results of processing a video image obtained from a typical video camera (webcam, photo or video) to determine dimensions of the cargo. The position of the load under the video camera is arbitrary (not strictly oriented).
2. Concepts of constructing depth maps
The basic principle of the STV is to take several pictures of the same scene from different angles (one or more video cameras), compare the pictures and calculate the three-dimensional coordinates of the points of the scene. In monocular systems, images of the scene from different angles are obtained by camera movements relative to the scene or due to the movement of the scene itself relative to the camera. But without using additional information about in the observed scene, monocular systems do not allow calculating the true dimensions of objects and the distances between them, but only with accuracy up to a certain coefficient [3, 4].
Systems of two or more video cameras are used for this disadvantage, in order to restore the parameters of objects, it is necessary to know the relative position and orientation of the cameras (calculated during the calibration of the cameras). In addition to increasing the cost of the system due to the use of both at least one more camera, there is a problem of camera synchronization. Two synchronization methods are used: software and hardware, the second it is more efficient, but, as a rule, is only available on expensive specialized stereo cameras.
An alternative to multi-camera systems are optical systems in which the acquisition of multiple images is achieved by combinations of refractive or reflecting elements (flat or curved mirrors). Operation of an optical system consisting of N mirrors and one The camera observing the mirrors can be described as a system of N virtual cameras [5].
Mirror systems can be divided into two classes, depending on the type of mirrors used: curved or flat.
Systems with curved mirrors are often referred to in the scientific literature as "omnidirectional". The disadvantage of omnidirectional optical systems have small visible sizes of remote objects, which can make it difficult to compare pixels in images in order to build depth maps.
Flat mirrors are less susceptible to this disadvantage, easier to manufacture and have a lower cost. Systems with flat mirrors it can be classified by the number of mirrors used.
Single-mirror systems are the simplest, but have a narrow scope due to the small viewing angle due to limited dimensions mirrors. To solve this problem, rotating mirrors or a larger number of mirrors are used.
The use of two mirrors in a system where the mirrors are flat and the camera, the elements are rigidly fixed relative to each other (Fig. 2.1): the absence of moving parts increases the strength and reliability of the entire structure (which may be relevant for STZ installed in warehouses enterprises). Mirrors arranged in this way ensure that the camera captures an image consisting of a stereo pair. Next, you need to divide into right and left parts, after which each received part can be used to obtain a depth map.

Figure 2.1 – Operating principle of the system (animation: 7 frames, 57 KB)
The two-mirror system is schematically depicted in Fig. 2.2. The focal length of the camera is equal to f. The planes of both mirrors are perpendicular to the plane OXZ. The segments AB1 and B2C correspond to the planes of the mirrors. Points A and C are located in such a way that they lie on the boundaries of the camera's field of view. Points B1 and B2 are located on the OZ axis: in general, they can be located in arbitrary places, but if there is a gap between The camera will also observe foreign objects behind the mirrors.
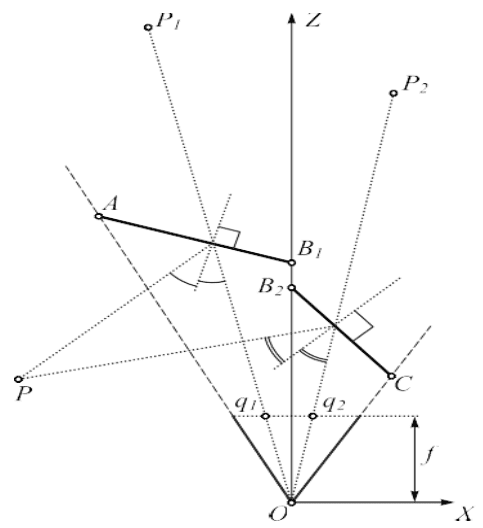
Figure 2.2 – Course of rays in a two-mirror system
Due to the fact that the mirrors are located at different angles to the video camera, the distances q1 and q2 in the stereo pair images differ by a certain amount called disparity. When an object is located in close proximity to the camera, the disparity value the point P will be the largest, and as the object is removed, it will decrease.
Depth map is a matrix, the elements of which will be the values of the disparity of the image points, reduced to a range of values from 0 (minimum) up to 255 (maximum).
Thus, as a result of the analysis of possible solutions, it seems most appropriate to use a two-mirror system for measurements of the dimensions of objects in warehouse enterprises, since the mirrors and the camera are fixed rigidly, with a known measurement area in advance, this is gives a more precise adjustment of both the position of the mirrors relative to the camera (angle, distance between the disparity), and a software setting for improving accuracy in a given area (taking into account the illumination of the room and the area in which the system will work). Another advantage of such systems – the ability to process objects reflecting and repeatedly reflecting the luminous flux.
3.The algorithms of the main program and subprograms
STV, as defined earlier, uses stereo vision to obtain complete information about the object.
Object image
The essence of this method is to use a video camera and two mirrors located at certain angles relative to it optical axis. Mirrors arranged in this way ensure that the camera captures an image consisting of a stereo pair and at the output we get one an image that carries information about the object. Next, it is necessary to divide it into right and left parts, after which each received part can be used to get a depth map.
Building a depth map
Figure 3.1 shows the principle of constructing a depth map, showing the Y-points of some point of the observed object, X1 and X2 projections of the point Y on planes a and b (images from mirror 1 and mirror 2, respectively). The segments d1 and d2 are the distances, measured in pixels, from the beginning the coordinates of the horizontal axis up to the points X1 and X2, respectively. Due to the fact that the mirrors are located at different angles to the video camera, the distances d1 and d2 in the images of the stereo pair differs by a certain amount, called disparity. When an object is located in the immediate vicinity of the camera, the disparity value of the Y point will be the largest, and as the object is removed, it will decrease.
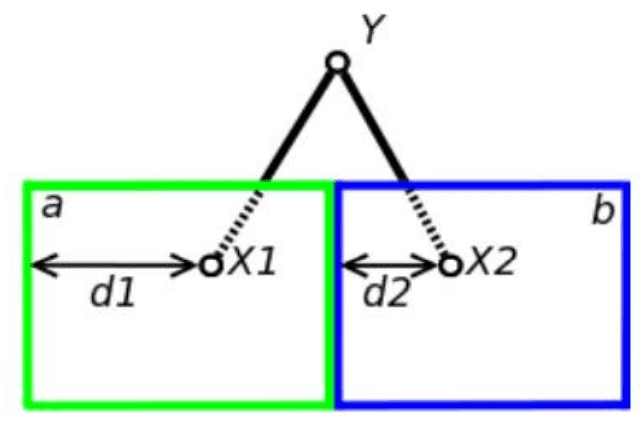
Figure 3.1 – Finding disparity
The operation of the system software can be divided into 2 stages:
- System Setup;
- The functioning of the system.
The algorithm of the system setup stage is shown in Figure 3.2 and represents the following steps:
- Alignment of the video camera. Allows you to adjust the position of the camera in space relative to the mirrors, after which it must be fixed.
- Exclusion of the area of fuzziness in the image. Allows you to select the area of fuzziness formed by the junction of mirrors and saves the parameters of this area for subsequent image slicing.
- Capture and save calibration images. At this stage, N–images of the calibration template are obtained
chessboard
and saving them to the specified directory. - Slicing calibration images according to the parameters saved in step 2.
- Calibration of the stereo pair. Calibration is necessary to eliminate distortions introduced by the optical path of the video camera, for correct the work of the program for constructing a depth map. Calibration is performed by algorithms of the OpenCV library, after which it is saved parameters. Using these parameters, it is possible to rectify images of a stereo pair, that is, to reproduce them without distortion.
- The depth map is configured manually by changing various parameters. To achieve optimal map parameters However, they are saved for use in the second stage of the system operation. When the depth map settings are selected, the disparity calculated for special points of the observed object, such as contours.
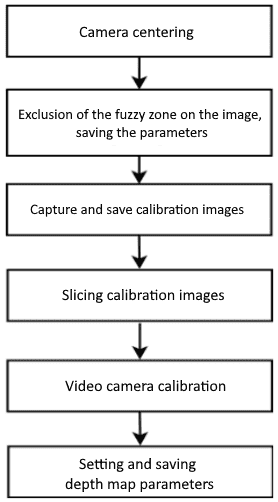
Figure 3.2 – Algorithm of the system configuration stage
The result of the configuration stage is the stage of the system functioning, the algorithm of which is shown in Figure 3.3, and includes next steps:
- Loading parameters saved after the system configuration stage. These are image slicing parameters, calibration parameters and depth maps;
- The image is captured from the stereo pair. This and subsequent steps will be performed cyclically until we stop the program execution.;
- Using the slicing parameters from step 1, we get a stereo pair based on the captured image;
- Next, using the calibration parameters from step 1, we rectify the images of the stereo pair;
- Based on rectified images, a depth map is built. The closer the observed face of an object is to the video camera, the higher the color intensity of its contour;
- The distance to the observed object is calculated using information about the intensity of its contour. For this purpose there were conditions are created under which the object is placed on a homogeneous background in the image, in order to avoid interference from contours that are not of interest objects. The average value of the color intensity of all points of the contour of the object on the depth map is calculated, after which the resulting value it is multiplied by the calculated coefficient to bring it to the meter scale, after which it displays the result on the display.
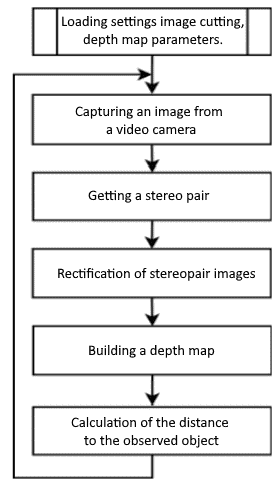
Figure 3.3 – Algorithm of the system operation stage
Conclusions
Currently, the market for automatic dimension measurement systems is widely used systems using measurement hardware. The use of video cameras increases the measurement limits, and with the correct development of the necessary algorithms, it becomes possible to measure the dimensions of complex -shaped cargo. Intelligent algorithms are increasingly finding their application in various technical solutions, and their use for determining the dimensions of goods seems to be a promising and successful solution.
As a concept for determining the dimensions, a stereo vision system using a two-mirror system for obtaining images.
To start the STZ algorithm, it is necessary to calibrate the camera, this is done by the system configuration algorithm – the first stage of work. This the algorithm allows you to calibrate the camera, mirrors, both halves of the image relative to each other, and adjust the correct separation image by two.
In the second stage, the calibrated results for the system are applied. Here already, the system automatically captures stereo images, image rectification, depth mapping, calculation of the distance to the edges of the object and display.
At the time of writing this abstract, the work on the master's thesis has not yet been completed. In the work, you should choose the processing of the algorithm for combining uncalibrated video frames, to increase the number of exact matches, to build disparity maps.
List of sources
- Чемидов, И. В. АСУ складским комплексом как элемент единого информационного пространства приборостроительного предприятия / И. В. Чемидов, Д. В. Капулин, М. А Казанцев, Н. Н. Джиоева // Автоматизация в промышленности. – М.: Инфоавтоматизация, 2016. – №11. – С.27–30
- Фадкин А. В. Интеграция системы SCADA и системы машинного зрения в автоматизированных системах управления логистического центра
ФГУП
ПОЧТА РОССИИ
. Новые технологии в научных исследованиях, проектировании, управлении, производстве. Воронеж, 2017 - Чумаченко А. В. Оптимизация вычисления SAD для задачи восстановления рельефа по изображениям стереопар в высокопроизводительных системах стереозрения// Известия ЮФУ. Технические науки. – 2013. – №3(140). – С.89-96
- R. Ng, M. Levoy, M. Bredif, G. Duval, M. Horowitz, and P. Hanrahan, Light Field Photography with a Hand-Held Plenoptic Camera / Stanford University Computer Science Tech Report CSTR 2005-02. 2005. – V.2.– Pp. 1-11.
- Алтухов В.Г. Вычисление расстояния до объекта на основе карты глубин полученной методом зеркального разделения изображений / В. Г. Алтухов, А. Б. Колкер // Автоматика и программная инженерия. – 2017. – № 1 (19). – С. 65-69.
- Акинин М. В. Нейросетевой алгоритм выделения контуров на изображениях, основанный на Вейвлете Габора / М. В. Акинин, Т. И. Лапина, М. Б. Никифоров // Известия Тульского государственного университета. Технические науки. – 2013. – № 9-1. – С. 208-216.
- Чугунов Р. А. Методика построения карт глубины стереоизображения с помощью капсульной нейронной сети / Р. А. Чугунов, А. Д. Кульневич, С. В. Аксенов // Доклады ТУСУР. – 2019. – Т. 22. – № 1. – C.83-86.
- Бобырь М. В. Модернизированный фильтр Канни для построения карт глубин/ М. В. Бобырь, А. Е Архипов, А. С. Якушев // Завалишинские чтения 21: сборник трудов XVI международной конференции по электромеханике и робототехнике. – Санкт-Петербург, 2021. – С.20-24.
- Безуглов Д. А., Кузин А. П. Информационная технология выделения контуров изображения / Д. А. Безуглов, А. П. Кузин // Академический вестник Ростовского филиала Российской таможенной академии. – 2015.– №1(18). – С.33- 39.
- Волков И. А. Выделение фрагментов плоского изображения на основе его представления в виде скалярного поля: обработка изображений, полевая модель изображения, выделение контуров, выделение сегментов// Вестник МГТУ. Труды Мурманского государственного технического университета. – 2010. – Т.13. – №3. – С. 607-612.