1. Introduction
In the past decade, social media have become one of the main sources of information for people around the world. Yet, using social media for news consumption is a double-edged sword. On the one hand, it offers low cost, easy access, and rapid dissemination. On the other hand, it comes with the danger of exposure to 'fake news' containing poorly checked or even intentionally false information aimed at misleading and manipulating the readers to pursue certain political or economic agendas.
The extensive spread of fake news has recently become a global problem and threat to modern democracies. The extensive spread of fake news before the United States 2016 presidential elections [3] and the Brexit vote in United Kingdom has become the centerpiece of the controversy surrounding these political events and allegations of public opinion manipulation. Due the very high societal and economic cost of the phenomenon [11], in the past year, fake news detection in social media has attracted enormous attention in the academic and industrial realms [16].
Automatically detecting fake news poses challenges that defy existing content-based analysis approaches. One of the main reasons is that often the interpretation of the news is highly nuanced and requires the knowledge of political or social context, or "common sense", which even the currently most advanced natural language processing algorithms are still missing. Furthermore, fake news is often intentionally written by bad actors to appear as real news but containing false or manipulative information in ways that are hard even for trained human experts to detect.
Prior works
Existing approaches for fake news detection can be divided into three main categories, based on content, social context, and propagation [36, 44]. Content-based approaches, which are used in the majority of works on fake news detection, rely on linguistic (lexical and syntactical) features that can capture deceptive cues or writing styles [1, 32, 30, 29, 28]. The main drawback of content-based approaches is that they can be defied by sufficiently sophisticated fake news that does not immediately appear as fake. Furthermore, most linguistic features are language-dependent, limiting the generality of these approaches.
Social context features include user demographics (such as age, gender, education, and political affiliation [37, 21]), social network structure [38, 35] (in the form of connections between users such as friendship or follower/followee relations) and user reactions (e.g. posts accompanying a news item [33] or likes [40]).
Propagation-based approaches are perhaps the most intriguing and promising research direction based on studying the news proliferation process over time. It has been argued that the fake news dissemination process is akin to infectious disease spread [14] and can be understood with network epidemics models. There is substantial empirical evidence that fake news propagate differently from true news [42] forming spreading patterns that could potentially be exploited for automatic fake news detection. By virtue of being content-agnostic, propagation-based features are likely generalizes across different languages, locales, and geographies, as opposed to content-based features that must be developed separately for each language. Furthermore, controlling the news spread patterns in a social network is generally beyond the capability of individual users, implying that propagation-based features would potentially be very hard to tamper with by adversarial attacks.
Main contribution
So far, attempts to exploit news propagation for fake news detection applied 'handcrafted' graph-theoretical features such as centrality, cliques, or connected components [15]. These features are rather arbitrary, too general, and not necessarily meaningful for the specific task of fake news detection. In this paper, we propose learning fake news specific propagation patterns by exploiting geometric deep learning, a novel class of deep learning methods designed to work on graph-structured data [4]. Geometric deep learning naturally deals with heterogeneous data (such as user demographic and activity, social network structure, news propagation and content), thus carrying the potential of being a unifying framework for content, social context, and propagation based approaches.
The model proposed in this paper is trained in a supervised manner on a large set of annotated fake and true stories spread on Twitter in the period 2013-2018. We perform extensive testing of our model in different challenging settings, showing that it achieves very high accuracy (nearly 93% ROC AUC), requires very short news spread times (just a few hours of propagation), and performs well when the model is trained on data distant in time from the testing data.
2. Dataset
One of the key challenges in machine-learning based approaches in general, and in automatic fake news detection in particular, is collecting a sufficiently large, rich, and reliably labelled dataset on which the algorithms can be trained and tested. Furthermore, the notion of 'fake news' itself is rather vague and nuanced. To start with, there is no consensus as to what would be considered 'news', let alone the label 'true' or 'false'. A large number of studies exploit the notion of reliable or unreliable sources as a proxy for true or false stories. While allowing to gather large datasets, such approaches have been criticized as too crude [42]. In our study, we opted for a data collection process in which each 'story' has an underlying article published on the web, and each such story is verified individually. In our classification of true or false statements we rely on professional non-profit journalist fact-checking organizations such as Snopes, PolitiFact, and Buzzfeed. We note that our use of the term fake news, though disliked in the social science research community for its abuse in the political discourse, refers to both misinformation and disinformation, i.e. unintentional as well as deliberate spread of misleading or wrong narrative or facts.
Data collection protocol
Our data collection process was inspired by and largely followed the pioneering work of Vosoughi et al. [42]. We used a collection of news verified by fact-checking organizations with established reputation in debunking rumors; each source fact-checking organization provides an archive of news with an associated short claim (e.g. 'Actress Allison Mack confessed that she sold children to the Rothschilds and Clintons') and a label determining its veracity ('false' in the above example). First, we gathered the overall list of fact-checking articles from such archives and, for simplicity, discarded claims with ambiguous labels, such as 'mixed' or 'partially true/false'. Second, for each of the filtered articles we identified potentially related URLs referenced by the fact-checkers, filtering out all those not mentioned at least once on Twitter. Third, trained human annotators were employed to ascertain whether the web pages associated with the collected URLs were matching or denying the claim, or were simply unrelated to that claim. This provided a simple method to propagate truth-labels from fact-checking verdicts to URLs: if a URL matches a claim, then it directly inherits the verdict; if it denies a claim, it inherits the opposite of the verdict (e.g. URLs matching a true claim are labeled as true, URLs denying a true claim are labeled as false). URLs gathered from different sources, with same veracity and date of first-appearance on Twitter were additionally inspected to ensure they referred to different articles.
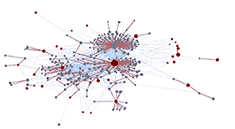
The last part of the data collection process consisted of the retrieval of Twitter data related to the propagation of news associated with a particular URL. Following the nomenclature of [42], we term as cascade the news diffusion tree produced by a source tweet referencing a URL and all of its retweets. For each URL, we searched for all the related cascades and enriched their Twitter-based characterization (i.e. users and tweet data) by drawing edges among users according to Twitter's social network (see example in Figure 1).
With regard to this last step of data collection, our approach is significantly different from the protocol of [42], where tweets linking to a fact-checking website were collected, thus essentially retrieving only cascades in which someone has posted a 'proof-link' with the veracity of the news. Though significantly more laborious, we believe that our data collection protocol produces a much cleaner dataset.
Statistics
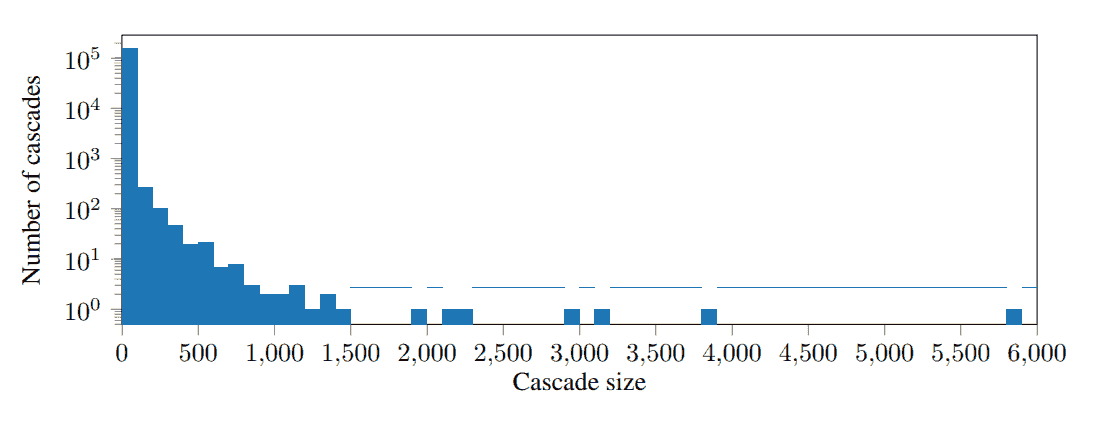
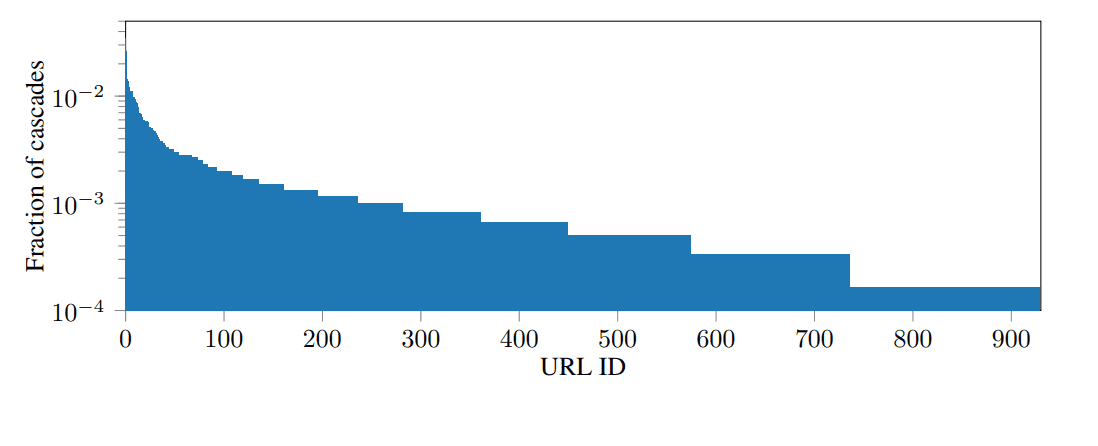
Figures 2–3 depict the statistics of our dataset. Overall, our collection consisted of 1,084 labeled claims, spread on Twitter in 158,951 cascades covering the period from May 2013 till January 2018. The total number of unique users involved in the spreading was 202,375 and their respective social graph comprised 2,443,996 edges. As we gathered 1,129 URLs, the average number of article URLs per claim is around 1.04; as such, a URL can be considered as a good proxy for a claim in our dataset and we will thus use the two terms synonymously hereinafter. We also note that, similarly to [42], a large proportion of cascades were of small size (the average number of tweets and users in a cascade is 2.79, see also Figure 2 depicting the distribution of cascade sizes), which required to use a threshold on a minimum cascade size for classifying these independently in some experiments (see details in Section 4.1).
Features
We extracted the following features describing news, users, and their activity, grouped into four categories: User profile (geolocalization and profile settings, language, word embedding of user profile self-description, date of account creation, and whether it has been verified), User activity (number of favorites, lists, and statuses), Network and spreading (social connections between the users, number of followers and friends, cascade spreading tree, retweet timestamps and source device, number of replies, quotes, favorites and retweets for the source tweet), and Content (word embedding of the tweet textual content and included hashtags).
Credibility and polarization
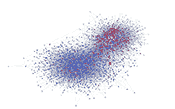
The social network collected in our study manifests noticeable polarization depicted in Figure 4. Each user in this plot is assigned a credibility score in the range [−1, +1] computed as the difference between the proportion of (re)tweeted true and fake news (negative values representing fake are depicted in red; more credible users are represented in blue). The node positions of the graph are determined by topological embedding computed via the Fruchterman-Reingold force-directed algorithm [9], grouping together nodes of the graph that are more strongly connected and mapping apart nodes that have weak connections. We observe that credible (blue) and non-credible (red) users tend to form two distinct communities, suggesting these two categories of tweeters prefer to have mostly homophilic interactions. While a deeper study of this phenomenon is beyond the scope of this paper, we note that similar polarization has been observed before in social networks, e.g. in the context of political discourse [7] and might be related to 'echo chamber' theories that attempt to explain the reasons for the difference in fake and true news propagation patterns.
3. Our model
3.1 Geometric deep learning
In the past decade, deep learning techniques have had a remarkable impact on multiple domains, in particular computer vision, speech analysis, and natural language processing [17]. However, most of popular deep neural models, such as convolutional neural networks (CNNs) [18], are based on classical signal processing theory, with an underlying assumption of grid-structured (Euclidean) data. In recent years, there has been growing interest in generalizing deep learning techniques to non-Euclidean (graph- and manifold-structured) data. Early approaches to learning on graphs [34] predate the recent deep learning renaissance and are formulated as fixed points of learnable diffusion operators. The modern interest in deep learning on graphs can be attributed to the spectral CNN model of Bruna et al. [5]. Since some of the first works in this domain originated in graphics and geometry community [22], the term geometric deep learning is widely used as an umbrella term for non-Euclidean deep learning approaches [4].
Broadly speaking, graph CNNs replace the classical convolution operation on grids with a local permutation-invariant aggregation on the neighborhood of a vertex in a graph. In spectral graph CNNs [5], this operation is performed in the spectral domain, by utilizing the analogy between the graph Laplacian eigenvectors and the classical Fourier transform; the filters are represented as learnable spectral coefficients. While conceptually important, spectral CNNs suffer from high computational complexity and difficulty to generalize across different domains [4]. Follow-up works showed that the explicit eigendecomposition of the Laplacian can be avoided altogether by employing functions expressible in terms of simple matrix-vector operations, such as polynomials [8, 12] or rational functions [19]. Such spectral filters typically scale linearly with the graph size and can be generalized to higher order structures [25], dual graphs (edge filters) [26], and product graphs [24].
The Laplacian operator is only one example of fixed local permutation-invariant aggregation operation amounting to weighted averaging. More general operators have been proposed using edge convolutions [43], neural message passing [10], local charting [23], and graph attention [41]. On non-Euclidean domains with local low-dimensional structure (manifolds, meshes, point clouds), more powerful operators have been constructed using e.g. anisotropic diffusion kernels [2].
Being very abstract models of systems of relations and interactions, graphs naturally arise in various fields of science. For this reason, geometric deep learning techniques have been successfully applied across the board in problems such as computer graphics and vision [2, 23, 20, 43], protection against adversarial attacks [39], recommendation systems [24] quantum chemistry [10] and neutrino detection [6], to mention a few.
3.2 Architecture and training settings
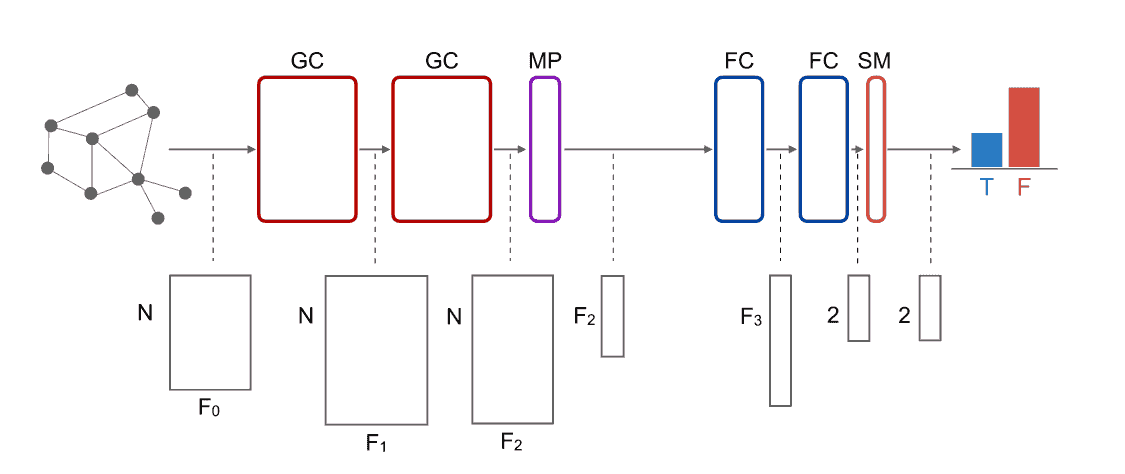
Our deep learning model is described below. We used a four-layer Graph CNN with two convolutional layers (64-dimensional output features map in each) and two fully connected layers (producing 32- and 2-dimensional output features, respectively) to predict the fake/true class probabilities. Figure 5 depicts a block diagram of our model. One head of graph attention [41] was used in every convolutional layer to implement the filters together with mean-pooling for dimensionality reduction. We used Scaled Exponential Linear Unit (SELU) [13] as non-linearity throughout the entire network. Hinge loss was employed to train the neural network (we preferred hinge loss to the more commonly used mean cross entropy as it outperformed the latter in early experiments). No regularization was used with our model.
3.3 Input generation
Given a URL u (or a cascade c arising from u) with corresponding tweets Tu = {t¹u, t²u, ..., tNu} mentioning it, we describe u in terms of graph Gu. Gu has tweets in Tu as nodes and estimated news diffusion paths plus social relations as edges. In other words, given two nodes i and j, edge (i, j) ∈ Gu iff at least one of the following holds: i follows j (i.e. the author of tweet i follows the author of tweet j), j follows i, news spreading occurs from i to j, or from j to i.
News diffusion paths defining spreading trees were estimated as in [42] by jointly considering the timestamps of involved (re)tweets and the social connections between their authors. Given tnu – the retweet of a cascade related to URL u, and {t⁰u... tn⁻¹u} – the immediately preceding (re)tweets belonging to the same cascade and authored by users {a⁰u, ..., anu}, then:
- if anu follows at least one user in {a⁰u, ..., an⁻¹u}, we estimate news spreading to tnu from the very last tweet in {t⁰u... tn⁻¹u} whose author is followed by anu;
- if anu does not follow any of the users in {a⁰u, ..., an⁻¹u}, we conservatively estimate news spreading to tnu from the user in {a⁰u, ..., an⁻¹u} having the largest number of followers (i.e. the most popular one).
Finally, nodes and edges of graph Gu have features describing them. Nodes, representing tweets and their authors, were characterized with all the features presented in Section 2. As for edges, we used features representing the membership to each of the aforementioned four relations (following and news spreading, both directions). Our approach to defining graph connectivity and edge features allows, in graph convolution, to spread information independently of the relation direction while potentially giving different importance to the types of connections. Features of edge (i, j) are concatenated to those of nodes i and j in the attention projection layer to achieve such behavior.
4. Results
We considered two different settings of fake news detection: URL-wise and cascade-wise, using the same architecture for both settings. In the first setting, we attempted to predict the true/fake label of a URL containing a news story from all the Twitter cascades it generated. On average, each URL resulted in approximately 141 cascades. In the latter setting, which is significantly more challenging, we assumed to be given only one cascade arising from a URL and attempted to predict the label associated with that URL. Our assumption is that all the cascades associated with a URL inherit the label of the latter. While we checked this assumption to be true in most cases in our dataset, it is possible that an article is for example tweeted with a comment denying its content. We leave the analysis of comments accompanying tweets/retweets as a future research direction.
4.1 Model performance
For URL-wise classification, we used five randomized training/test/validation splits. On average, the training, test, and validation sets contained 677, 226, and 226 URLs, respectively, with 83.26% true and 16.74% false labels (± 0.06% and 0.15% for training and validation/test set respectively). For cascade-wise classification we used the same split initially realized for URL-wise classification (i.e. all cascades originated by URL u are placed in the same fold as u). Cascades containing less than 6 tweets were discarded; the reason for the choice of this threshold is motivated below. Full cascade duration (24 hr) was used for both settings of this experiment. The training, test, and validation sets contained on average 3586, 1195, 1195 cascades, respectively, with 81.73% true and 18.27% false labels (± 3.25% and 6.50% for training and validation/test set respectively).
Our neural network was trained for 25×10³ and 50×10³ iterations in the URL- and cascade-wise settings, respectively, using AMSGrad [31] with learning rate of 5×10⁻⁴ and mini-batch of size one.
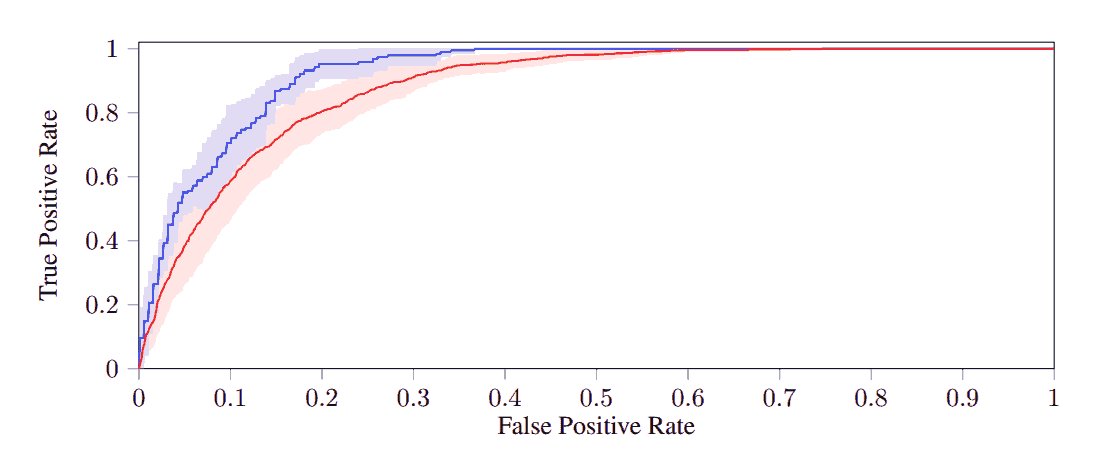
Figure 6 depicts the performance of URL- (blue) and cascade-wise (red) fake news classification represented as a tradeoff (ROC curve) between false positive rate (fraction of true news wrongly classified as fake) and true positive rate (fraction of fake news correctly classified as fake). We use area under the ROC curve (ROC AUC) as an aggregate measure of accuracy. On the above splits, our method achieved mean ROC AUC of 92.70 ± 1.80% and 88.30 ± 2.74% in the URL- and cascade-wise settings, respectively.
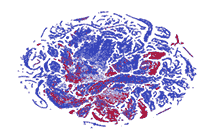
Figure 7 depicts a low-dimensional plot of the last graph convolutional layer vertex-wise features obtained using t-SNE embedding. The vertices are colored using the credibility score defined in Section 2. We observe clear clusters of reliable (blue) and unreliable (red) users, which is indicative of the neural network learning features that are useful for fake news classification.
Influence of minimum cascade size
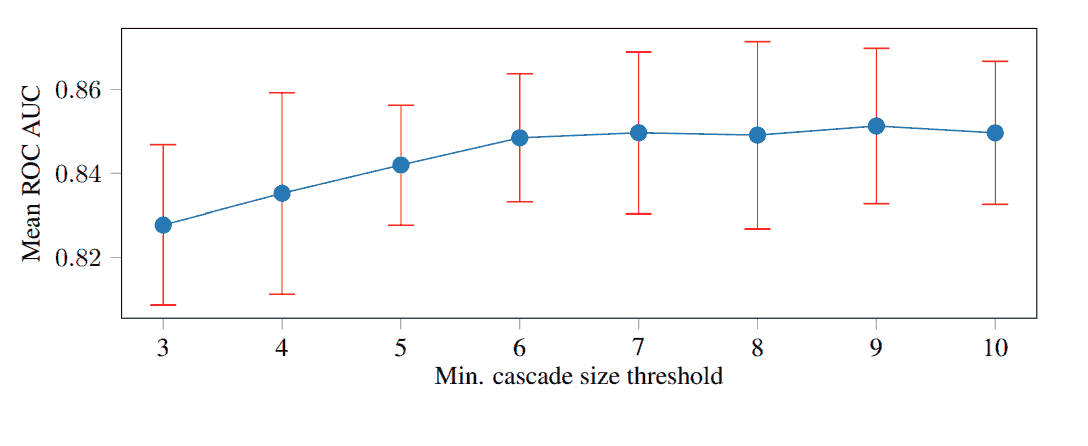
One of the characteristics of our dataset (as well as the dataset in the study of [42]) is the abundance of small cascades containing just a few users (see Figure 2). Since our approach relies on the spreading of news across the Twitter social network, such examples may be hard to classify, as too small cascades may manifest no clear diffusion pattern. To identify the minimum useful cascade size, we investigated the performance of our model in the cascade-wise classification setting using cascades of various minimum sizes (Figure 8). As expected, the model performance increases with larger cascades, reaching saturation for cascades of at least 6 tweets (leaving a total of 5,976 samples). This experiment motivates our choice of using 6 tweets as the minimum cascade size in cascade-wise experiments in our study.
Ablation study
To further highlight the importance of the different categories of features provided as input to the model, we conducted an ablation study by means of backward-feature selection. We considered four groups of features defined in Section 2: user profile, user activity, network and spreading, and content. The results of ablation experiment are shown in Figure 9 for the URL- (top) and cascade-wise (bottom) settings. In both settings, user-profile and network/spreading appear as the two most important feature groups, and allow achieving satisfactory classification results (near 90% ROC AUC) with the proposed model.
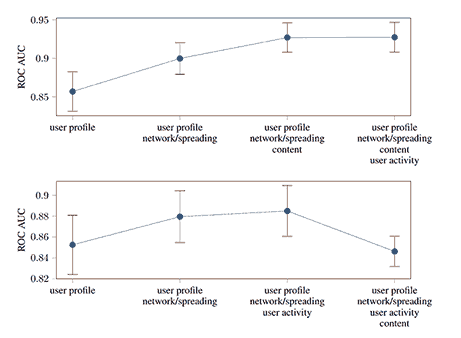
Interestingly, in the cascade-wise setting, while all features were positively contributing to the final predictions at URL-level, removing tweet content from the provided input improves performance by 4%. This seemingly contradictory result can be explained by looking at the distribution of cascades over all the available URLs (Figure 3): 20% of cascades are associated to the top 15 largest URLs in our dataset (∼ 1.5% out of a total of 930). Since tweets citing the same URL typically present similar content, it is easy for the model to overfit on this particular feature. Proper regularization (e.g. dropout or weight decay) should thus be introduced to avoid overfitting and improve performance at test time. We leave this further study for future research. For simplicity, by leveraging the capabilities of our model to classify fake news in a content-free scenario, we decided to completely ignore content-based descriptors (tweet word embeddings) for cascade-wise classification and let the model exploit only user- and propagation-related features.
4.2 News spreading over time
One of the key differentiators of propagation-based methods from their content-based counterparts, namely relying on the news spreading features, potentially raises the following question: for how much time do the news have to spread before we can classify them reliably? We conducted a series of experiments to study the extent to which this is the case with our approach.
For this purpose, we truncated the cascades after time t starting from the first tweet, with t varying from 0 (effectively considering only the initial tweet, i.e. the 'root' of each cascade) to 24 hours (the full cascade duration) with one hour increments. The model was trained separately for each value of t. Five-fold cross validation was used to reduce the bias of the estimations while containing the overall computational cost.
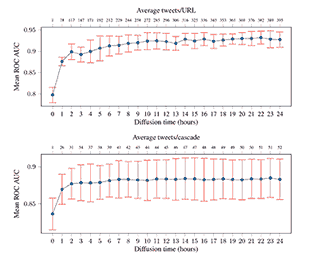
Figure 10 depicts the performance of the model (mean ROC AUC) as function of the cascade duration, for the URL- (top) and cascade-wise (bottom) settings. As expected, performance increases with the cascade duration, saturating roughly after 15 hours in the URL-wise setting and after 7 hours in the cascade-wise one, respectively. This different behavior is mainly due to the simpler topological patterns and shorter life of individual cascades. Seven hours of spreading encompass on average around 91% of the cascade size; for the URL-wise setting, the corresponding value is 68%. A similar level of coverage, 86%, is achieved after 15 hours of spreading in the URL-wise setting.
We also note that remarkably just a few (∼ 2) hours of news spread are sufficient to achieve above 90% mean ROC AUC in URL-wise fake news classification. Furthermore, we observe a significant jump in performance from the 0 hr setting (effectively using only user profile, user activity, and content features) to ≥ 1 hr settings (considering additionally the news propagation), which we interpret as another indication of the importance of propagation-related features.
4.3 Model aging
We live in a dynamic world with constantly evolving political context. Since the social network, user preferences and activity, news topics and potentially also spreading patterns evolve in time, it is important to understand to what extent a model trained in the past can generalize to such new circumstances. In the final set of experiments, we study how the model performance ages with time in the URL- and cascade-wise settings. These experiments aim to emulate a real-world scenario in which a model trained on historical data is applied to new tweets in real time.
For the URL-wise setting, we split our dataset into training/validation (80% of URLs) and test (20% of URLs) sets; the training/validation and test sets were disjoint and subsequent in time. We assessed the results of our model on subsets of the test set, designed as partially overlapping (mean intersection over union equal to 0.56 ± 0.15) time windows. Partial overlap allowed us to work on larger subsets while preserving the ratio of positives vs negatives, providing at the same time smoother results as with moving average. This way, each window contained at least 24% of the test set (average number of URLs in a window was 73 ± 33.34) and the average dates of two consecutive windows were at least 14 days apart, progressively increasing.
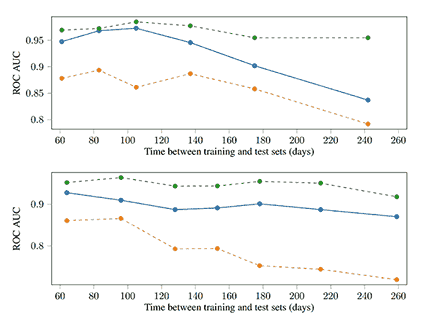
Figure 11 (top) captures the variation in performance due to aging of the training set in the URL-wise setting. Our model exhibits a slight deterioration in performance only after 180 days. We attribute this deterioration to the change in the spreading patterns and the user activity profiles.
We repeated the same experiment in the cascade-wise setting. The split into training/validation and test sets and the generation of the time windows was done similarly to the URL-wise experiment. Each time window in the test set has an average size of 314 ± 148 cascades, and two consecutive windows had a mean overlap with intersection over union equal to 0.68 ± 0.21. Figure 11 (bottom) summarizes the performance of our model in the cascade-wise setting. In this case, it shows a more robust behavior compared to the URL-wise setting, losing only 4% after 260 days.
This different behavior is likely due to the higher variability that characterizes cascades as opposed to URLs. As individual cascades are represented by smaller and simpler graphs, the likelihood of identifying recurrent rich structures between different training samples is lower compared to the URL-wise setting and, also, cascades may more easily involve users coming from different parts of the Twitter social network. In the cascade-wise setting, our propagation-based model is thus forced to learn simpler features that on the one hand are less discriminative (hence the lower overall performance), and on the other hand appear to be more robust to aging. We leave a deeper analysis of this behavior to future research, which might provide additional ways improving the fake news classification performance.
5. Conclusions
In this paper, we presented a geometric deep learning approach for fake news detection on Twitter social network. The proposed method naturally allows integrating heterogeneous data pertaining to the user profile and activity, social network structure, news spreading patterns and content. The key advantage of using a deep learning approach as opposed to 'handcrafted' features is its ability to automatically learn task-specific features from the data; the choice of geometric deep learning in this case is motivated by the graph-structured nature of the data. Our model achieves very high accuracy and robust behavior in several challenging settings involving large-scale real data, pointing to the great potential of geometric deep learning methods for fake news detection.
There are multiple intriguing phenomena and hypotheses left for future research. Of particular interest is the experimental validation of the conjecture that our model is potentially language and geography-independent, being mainly based on connectivity and spreading features. The study of adversarial attacks is also of great interest, both from theoretical and practical viewpoints: on the one hand, they adversarial attacks would allow exploration of the limitations of the model and its resilience to attacks. We conjecture that attacks on graph-based approaches require social network manipulations that are difficult to implement in practice, making our method particularly appealing. On the other hand, adversarial techniques could shed light on the way the graph neural network makes decisions, contributing to better interpretability of the model. Finally, we intend to explore additional applications of our model in social network data analysis going beyond fake news detection, such as news topic classification and virality prediction.
6. Acknowledgments
We gratefully acknowledge the generous support by ERC Consolidator Grant No. 724228 (LEMAN), ERC Proof of Concept grant No. 812672 (GoodNews), multiple Google Research Faculty awards and Nvidia equipment grants, Amazon AWS Machine Learning Research grant, Dalle Molle Foundation prize, and Facebook Computational Social Science Methodology award. MB is also partially supported by the Royal Society Wolfson Research Merit award and Rudolf Diesel industrial fellowship at TU Munich. FF's PhD scholarship is supported by the SNF Grant No. 200021E/176315.