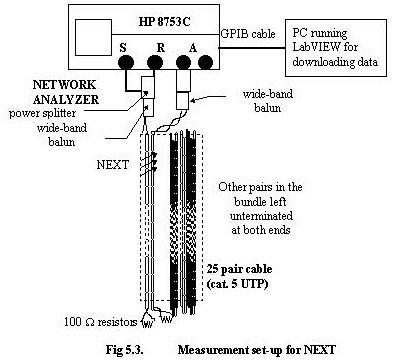


The network analyzer was borrowed from the UNH ECE department in order to make the measurements at IOL. A program was written in LabVIEW to download data from the network analyzer to the PC. The network analyzer used was the HP 8753C which had 50 ohm type N connectors. Hence an N to BNC adapter together with a North Hills wide-band balun (03BB) was used to make the differential (balanced) crosstalk measurement on each of the pairs. Both the pairs were terminated in a 1% 100 ohm resistor. Fig 5.3. shows the set-up for the NEXT measurement. The cable length was chosen to be 100 meters. Fig. 5.4 shows the actual NEXT measured for this set-up. Several measurements were taken. The frequency range for which NEXT was measured was 1 MHz - 100 MHz. The ordinate axis in the magnitude plot represents the signal to crosstalk ratio in dB. Here, signal refers to the frequency swept signal transmitted from the analyzer on the interfering pair and crosstalk refers to the coupled noise on the other pair. Thus, the greater the signal to crosstalk ratio, the smaller is the crosstalk at that frequency.
The following observations were made from the measurements:
The NEXT for the same two twisted pairs was measured using the cable analyzer, the Wirescope 16. Several measurements were taken and were averaged. This average crosstalk value was 47 dB. The measurements had a very small variance. Thus, the cable analyzer and the network analyzer had a difference of 9-10 dB between their measurements. Other cables were measured by both the methods and the difference in the measurements were noted. It was observed that the network analyzer consistently showed better results (less crosstalk) as the numbers measured were always 7-10 dB greater than the numbers measured off the cable analyzer for the same twisted pairs. One of the reasons to explain this difference might be the following: NEXT is measured with the network analyzer by cutting the RJ-45 connectors at the end of the cable and directly connecting the wires to the balanced side of the balun. Thus, the two pairs are more physically separated than they would be in a connector crimped together.

The same is true at the other end of the cable because the pairs are physically separated in order to solder on the resistive terminations. In the cable analyzer, the two pairs are crimped in one connector and inserted in to the loopback plug. However, the length over which the twisted pairs are separated is just a couple of centimeters, and should not cause a difference in measurements as large as 7-10 dB. The crosstalk at the far end of the cable is negligible. Specifications on the accuracy of the Wirescope 16 were not available at the time of writing of this thesis. However, we can conclude from the previous discussion that NEXT is either equal to or better than the measurements given by the Wirescope 16 cable analyzer.

