Ăëŕâíŕ˙ ńňđŕíčöŕ ÄîíÍŇÓ>
Ďîđňŕë ěŕăčńňđîâ ÄîíÍŇÓ>
Ăëŕâíŕ˙ ńňđŕíčöŕ ěŕăčńňđŕ ÄîíÍŇÓ Ęđčëĺâč÷ Ĺ.Ä.
Áčáëčîňĺęŕ
AUTHOR INFORMATION
Name: Ibrahim Djamaluddin
Organization: Institute of Environmental Systems,
Kyushu University, JAPAN
E-mail: ibrahim@ies.kyushu-u.ac.jp
Čńňî÷íčę:
http://gis.esri.com/library/userconf/proc05/papers/pap1157.pdf
Development of GIS-based analytical metod for predicting mining subsidence
ABSTRACT:Surface subsidence due to underground mining is a major problem, especially when stratified deposits are completely extracted. Extensively theoretical, laboratory and in situ test investigations have been carried out in many countries to develop mining subsidence prediction techniques. However, to predict subsidence on the large extraction area, complex seam layers, time dependence and three-dimensional (3D) visualization are main difficulties encountered in solving problems.
In this research, an integrated system has been developed within Geographic Information System (GIS) for predicting mining subsidence which includes various principal methods to obtain calculation of maximum subsidence, subsidence profiles, and spatial distribution of subsidence with induced large complex underground mining. A case study is presented to demonstrate the capability of the system. As the final result, it is found that the developed system is powerful and effective tool in GIS for complex mining subsidence prediction.
1 INTRODUCTION
Great efforts have been made in many countries to develop mining subsidence prediction methods. These methods have offered wide range of possibilities for subsidence prediction; however, since large area of excavation with the complex seam layers is a principal underground method of extraction, often making prediction difficult, especially with the effect of time dependence and three-dimensional (3D) analysis. Recently, Geographic Information Systems (GIS) is becoming powerful in many applications work for solving problems.
This not only pre and post processes that GIS can be used to develop applications, but also the spatial modeling based in GIS covering in significant depth within application specific development can be employed
In this research, based on stochastic method involved knothe time function, an integrated system has been developed within GIS for predicting 3D progressive mining subsidence. The developed system has capability to calculate movements and deformation at the surface points along any directions, horizontal or dipping seams, and overburden of layers with the results of subsidence, slope, curvature, horizontal displacement, and horizontal strain. In this paper, to develop an integrated system within a GIS platform,
the subsidence prediction model is taken into account to implement rigorous subsidence prediction in time and space. The developed system proposed here described and its actual application to complex underground mining in Japan is presented to demonstrate the capability of the method for prediction and protection of water reservoir against subsidence damage.
2 SUBSIDENCE PREDICTION MODEL
It is difficult to model mining subsidence since the overburden strata behave in a complex manner, depending upon its composition, fracture pattern, and surface topography. Often the subsidence is in discontinues steps, which may be hard to control or model. Several kinds of idealized medium have been used in mining subsidence prediction to model the rock masses. Among those frequently used are continuous media such as elastic, and elasto-plastic medium, as well as discontinuous media such as loose medium, and stochastic medium.
Because of jointing, the rock mass can be considered as a structure composed of a large number of rock blocks, which are different in size and shape but closely locked together. The degree of freedom of a single block is too large for classical mechanics to be able to define the motion trajectories of rock particles precisely (Gil, 1991). According to J. Litwiniszyn, a rock mass can be considered as a stochastic medium and its motion problem can be solved by stochastic method.
The stochastic method assumes the rock mass as a stochastic medium in an attempt to explain ground displacement behavior associated with mining subsidence. The development of movement in a stochastic medium may be explained in terms of a rhombic packing of spheres as shown in Figure 1.
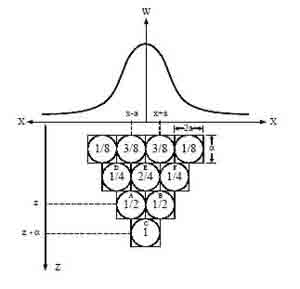
Figure 1. Development of movement in a stochastic medium.
If the sphere in field C is removed, a neighboring higher sphere from field A or B can only fill the vacant space. Consequently, the probability that the sphere A with centre-point coordinates (x-a, z) and sphere B (x+a, z) occupying the empty field C (x, z+a) is represented as:

The distribution of probabilities governing changes of place in all the various fields, or the graph of probability values, i.e. the frequency of sphere exchanges, representing in fact infinitesimal
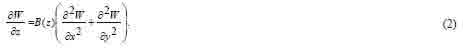
subsidence movements w, resembles the bell-shaped Gaussian curve. The fundamental stochastic equation for the infinitesimal subsidence W of a point of space (x, y, z) in flat-lying measures therefore runs as follows, in Cartesian coordinates:
where is the coefficient depending on z.
The fundamental of stochastic model can also be solved for tabular evaluation of working panel in flat-lying measures. Based on GIS platform, the illustration of GIS 3D-polygon as working panel for calculating subsidence at GIS grid points as surface points is shown in figure 2. The calculation point P (x, y) being located at the origin of the local coordinates, the subsidence of a surface point P can be derived as follows:
br>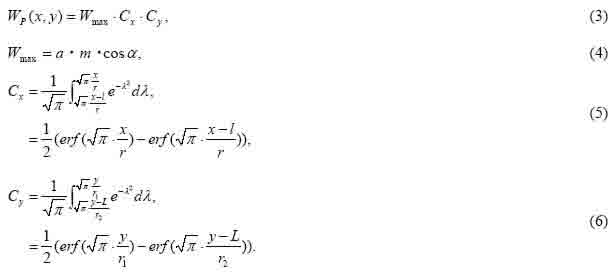
where W max= maximum subsidence; a = subsidence factor; m = seam thickness; maxWa= angle of dip; l = panel length along strike; L = panel width along dip; r = H/tanβ, r1 = H1/tan1β, r2 = H2/tan2β, radius of the influence circle; tanβ = tangent of draw angle; and H = depth along strike, H1 = depth along the boundary of rise side, H2 = depth along the boundary of dip side.
The subsidence phenomena have been clearly shown that the effects of mining do not spread out immediately but progressively. Based on Knothe time function model, subsidence develops with time as overlying rock mass presses onto the goaf at a rate governed by:
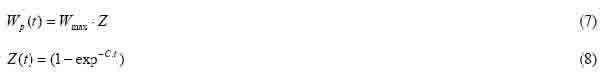
where C = factor of proportionality which related to the physical and mechanical properties of the overburden rockmass; t = time; Wp = subsidence at the moment t; Z = subsidence time factor.
Finally, fundamental stochastic equation integrated with knothe time function for calculating progressive surface subsidence can be derived as follow:
Finally, fundamental stochastic equation integrated with knothe time function for calculating progressive surface subsidence can be derived as follow:

Consequently, the progressive horizontal displacement, progressive slope, progressive curvature and progressive horizontal strain can be obtained similarly.
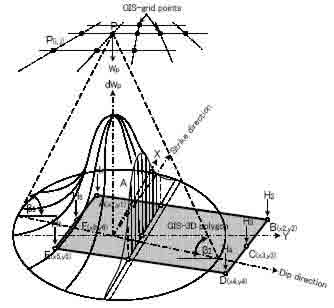
Figure2. Illustration of subsidence calculation in GIS
3 PREDICTION SYSTEM IN GIS
In recent years, GIS is becoming a useful tool in many applications, since it has emerged as a powerful and sophisticated means to manage vast amounts of geographic data. The integrated system has been developed in GIS with Visual Basic (VB) based on Component Object Model (COM) technology.
The developed system was packaged as an extension called Mining Subsidence Damage Assessment Systems GIS (MSDAS-GIS), to provide the input and output interfaces directly accessing spatial data and attribute data in GIS. There are three main processes in order to calculate subsidence in GIS; these are divided into pre-process, calculation and post-process.
GIS is capable to support application in pre and post processes directly. The structure of subsidence calculation in GIS is shown in Figure 3. In the pre-process, GIS provides spatial tools to analyze complex seam layers.
The case of inclination panels in which a strike and dip direction is required for input inclination parameters, combination of spatial analysis and TIN (triangular irregular network) analysis is used to analyze and identify inclination of each 3D coal panel. 3D-polygon (vector GIS) is a geometry and boundary condition of coal panels extraction. In fact, a 3D-polygon has spatial geometry and attribute parameter data and used for the input and extract data for calculation process.
All the calculations were processed in GIS system which allows the subsidence calculation with the increment of coal panels and with the effect of time dependence. In the post-process, GIS allows calculation results directly to be visualized in 3D with underground excavation layers.
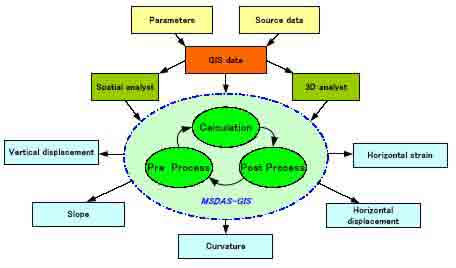
Figure3. Structure of subsidence calculation in GIS
4 A STUDY CASE
4.1 Background
The study area exists as water reservoir covering 30 km2 is located in western part of Kita-Kyushu City, Japan. There are four dams along the reservoir with the elevation and length of 23.5/217.6 m, 18.0/49.4 m, 21.0/186.2 m and 17.0/76.3 m, respectively. Coal mining was started from 1944 and finished in 1965.
The direction of coal seam along the strike is N20°~30°SW and dip direction is 15°-20°NE according to the geological condition in mining practices and borehole data at several observation points in the previous study.
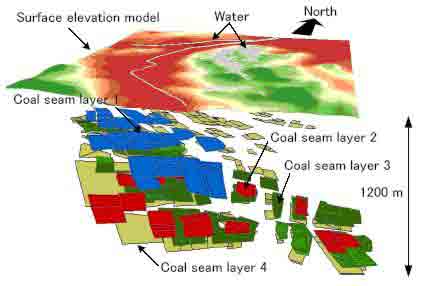
Figure 4: 3D view of underground coal mining around water reservoir area
There are four levels of coal seam layers with excavation depth ranged from 200 m to 1200 m, thickness of first, second, third, and fourth coal seam layers are 1.20 m, 0.83 m, 1.43 m, and 1.80 m, respectively. The extraction applied is the longwall method. Figure 4 shows the 3D view of extracted panel area for 22-year excavation period based on the map of coal excavation.
4.2 GIS support for analysis panels inclination
The extraction of longwall by working along the strike of a steeply inclined seam gives rise to the general characteristic of subsidence. It is more important to analyze and identify dipping seam direction of each extraction panel to produce accuracy in predicting mining subsidence. In this case, the depths of observation points at each seam can be used to analyze and identify the dip direction of panels using the combination of spatial analyst and 3D analyst tools of GIS.
The strike and dip direction of coal panels extraction map were analyzed using GIS is shown in Figure 5.
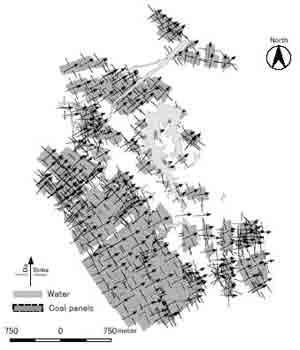
Figure5. Strike and dip directions of coal panels map analyzed by GIS
4.3 Subsidence prediction
The aim of this prediction is to protect and control a kind of water reservoir against mining subsidence damage. Sequential subsidence calculations simulating the excavation process between 1944 and 1967 were carried out employing parameters of a = 0.85, tan &946 = 1.428, b = 0.21, z1 = 0.83, z2 = 0.90, z3 = 1 obtained from previously monitoring results. Effect of time factor which expresses
the time-dependent development of subsidence shows the final value completed in three years after excavation panel even at depth, and the maximum subsidence is 3.27 m up to 1967. The water reservoir map and measured point’s value for horizontal strains in term of years along the survey line on the reservoir dams is shown in Figure 6. The calculation of the maximum horizontal compressive strain and horizontal tensile strain each year can be obtained.
The comparisons of calculated and measured horizontal strain values were located in reservoir concrete dams and reservoir bottom are shown in Figure 7(a-d). Detailed sequential increasing rigorous subsidence year by year can also be simulated successfully is shown in Figure 8. 3D view of final subsidence prediction modeling with underground excavation layers is shown in Figure 9.
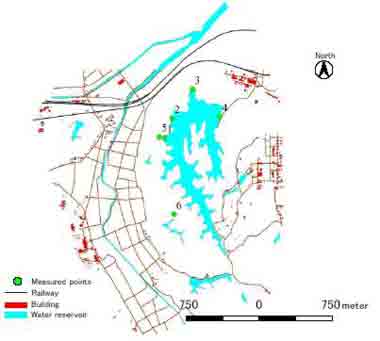
Figure 6. Water reservoir map and location of measured points
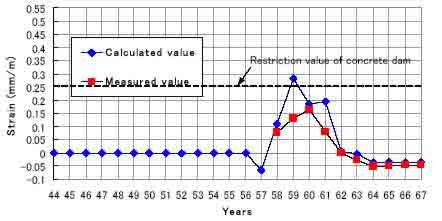
Figure 7a. Comparison of calculated and measured strain value at point 3
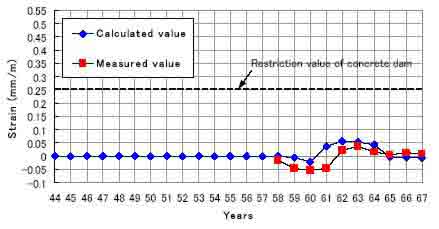
Figure 7b. Comparison of calculated and measured strain value at point 4
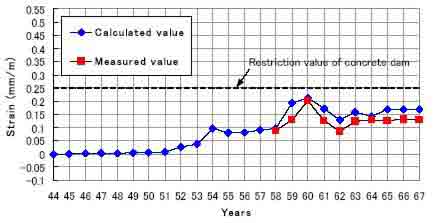
Figure 7c. Comparison of calculated and measured strain value at point 5
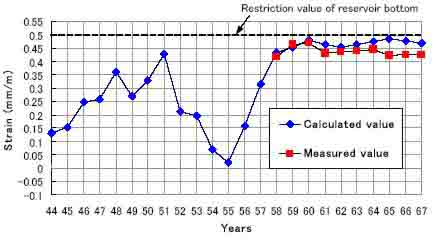
Figure 7d. Comparison of calculated and measured strain value at point 6
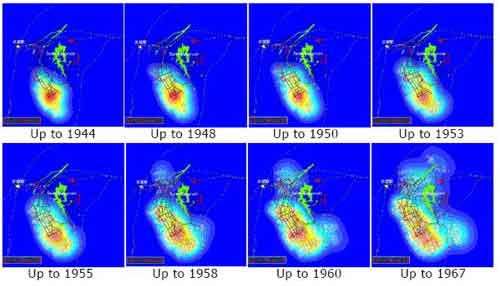
Figure 8: Rigorous subsidence simulation in term of year
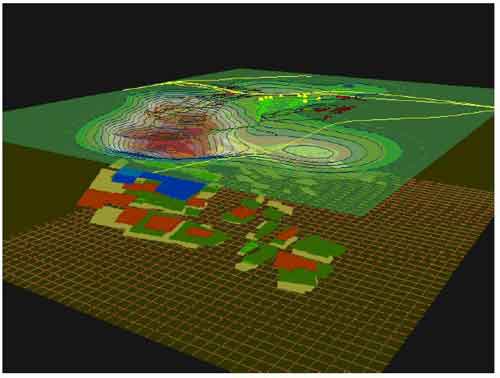
Figure 8: 3D view of final subsidence prediction modeling
5 CONCLUSIONS
The developed system has capability to predict 3D progressive surface subsidence at the surface points along any directions, horizontal or dipping seams, and overburden of layers with the results of subsidence, slope, curvature, horizontal displacement, and horizontal strain. With the help of GIS functions, it is possible to analyze complex seam layers for accurate input parameters and effectively organizes data on large extraction area specifically in case of time-dependence.
The study area exists as water reservoir covering 30 km2 is successfully simulated and predicted subsidence in time and space during 22-year excavation periods for protecting against subsidence damage. The comparison of subsidence predicted and measured values show good agreements and prediction result is sufficient enough for mining risk assessment. Also, this method can expect the more rational mining design and planning which enables a more effective recovery and safety.
6 REFERENCES
TBraeuner, G. 1973. Subsidence due to underground mining. Theory and practices in predicting surface deformation, US.IC 8571.
Esaki, T. et al. 2003. Development of GIS-based rigorous subsidence prediction system for protecting surface environment. Proc. of 1st Kyoto Int. Symp.on Underground environment: 253-260.
Esaki, T. et al. 2004. Synthesis subsidence prediction method due to underground mining integrated with GIS. Proc. of 3rd Kyoto Int. Symp.of ISRM Asian rock mechanics symposium: 147-152.
Fortheringham, S.A., Wegener, M. 2000. Spatial models and GIS, new potential and new models. London: Taylor & Francis
GIL, H. 1991. The theory of strata mechanics. Development in geotechnical engineering: vol.63, Amsterdam-Oxford- New York-Tokyo: Elsevier
 íŕ÷ŕëî