Источник: John Heidemann's web site
http://www.isi.edu/~johnh/PAPERS/Estrin00b.pdf
Network Visualization with the VINT Network Animator Nam
Deborah Estrin, Mark Handley, John Heidemann,
Steven McCanne, Ya Xu, Haobo Yu
USC Computer Science Department Technical Report 99-703b
March 1999 (revised November 1999)
Abstract
Protocol design requires understanding state distributed across many nodes, complex message exchanges,
and with competing traffic. Traditional analysis tools
(such as packet traces) too often hide protocol dynamics in a mass of extraneous detail.
This paper presents nam , a network animator that
provides packet-level animation and protocol-specific
graphs to aid the design and debugging of new network protocols. Taking data from network simulators
(such as ns) or live networks, nam was one of the first
tools to provide general purpose, packet-level, network
animation. Nam now integrates traditional time-event
plots of protocol actions and scenario editing capabilities. We describe how nam visualizes protocol and
network dynamics.
Keywords: network protocol visualization, packet-level animation, Internet protocol design, network sim-
ulation, ns, nam
1 Introduction
Designers of network protocols face many dificult
tasks, including simultaneous monitoring of the state
of a potentially large number of nodes (for example,
in multipoint protocols), understanding and analyzing
complex message exchange, and characterizing dynamic interactions with competing trafic.
Traditionally, packet traces have been used to accomplish these tasks. However, packet traces have two
major drawbacks: they present an incredible amount of
detail, which challenges the designer's ability to comprehend the data, and they are static, which hides an
important dimension of protocol behavior. As a result,
detailed analysis frequently becomes tedious and errorprone. Although network simulators such as ns [2] can
easily generate numerous detailed traces, they provide
limited help in analyzing and understanding the data.
Network-specific visualization tools address this
problem, allowing the user to take in large amounts
of information quickly, to visually identifying patterns
in communication, and to better understand causality and interaction. This paper presents nam , a network animator that provides packet-level animation
and protocol-specific graphs to aid the design and debugging of new network protocols (Figure 1). Nam
was one of the first tools to provide general purpose,
packet-level, network animation. Recent work has integrated traditional time-event plots of protocol actions
and added scenario editing capabilities. Nam benefits
from a close relationship with ns, the VINT project's
network ns [2] which can collect detailed protocol information from a simulation. With some pre-processing,
nam can also be used to visualize data taken directly
from real network traces.
Related Work (sidebar)
Network protocol visualization has been explored in
many contexts, beginning with static protocol graphs,
and visualization of large-scale tra?c, more recently
including simulation visualizations and editors.
Graphs of packet exchanges are very useful at understanding cause-and-effect in complex protocols like
TCP. Work at MIT [10] and the University of Arizona [3] is typical: graphs show time against TCP sequence numbers on a 2-D graph, possibly with annotations to show special events. Similar time-event graphs
have proven useful in understanding reliable multicast
behavior in SRM [5]. Although nam graphs are not
as detailed as the most sophisticated of these graphs, they are integrated with the packet animation and
time control. We plan to develop APIs to allow the
end-user to annotate graphs with the details relevant
to their protocol or protocol modifications.
Several groups have looked at visualization of large,
static network data sets. Important questions include
use of layouts based on real-world geography or network topology, how best to use animation, color, and 3-
D. More generally, many researchers tackled the problem of visualization of complex data (for an overview
of several approaches, see Robertson et al. [9]). Systems like these share the principle that multiple linked
views are essential in visualizing complex data. Nam
adopts this principle. It organizes visualization around
the main topology view, from which a number of specialized views may be derived. These systems tend
to focus on representing aggregate network data (traffic
ows) to understand and monitor tra?c patterns,
rather than the packet-level detail necessary to design
new protocols.
Several Network simulation systems include explicit
support for visualization, either customized to a particular end-application or more general. Opnet includes
visualization capabilities and Simphony [7] explicitly
includes packet-level animation. Nam differs from this
work by supporting different views of the data (packet
animation and time-event graphs).
Nam is quite late in providing a GUI front-end to
defining new simulations. Systems such as Opnet and
Parsec [1] have provided this capability for some time.
CMU's ad-hockey was designed explicitly to support
node movement [11]. We believe GUI network editors are of most benefit to novice users or users run-
ning small simulations, we advocate using a scripting
language to construct large or complex simulations.
Nam's editing capabilities are therefore not as complete
as other similar systems since nam outputs a script
which can be extended by hand to access complete ns
functionality.
2 Nam Basics
Nam interprets a trace file containing time-indexed
network events to animate network traffic in several
different ways (Figure 2). Typically this trace is generated from an ns simulation, but it can also be generated by processing data taken from a live network to produce a nam trace. Nam usually runs offline with
the traces stored on disk, but it can also play traces
from a running program through a Unix pipe.
A nam input file contains all information needed for
the animation: both the static network layout and dynamic events such as packet arrivals, departures, and
drops and link failures. Wireless networking simulations include node location and movement.
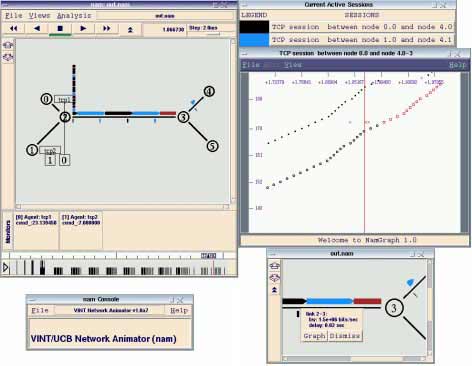
Figure 1 shows a typical nam session. On the top
left, the main window shows packet animations. The
visual size and speed of packets is proportional to packet length and the link bandwidth and delay; link 2{3 is
full of TCP data moving along the top and return acknowledgement tra?c along the bottom in the reverse
direction. Packet color is used for different things; in
this case it differentiates two different data streams
(black and blue) and a red packet carrying a congestion signal. Packets move from node to node along
links, and are queued up when links are full (for example, there is a large queue near node 2 corresponding
to the busy link between nodes 2 and 3). Below it (in
the same window) are several statistical summaries of
what is happening. Boxes labeled \monitors" correspond to parameters of protocols running on particu-
lar nodes. The graph across the bottom of the window
shows the utilization of a link as a function of time.
The smaller bottom-right window is zoomed in on part
of the same network. The window on the center-right
shows a protocol-specific time-event graph of a particular
ow on a given link. In this case, it plots TCP
sequence numbers against time using different symbols
to show data packets, acknowledgements, and acknowledgements which include explicit congestion information.
Multiple copies of nam may be executed simultaneously, in which case they may be driven in lock-step.
With this synchronized, simultaneous ability to visualize the output of more than one simulation trace file,
side-by-side comparisons are made possible. Such com-
parisons are especially useful for investigating protocol sensitivity to input parameters in the same simulation scenario (as in [5], for example).
3 Packet Animation
The core of nam is packet animation. Figure 3 shows
a typical packet animation (taken from [13]). Three
variants of the TCP protocol are being used to send
data from web servers on the right to clients on the
left. Animation here allows the viewer to quickly take
in the status of each part of the network (the top link
is severely congested and dropping packets, the middle
link is slightly busier than bottom link), and to quickly compare the algorithms (the middle variation has
one extra magenta packet while the top version sends
many back-to-back packets). Nam allows the animation speed to be adjusted and played forwards or backwards, making it easy to find and examine interesting
occurrences.

The first step in a new animation is displaying the
network topology. Nam has three different topology
layout mechanisms to accommodate different needs.
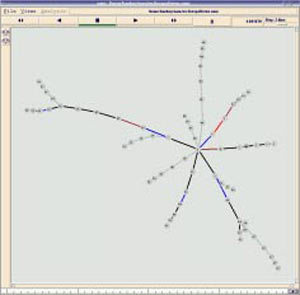
The default is an automatic layout algorithm based
on a spring-embedder model [6]; Figure 4 shows an example of this result. It assigns attractive forces on all
links and repulsive forces between all nodes, and tries to achieve balance through iteration. Automatic layout can produce reasonable layouts of many networks
without explicit user guidance, but it may not produce satisfactory results of complicated networks. As
a remedy, nam allows the user to graphically adjust
the resulting layout.
For smaller topologies, relative layout is possible.
The user specifies the relative directions of links (left,
up, down). Nam places nodes relative to each other
using link directions; link length is set proportional to
its bandwidth and delay. Relative layout works very
well for small topologies and has the desirable property
that packet movement rate is consistent with link delay
and bandwidth. The network in Figure 3 uses relative
layout. Disadvantages of relative layout are that the
user must specify the directions of each link, that not
all networks have a planer representation that satis-
fies delay constraints, and relative layout of a topology
containing very different delays can result in very short
links. For example, the 10Mb/s, 1ms delay links on the
left of Figure 3 are too short to observe packet
ow
when shown at the same scale as the 800Kb/s, 100ms
central link.
Finally, wireless layout assigns associates each node
with a physical location in a constrained area. Each
node's position is given by its 3-D coordinate (only the
two dimensions are currently used for visualization) in
the area and its velocity vector. Wireless visualizations
typically lack explicit links.
Packet animation is straightforward once the topol-
ogy is laid out. Trace events indicate when packets
enter and leave links and queues. Packets are shown
as rectangles with arrows at the front; queues as arrays
of squares (see the left window of Figure 1). Packets
can be colored based on codes set in the simulator or
pre-processing to identify source and destination pairs.
When queues fill, packets are literally dropped, shown
as small rolling squares falling to the bottom of the
display.
The only di?culty we encountered in implementing
packet animation is that some events are not present in
the trace file but must be generated on-the-
y. Our de-
sign philosophy was to make the trace file as explicit as
possible, but some trace events are animation specific
and so must be dynamically constructed. One example
is identifying when a dropped packet leaves the screen.
This event is not known by the simulator.
Users can control animation playback rate to focus
on interesting parts of the simulation. VCR-like but-
tons control forwards or backwards playback, while a
slider sets playback rate. Because some simulations
include dead time, periods of no packet activity can optionally be skipped. Interesting events in the trace
can be annotated, allowing a user to jump to those
events.
The animation window is interactive. Clicking on
packets, links, and nodes brings up pertinent informa-
tion, including statistics (described next).
In addition to packet animation, we have experi-
mented with ways to visualize other information. Node
color and shape can be specified, for example, to indi-
cate membership in a multicast group. Protocol agents
represent state of a protocol instance at an end-node.
Agents can be displayed as small labeled rectangles at-
tached to nodes.
Figure 4 shows one example of non-packet-level an-
imation. This figure shows the topology of a portion
the Internet multicast backbone (mbone) as of 1998.
To determine if mbone loss was primarily in the core
network or the edges we measured loss rates for various
links. In the figure, different loss rates are shown with
color which changes over time.
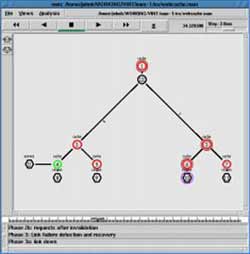
We have also found nam useful for application-level
visualization. In Figure 5 we use nam to visualize cache
coherence algorithms in a hierarchical web cache. Node
types are shown with shapes (the clients and server are
hexagons while caches are circles), Cache status (valid
or out of date) is shown with node color. Algorithm
status (refreshing a cache, etc.) is shown with rings
around nodes.
4 Network Statistics
The animation component of nam only displays a sub-
set of the simulation details present in the trace output.
Additional information, such as packet headers or pro-
tocol state variables, are handled by other nam compo-
nents. The statistics component provides three ways
to display this additional information. First, clicking
on any of the displayed objects (e.g. packets and pro-
tocol agents) will bring out a one-shot panel showing
object-specific information. Second, continuous moni-
toring of all available object-specific information may
be achieved by associating a monitor with entities of
interest. Monitors remain associated with an object
until explicitly removed by the user or until its under-
lying object is destroyed. These monitors are displayed
in a pane in nam's main window, as illustrated in Fig-
ure 1. Third, nam uses panes (the black stripes in
Figure 1) in the main window to display bandwidth u-
tilization and packet losses on links. Clicking on a link
brings out a selection panel, which allows the user to
open a new pane to display bandwidth utilization or
packet loss on the link.
5 Protocol-specific Graphs
In addition to detailed examination of individual sim-
ulation entities, nam supports protocol-specific rep-
resentations of information with time-event graphs
(where time is plotted against events such as an ad-
vancing sequence number or message transmission).
These graphs have long been used to understand TCP
behavior, and more recently to understand timer inter-
action in scalable reliable multicast [5].
Currently nam supports protocol graphs for TCP
and SRM. We plan to make this facility more generic
through a pluggable API for supporting other proto-
cols. Figure 6 shows SRM (center right) and TCP
(bottom center and bottom right) time-event graphs.
When a graph is first brought up a nam filter scans
the trace file to extract the relevant information for a
specific ow or protocol.

The advantage of integrating these views with nam
is that graphs and packet animation are synchronized.
Moving a time slider or by clicking on an interesting
event in any view updates the time in all views. Each
trace event is displayed in the consistent way (i.e., col-
or, shape, etc.) across views to help the user coordinate
events.
6 Scenario Creation and Editing
We use nam in two very complementary ways to assist
in scenario creation. First, we have recently extended
nam to include a scenario input facility. Using a tradi-
tional drawing approach the user can add nodes, links,
protocol agents. Nam then saves this scenario as an ns
simulation script (in Tcl) which will be processed by
the simulator.
Second, the ns scenario generator uses nam to visu-
alize large scenario topologies. The scenario generator
constructs these scenarios using tools such as Georgia
Tech's ITM [4]. Nam with autolayout then presents the
topology to the user for acceptance or regeneration.
Graphical scenario creation with nam is very appro-
priate for small scenarios with a few nodes and links.
We have been happy with the design choice of using
nam to produce scripts for these cases while starting
with scripts directly for larger, more complex, or auto-
mated simulations. For the ns target audience of proto-
col designers, the effort required to learn Tcl syntax is
small and this is more than offset in these scenarios by
the finer control afforded and the ability to use looping
constructs in place of repeated manual point-and-click
operations.
7 Future Work and Conclusions
Nam development is on-going. A number of incremen-
tal improvements are desired or planned. For example,
we would like to improve scenario editing capabilities,
and add support for entering mobile node tracks [11].
We would also like to experiment with adding audio
capabilities to the simulator. Two major focuses of fu-
ture work remain. First, we would like to make nam
much easier to extend, providing better internal APIs
to allow users to add custom controls to the output and
to control object rendering. An example application
would allow users to interactively control node colors
to indicate application-specific groups or characteris-
tics. Second, we are just beginning to understand how
to visualize large scale protocol actions. More work in
this area is needed.
Network protocol visualization is easy to dismiss s-
ince its contributions to protocol development are indi-
rect. Broader use of nam suggests that visualization is
more than just a tool for fancy demos, but that it can
substantially ease protocol debugging and help under-
stand dynamic behavior. Because of these reasons, a
growing number of researchers have used nam in their
work and papers [12, 8].
Acknowledgments
Steve McCanne wrote the original version of nam
in 1990 at Lawrence Berkeley National Laboratory.
Marylou Orayani made substantial contributions to
nam as part of her work at Berkeley in 1995 and 1996.
Since 1997 nam has been maintained and enhanced by
the VINT research project at USC/ISI, LBL, and Xerox PARC. Nam has also benefited from an enthusiastic
VINT and ns user community. We would like to thank
especially Elan Amir, Lee Breslau, Kevin Fall, Sally
Floyd, Ahmed Helmy, Polly Huang, Scott Shenker, and
Christos Papadopoulos. for their input to nam and this
paper.
References
[1] Bagrodia, R., Meyer, R., Takai, M., Chen,
Y., Zeng, X., Martin, J., and Song, H. Y.
PARSEC: A parallel simulation environment for
complex systems. IEEE Computer 31, 10 (Oct.
1998), 77{85.
[2] Bajaj, S., Breslau, L., Estrin, D., Fall,
K., Floyd, S., Haldar, P., Handley, M.,Helmy, A., Heidemann, J., Huang, P., Ku-
mar, S., McCanne, S., Rejaie, R., Sharma,
P., Varadhan, K., Xu, Y., Yu, H., and Zap-
pala, D. Improving simulation for network re-
search. IEEE Computer (2000). to appear, a pre-
liminary draft is currently available as USC tech-
nical report 99-702.
[3] Brakmo, L. S., O'Malley, S. W., and Pe-
terson, L. L. TCP Vegas: New techniques for
congestion detection and avoidance. In Proceed-
ings of the ACM SIGCOMM '93 (San Francisco,
CA, Sept. 1993), ACM.
[4] Calvert, K., Doar, M., and Zegura, E. W.
Modeling Internet topology. IEEE Communica-
tions Magazine 35, 6 (June 1997), 160{163.
[5] Floyd, S., Jacobson, V., Liu, C.-G., Mc-
Canne, S., and Zhang, L. A reliable multicast
framework for light-weight sessions and applica-
tion level framing. ACM/IEEE Transactions on
Networking 5, 6 (Dec. 1997).
[6] Fruchterman, T., and Reingold, E. Graph
drawing by force-directed placement. Software -
Practice and Experience 21, 11 (Nov. 1991), 1129{
1164.
[7] Huang, X. W., Sharma, R., and Keshav, S.
The Simphony protocol development environmen-
t. submitted for publication to Infocom '99, July
1998.
[8] Kermode, R. Scoped hybrid automatic repeat
request with forward error correction (SHAR-
QFEC). In Proceedings of the ACM SIGCOMM
(1998), pp. 278{289.
[9] Robertson, G. G., Card, S. K., and
MacKinlay, J. D. Information visualization us-
ing 3D interactive animation. Communications of
the ACM 36, 4 (Apr. 1993), 56{71.
[10] Shepard, T. J. TCP packet trace analysis. Tech.
Rep. 494, Massachusetts Institute of Technology,
Feb. 1991.
[11] The CMU Monarch Project. The CMU
Monarch Project's ad-hockey visualization Tool
for ns scenario and trace files. Carnegie-Mellon
University, Aug. 1998.
[12] Varadhan, K., Estrin, S., and Floyd, S. Im-
pact of network dynamics on end-to-end protocol-
s: Case studies in reliable multicast. In Proceed-
ings of the International Symposium on Comput-
ers and Communications (Aug. 1998). http://
www.isi.edu/~kannan/papers/iscc98.ps.gz.
[13] Visweswaraiah, V., and Heidemann, J. Im-
proving restart of idle TCP connections. Tech.
Rep. 97-661, University of Southern California,
Nov. 1997.
