


Spectroscopy
From Wikipedia, the free encyclopedia
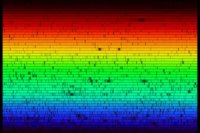
Extremely high resolution spectrum of the Sun showing thousands of elemental absorption lines (fraunhofer lines)
Spectroscopy is the study of matter and its properties by investigating light, sound, or particles that are emitted, absorbed or scattered by the matter under investigation.
Spectroscopy may also be defined as the study of the interaction between light and matter. Historically, spectroscopy referred to a branch of science in which visible light was used for theoretical studies on the structure of matter and for qualitative and quantitative analyses. Recently, however, the definition has broadened as new techniques have been developed that utilize not only visible light, but many other forms of electromagnetic and non-electromagnetic radiation: microwaves, radiowaves, x-rays, electrons, phonons (sound waves) and others. Impedance spectroscopy is a study of frequency response in alternating current.
Spectroscopy is often used in physical and analytical chemistry for the identification of substances through the spectrum emitted from them or absorbed in them. A device for recording a spectrum is a spectrometer. Spectroscopy can be classified according to the physical quantity which is measured or calculated or the measurement process.
Spectroscopy is also heavily used in astronomy and remote sensing. Most large telescopes have spectrographs, which are used either to measure the chemical composition and physical properties of astronomical objects or to measure their velocities from the Doppler shift of spectral lines.
Contents |
[edit] Physical quantity measured
The type of spectroscopy depends on the physical quantity measured. Normally, the quantity that is measured is an amount or intensity of something.
- The intensity of emitted electromagnetic radiation and the amount of absorbed electromagnetic radiation are studied by electromagnetic spectroscopy (see also cross section).
- The amplitude of macroscopic vibrations is studied by acoustic spectroscopy and dynamic mechanical spectroscopy.
- Kinetic energy of particles is studied by electron energy loss spectroscopy and Auger electron spectroscopy (see also cross section).
- The mass-to-charge ratios of molecules and atoms are studied in mass spectrometry, sometimes called mass spectroscopy. Mass spectrometry is more of a measuring technique (metric) than an observation (scopic) technique but can produce a spectrum of masses, a mass spectrum, similar in appearance to other spectroscopy techniques.
- The number of molecules or atoms or quantum-mechanical states to which the frequency or energy parameter applies. In this case the spectrum is usually called cross section.
[edit] Measurement process
Different types of spectroscopy use different measurement processes:
[edit] Three main types of spectroscopy
Absorption spectroscopy uses the range of electromagnetic spectra in which a substance absorbs. In atomic absorption spectroscopy, the sample is atomized and then light of a particular frequency is passed through the vapour. After calibration, the amount of absorption can be related to the concentrations of various metal ions through the Beer-Lambert law. The method can be automated and is widely used to measure concentrations of ions such as sodium and calcium in blood. Other types of spectroscopy may not require sample atomization. For example, ultraviolet/visible (UV/ Vis) absorption spectroscopy is most often performed on liquid samples to detect molecular content and infrared (IR) spectroscopy is most often performed on liquid, semi-liquid (paste,grease,and petroleum jelly), dried, or solid samples to determine molecular information, including structural information.
Emission spectroscopy uses the range of electromagnetic spectra in which a substance radiates. The substance first absorbs energy and then radiates this energy as light. This energy can be from a variety of sources, including collision (either due to high temperatures or otherwise), and chemical reactions.
Scattering spectroscopy measures certain physical properties by measuring the amount of light that a substance scatters at certain wavelengths, incident angles, and polarization angles. Scattering spectroscopy differs from emission spectroscopy due to the fact that the scattering process is much faster than the absorption/emission process. One of the most useful applications of light scattering spectroscopy is Raman spectroscopy.
[edit] Common types of spectroscopy

Fluorescence spectroscopy Fluorescence spectroscopy uses higher energy photons to excite a sample, which will then emit lower energy photons. This technique has become popular for its biochemical and medical applications, and can be used for confocal microscopy, fluorescence resonance energy transfer, and fluorescence lifetime imaging.
X-ray spectroscopy and X-ray crystallography When X-rays of sufficient frequency (energy) interact with a substance, inner shell electrons in the atom are excited to outer empty orbitals, or they may be removed completely, ionizing the atom. The inner shell "hole" will then be filled by electrons from outer orbitals. The energy available in this de-excitation process is emitted as radiation (fluorescence) or will remove other less-bound electrons from the atom (Auger effect). The absorption or emission frequencies (energies) are characteristic of the specific atom. In addition, for a specific atom small frequency (energy) variations occur which are characteristic of the chemical bonding. With a suitable apparatus, these characteristic X-ray frequencies or Auger electron energies can be measured. X-ray absorption and emission spectroscopy is used in chemistry and material sciences to determine elemental composition and chemical bonding.
X-ray crystallography is a scattering process; crystalline materials scatter X-rays at well-defined angles. If the wavelength of the incident X-rays is known, this allows calculation of the distances between planes of atoms within the crystal. The intensities of the scattered X-rays give information about the atomic positions and allow the arrangement of the atoms within the crystal structure to be calculated.
[edit] Flame Spectroscopy
Liquid solution samples are aspirated into a burner or nebulizer/burner combination, desolvated, atomized, and sometimes excited to a higher energy electronic state. The use of a flame during analysis requires fuel and oxidant, typically in the form of gases. Common fuel gases used are acetylene (Ethyne) or hydrogen. Common oxidant gases used are oxygen, air, or nitrous oxide. These methods are often capable of analyzing metallic element analytes in the part per million, billion, or possibly lower concentration ranges. Light detectors are needed to detect light with the analysis information coming from the flame.
- Atomic Emission Spectroscopy - This method uses flame excitation; atoms are excited from the heat of the flame to emit light. This method commonly uses a total consumption burner with a round burning outlet. A higher temperature flame than atomic absorption spectroscopy (AA) is typically used to produce excitation of analyte atoms. Since analyte atoms are excited by the heat of the flame, no special elemental lamps to shine into the flame are needed. A high resolution polychromator can be used to produce an emission intensity vs. wavelength spectrum over a range of wavelengths showing multiple element excitation lines, meaning multiple elements can be detected in one run. Alternatively, a monochromator can be set at one wavelength to concentrate on analysis of a single element at a certain emission line. Plasma emission spectroscopy is a more modern version of this method. See Flame emission spectroscopy for more details.
- Atomic absorption spectroscopy (often called AA) - This method commonly uses a pre-burner nebulizer (or nebulizing chamber) to create a sample mist and a slot-shaped burner which gives a longer pathlength flame. The temperature of the flame is low enough that the flame itself does not excite sample atoms from their ground state. The nebulizer and flame are used to desolvate and atomize the sample, but the excitation of the analyte atoms is done by the use of lamps shining through the flame at various wavelengths for each type of analyte. In AA, the amount of light absorbed after going through the flame determines the amount of analyte in the sample. A graphite furnace for heating the sample to desolvate and atomize is commonly used for greater sensitivity. The graphite furnace method can also analyze some solid or slurry samples. Because of its good sensitivity and selectivity, it is still a commonly used method of analysis for certain trace elements in aqueous (and other liquid) samples.
- Atomic Fluorescence Spectroscopy - This method commonly uses a burner with a round burning outlet. The flame is used to solvate and atomize the sample, but a lamp shines light at a specific wavelength into the flame to excite the analyte atoms in the flame. The atoms of certain elements can then fluoresce emitting light in a different direction. The intensity of this fluorescing light is used for quantifying the amount of analyte element in the sample. A graphite furnace can also be used for atomic fluorescence spectroscopy. This method is not as commonly used as atomic absorption or plasma emission spectroscopy.
Plasma Emission Spectroscopy In some ways similar to flame atomic emission spectroscopy, it has largely replaced it.
- Direct-current plasma (DCP)
- Glow discharge-optical emission spectrometry (GD-OES)
- Laser Induced Breakdown Spectroscopy (LIBS) (LIBS), also called Laser-induced plasma spectrometry (LIPS)
- Microwave-induced plasma (MIP)
Spark or arc (emission) spectroscopy - is used for the analysis of metallic elements in solid samples. For non-conductive materials, a sample is ground with graphite powder to make it conductive. In traditional arc spectroscopy methods, a sample of the solid was commonly ground up and destroyed during analysis. An electric arc or spark is passed through the sample, heating the sample to a high temperature to excite the atoms in it. The excited analyte atoms glow emitting light at various wavelengths which could be detected by common spectroscopic methods. Since the conditions producing the arc emission typically are not controlled quantitatively, the analysis for the elements is qualitative. Nowadays, the spark sources with controlled discharges under an argon atmosphere allow that this method can be considered eminently quantitative, and its use is widely expanded worldwide through production control laboratories of foundries and steel mills.
[edit] Visible spectroscopy
Many atoms emit or absorb visible light. In order to obtain a fine line spectrum, the atoms must be in a gas phase. This means that the substance has to be vaporised. The spectrum is studied in absorption or emission. Visible absorption spectoscopy is often combined with UV absorption spectroscopy in UV/Vis spectroscopy.
[edit] Ultraviolet spectroscopy
All atoms absorb in the UV region because photons are energetic enough to excite outer electrons. If the frequency is high enough, photoionisation takes place. UV spectroscopy is also used in quantifying protein and DNA concentration as well as the ratio of protein to DNA concentration in a solution. Several amino acids usually found in protein, such as tryptophan, absorb light in the 280nm range and DNA absorbs light in the 260nm range. For this reason, the ratio of 260/280nm absorbance is a good general indicator of the relative purity of a solution in terms of these two macromolecules. Reasonable estimates of protein or DNA concentration can also be made this way using Beer's law.
[edit] Infrared spectroscopy
Infrared spectroscopy offers the possibility to measure different types of interatomic bond vibrations at different frequencies. Especially in organic chemistry the analysis of IR absorption spectra shows what type of bonds are present in the sample.
[edit] Thermal infrared spectroscopy
Thermal infrared spectroscopy measures thermal radiation emitted from materials and surfaces and is used to determine the type of bonds present in a sample as well as their lattice environment. The techniques are widely used by organic chemists, mineralogists, and planetary scientists.
[edit] Nuclear magnetic resonance spectroscopy
Nuclear magnetic resonance spectroscopy analyzes certain atomic nuclei to determine different local environments of hydrogen, carbon, or other atoms in the molecule of an organic compound or other compound. This is used to help determine the structure of the compound.
[edit] Photoemission spectroscopy
[edit] Less frequently used / combined spectroscopy
- Raman spectroscopy uses the inelastic scattering of light to analyse vibrational and rotational modes of molecules. The resulting 'fingerprints' are an aid to analysis.
- Inelastic neutron scattering works like Raman spectroscopy, with neutrons instead of light.
- Raman Optical Activity spectroscopy exploits Raman scattering and optical activity effects to reveal detailed information on chiral centres in molecules.
- Auger electron spectroscopy is a method used to study surfaces of materials on a micro-scale. It is often used in connection with electron microscopy.
- Fourier transform is an efficient method for collecting various spectra. The use of Fourier transform in spectroscopy is called Fourier transform spectroscopy. Nearly all infrared spectroscopy (FTIR) and nuclear magnetic resonance (NMR) spectroscopy are performed with Fourier transforms.
- Spectroscopy of matter in situations where the properties are changing with time is called Time-resolved spectroscopy.
- Spectroscopy using an AFM-based analytical technique is called Force spectroscopy.
- Dielectric spectroscopy
- Circular Dichroism spectroscopy
- Cavity ring down spectroscopy
[edit] Quadratic Compression Conversion (QCC) Algorithm
The QCC algorithm is a transform used in spectroscopic applications. Transforms have been used for many years to enhance statistics – for example the FFT algorithm used to enhance x-ray imaging. QCC is based on an algorithm related to the square root of the isotope’s energy line(s). This optimizes the spectrum so that peaks are well separated at high, low, and all energies in between. In conventional spectroscopy you can optimize the low energy at the expense of the high energy and vice versa. All peaks in the QCC spectrum fall into eleven channels.
QCC allows isotopes with low branching intensities to be identified in real time. The sensitivity arising from one-second data slices is greatly improved even down to background levels. For example, 137Cs at 10 microrem/h yields a sigma (standard deviation) above background of almost 20:1 in one second. This is important when identifying uranium and weapons-grade plutonium since these are best identified by their low abundant lines. QCC provides improvements in compensating for the drift of radiation detectors. Since the compression is a function of energy, the drift will be nearly compensated over a range of +/- 19 °F.
QCC technology is of particular importance in applications where a wide energy range must be monitored for unknown sources of radiation. The QCC process makes detection of peaks at all energies equally straight forward. Peaks at low energies are well resolved, while at high energies peaks are compressed so that the peak to background ratio is dramatically improved for a given number of counts. This directly translates into shorter counting times with better identification and analysis.
For more on QCC, see “QCC advantages” at www.berkeleynucleonics.com, QCC Patent Details at www.pgt.com , Large Scale Demonstration and Deployment Program at www.ineel.gov
[edit] Background Subtraction
Background subtraction is a term typically used in spectroscopy when one explains the process of acquiring a background radiation level (or ambient radiation level) and then makes an algorithmic adjustment to the data to obtain qualitative information about any deviations from the background, even when they are an order of magnitude less decipherable than the background itself.
Background subtraction can effect a number of statistical calculations (Continuum, Compton, Bremsstrahlung) leading to improved overall system performance.
[edit] See also
- Atomic spectroscopy
- Gamma spectroscopy
- Astronomical spectroscopy
- Coherent spectroscopy
- Cold vapour atomic fluorescence spectroscopy
- Rotational spectroscopy
- Vibrational spectroscopy
- Infrared spectroscopy
- Rigid rotor
- EPR spectroscopy
- Spectral power distributions
- Metamerism (color)
- Spectral reflectance
- Spectrophotometry
- Laser Induced Breakdown Spectroscopy (LIBS)
- Absorption cross section
- Scattering theory
- Scanning tunneling spectroscopy
- UV/VIS spectroscopy
- Spectrum analysis
- Spectroscopic notation
- Joseph von Fraunhofer
- Robert Bunsen
- Gustav Kirchhoff
[edit] External links
- Spectroscopy Applications - Spectroscopy application information and product recommendations from PI/Acton.
- Spectral Calculator - Fast and accurate online calculation of molecular absorption spectra.
- Molecular Database Browser - Browse the HITRAN or GEISA databases. Plot absorption lines by position or intensity.
- Cosmic Journey: A History of Scientific Cosmology from the American Institute of Physics
- The Science of Spectroscopy - supported by NASA, includes OpenSpectrum, a Wiki-based learning tool for spectroscopy that anyone can edit
- Atomic Emission Spectroscopy
- A Short Study of the Characteristics of two Lab Spectroscopes
- NIST government spectroscopy data
- Quantum Chemistry I Lecture
- Power Technology - In depth look at Raman Spectroscopy
- Potentiodynamic Electrochemical Impedance Spectroscopy
- Algorithms used in Spectroscopy