FINDING THE OPTIMAL f BY THE GEOMETRIC MEAN
In trading we can count
on our wins being for varying amounts and our losses being for varying
amounts. Therefore the Kelly formulas could not give us the correct optimal
f. How then can we find our optimal f to know how many contracts to have on
and have it be mathematically correct?
Here is the solution. To begin with, we must amend our formula for finding
HPRs to incorporate f:
(III) HPR = 1 + f * ( -Trade/Biggest loss)
where f = The
value we are using for f.
-Trade = The profit or loss on a trade (with the sign reversed so that
losses are positive numbers and profits are negative).
Biggest Loss = The P&L that resulted in the biggest loss. (This should
always be a negative number.)
And again, TWR is simply the geometric product of the HPRs and geomet¬ric
mean (G) is simply the Nth root of the TWR.
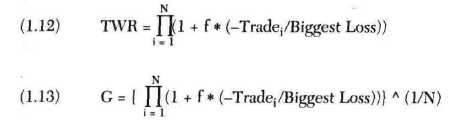
-Tradei = The profit or loss on the ith trade (with the sign
reversed so that losses are positive numbers and profits are negative).
Biggest Loss = The P&L that resulted in the biggest loss. (This should
always be a negative number.)
N = The total number of trades.
G = The geometric mean of the HPRs.
By looping through all values forfbetween .01 and 1, we can find that
value for f which results in the highest TWR. This is the value for f
that would provide us with the maximum return on our money using fixed
frac¬tion. We can also state that the optimal f is the f that yields the
highest geometric mean. It matters not whether we look for highest TWR or
geometric mean, as both are maximized at the same value for f.
Doing this with a computer is easy, since both the TWR curve and the
geometric mean curve are smooth with only one peak. You simply loop from f =
.01 to f = 1.0 by .01. As soon as you get a TWR that is less than the
previous TWR, you know that the f corresponding to the previous TWR is the
optimal f. You can employ many other search algorithms to facilitate this
process of finding the optimal fin the range of 0 to 1. One of the fastest
ways is with the parabolic interpolation search procedure detailed in
Portfolio Management Formulas.
TO SUMMARIZE THUS FAR
You have seen that a good system is the one with the highest geometric mean.
Yet to find the geometric mean you must know f. You may find this confusing.
Here now is a summary and clarification of the process:
1. Take the trade listing of a given market system.
2. Find the optimal f, either by testing various f values from 0 to 1 or
through iteration. The optimal f is that which yields the highest TWR.
3. Once you have found f, you can take the Nth root of the TWR that
corresponds to your f, where N is the total number of trades. This
isyour geometric mean for this market system. You can now use this
geometric mean to make apples-to-apples comparisons with other
market systems, as well as use the f to know how many contracts to
trade for that particular market system.
Once the highestfis found, it can readily be turned into a dollar amount
by dividing the biggest loss by the negative optimalf. For example, if
our biggest loss is $100 and our optimal f is .25, then -$100/-.25 = $400.
In other words, we should bet 1 unit for every $400 we have in our stake.
If you're having trouble with some of these concepts, try thinking in terms
of betting in units, not dollars (e.g., one $5 chip or one futures contract
or one 100-share unit of stock). The number of dollars you allocate to each
unit is calculated by figuring your largest loss divided by the negative
optimal f.
The optimal f is a result of the balance between a system's profit-making
ability (on a constant 1 -unit basis) and its risk (on a constant 1 -unit
basis).
Most people think that the optimal fixed fraction is that percentage of your
total stake to bet. This is absolutely false. There is an interim step
involved. Optimal f is not in itself the percentage of your total stake to
bet, it is the divisor of your biggest loss. The quotient of this division
is what you divide your total stake by to know how many bets to make or
contracts to have on.
You will also notice that margin has nothing whatsoever to do with what is
the mathematically optimal number ofcontracts to have on. Margin doesn't
matter because the sizes of individual profits and losses are not the
product of the amount of money put up as margin (they would be the same
whatever the size of the margin). Rather, the profits and losses are the
prod¬uct of the exposure of 1 unit (I futures contract). The amount put up
as margin is further made: meaningless in a money-management sense, because
the size of the loss is not limited to the margin.
Most people incorrectly believe that f is a straight-line function rising up
and to the right. They believe this because they think it would mean that
the more you are willing to risk the more you stand to make. People reason
this way because they think that a positive mathematical expectancy is just
the mirror image of a negative expectancy. They mistakenly believe that if
increasing your total action in a negative expectancy game results in losing
faster, then increasing your total action in a positive expectancy game will
result in winning faster. This is not true. At some point in a positive
expectancy situation, further increasing your total action works against you.
That point is a function of both the system's profitability and its
consistency (i.e., its geometric mean), since you are reinvesting the
returns back into the system.
It is a mathematical fact that when two people face the same sequence of
favorable betting or trading opportunities, if one uses the optimal f and
the other uses any different money-management system, then the ratio of the
optimal f bettor's stake to the other person's stake will increase as time
goes on, with higher and higher probability. In the long run, the optimal f
bettor will have infinitely greater wealth than any other money-management
sys¬tem bettor with a probability approaching 1. Furthermore, if a bettor
has the goal of reaching a specified fortune and is facing a series of
favorable betting or trading opportunities, the expected time to reach the
fortune will be lower (faster) with optimal f than with any other betting
system.
Let's go back and reconsider the following sequence of bets (trades):
+9, +18, +7, +1, +10,-5,-3,-17,-7
Recall that we determined earlier in this chapter that the Kelly formula was
not applicable to this sequence, because the wins were not all for the same
amount and neither were the losses. We also decided to average the wins and
average the losses and take these averages as our values into the Kelly
formula (as many traders mistakenly do). Doing this we arrived at an f value
of .16. It was stated that this is an incorrect application of Kelly, that
it would not yield the optimal f. The Kelly formula must be specific to a
single bet. You cannot average your wins and losses from trading and obtain
the true optimal fusing the Kelly formula.
Our highest TWR on this sequence of bets (trades) is obtained at .24, or
betting $1 for every $71 in our stake. That is the optimal geometric growth
you can squeeze out of this sequence of bets (trades) trading fixed fraction.
Let's look at the TWRs at different points along 100 loops through this
sequence of bets. At 1 loop through (9 bets or trades), the TWR for f = .16
is 1.085, and for f = .24 it is 1.096. This means that for 1 pass through
this sequence of bets an f = .16 made 99% of what an f = .24 would have made.